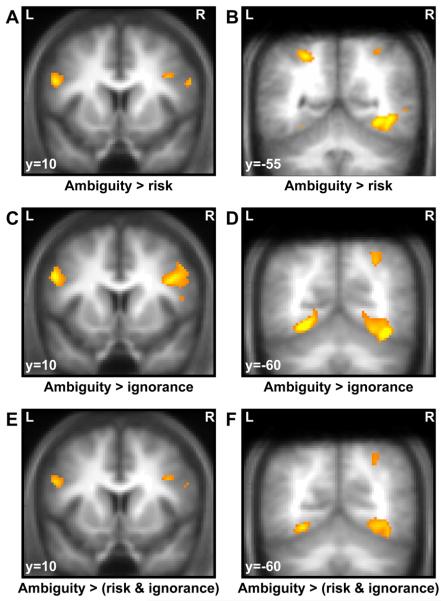
Figure 4.
BOLD responses to ambiguous cues, as compared to risky or ignorance cues. Clusters are overlaid on a mean T1-weighted image from all participants, and displayed at a voxel-level threshold of p < .001 (uncorrected) and small volume correction with regard to peak coordinates of previous studies as indicated in the methods section. A: Bilateral pIFG responses to ambiguous as compared to risky cues. B: Bilateral pPAR and occipital responses to ambiguous as compared to risky cues. C: Bilateral pIFG responses to ambiguous as compared to ignorance cues. D: Right pPAR and bilateral occipital responses to ambiguous as compared to ignorance cues. E: Bilateral pIFG responses to ambiguous as compared to both risky and ignorance cues (conjunction analysis, testing against conjunction null). F: Right pPAR and bilateral occipital responses to ambiguous as compared to both risky and ignorance cues (conjunction analysis, testing against conjunction null).

