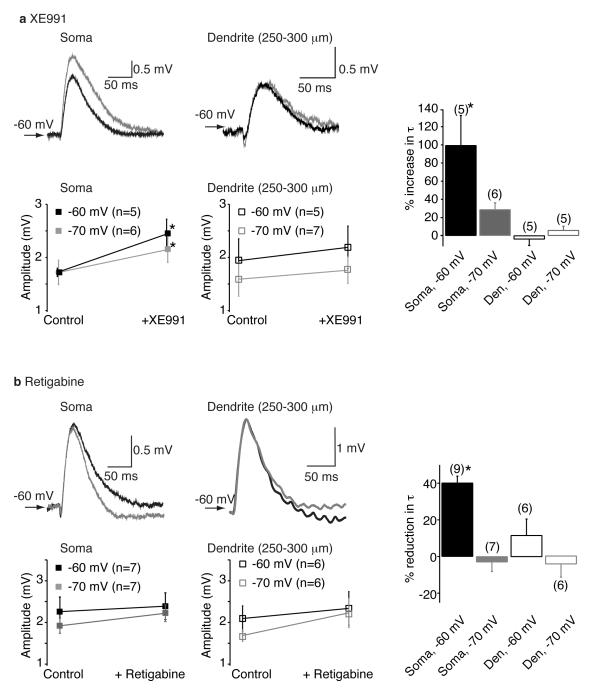
Fig 1.
Example traces showing the effects of (a) the KV7/M- channel blocker, XE991 (3 μM) and (b) the KV7/M- channel enhancer, retigabine (10 μM) on simulated EPSP (αEPSP) shapes at the soma and dendrites when evoked at a potential of −60 mV. Black traces represent controls whereas the red traces are those obtained following bath application of the KV7/M- channel modulator. Shown below the traces are the average (mean and S.E.M.) somatic and dendritic αEPSP amplitudes in the absence and presence of (a) XE991 and (b) retigabine at potentials of −60 mV and −70 mV. The observations for each point are indicated in brackets next to the potential. Within each panel, the percentage change in the decay time constant (τ) of αEPSPs at the soma and dendrites at either −60 mV or −70 mV is illustrated in the graph on the far right. In these particular graphs, the numbers of observations are indicated above each bar. Significance at p < 0.05 is indicated by an asterisk.

