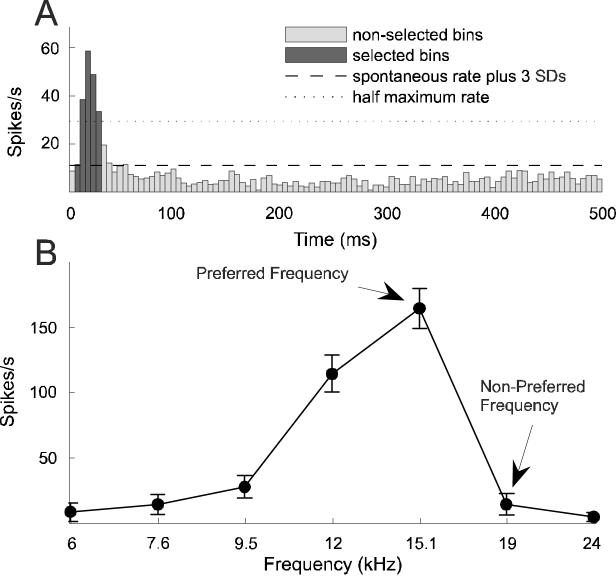
Figure 1.
Determination of response window and conditioning stimuli. A, An average post stimulus time histogram (PSTH, 5 ms resolution) was generated for each unit by averaging its responses over all mapping blocks and sweeps in order to determine its onset response window. Iso-intensity tuning curves, such as the pre-conditioning tuning curve in B, were based on the firing rates measured during this response window (dark bars), which included bins extending from the first one to exceed the spontaneous firing rate (measured 250-500 ms after stimulus onset) by at least 3 standard deviations (SDs) to the one preceding the first bin after the response fell to below 50% of the peak firing rate. Two frequencies were selected from the iso-intensity tuning curve to construct conditioning pairs, a preferred frequency (PF) and a non-preferred (NPF) one. The former had to lie within the range of frequencies to which the unit responded strongly, the latter outside of that range.

