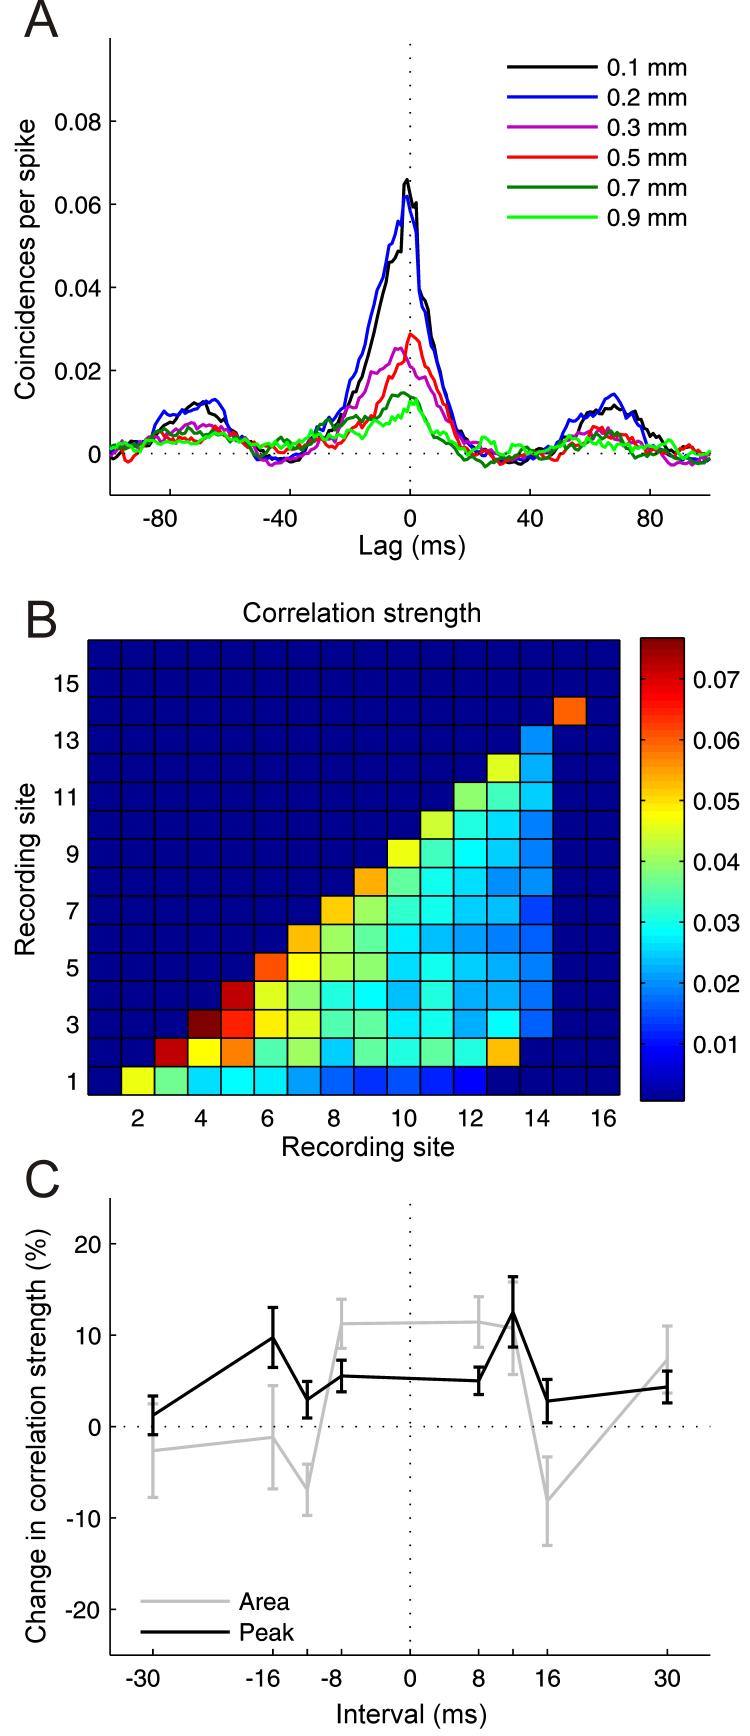
Figure 10.
Results from cross-correlation analysis. A, Cross-correlograms computed between recording sites separated by 0.1 to 0.9 mm on the same multi-site recording probe, smoothed by 3 ms boxcar function. B, Correlation strength measured by the average height of the cross-correlogram peak as a function of recording site combination. C, Changes in correlation strength measured by the area under the cross-correlogram and its peak height as a function of conditioning interval for recording sites separated by up to 0.3 mm (n = 104-292 for different intervals). Errors bars are ±one standard error of the mean.

