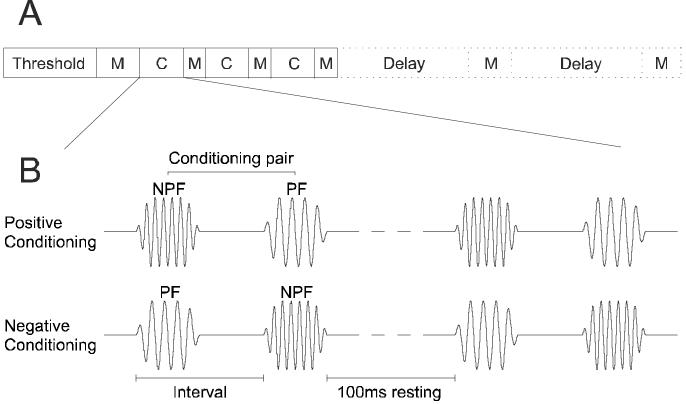
Figure 2.
Experimental procedure and conditioning stimuli. A, After determining unit threshold at each recording site, an iso-intensity tuning curve was obtained in an initial preconditioning mapping (M) block, which was followed by three alternating conditioning (C) and mapping blocks. In some cases, one or two additional mapping blocks were included after a delay, in order to probe the persistence of any changes in frequency tuning. B, Pairs of conditioning stimuli comprised two 5-ms pure tones of different frequencies (see Fig. 1). During positive conditioning the non-preferred frequency tone (NPF) preceded the preferred frequency tone (PF). During negative conditioning the order was reversed. The interval between the onsets of the two stimuli in a pair was either 8, 12, 16 or 30 ms, and the rest period between two consecutive pairs was fixed at 100 ms. Conditioning pairs were presented in blocks of 600.

