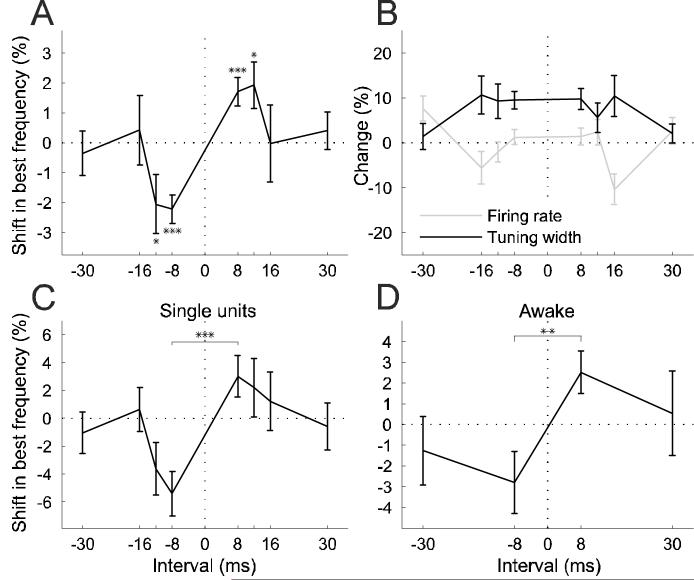
Figure 5.
Temporal specificity of conditioning effects. A, Shifts in best frequency as a function of conditioning interval, normalized by tuning width (sample size ranged from n = 73 to n = 183 for each interval). Negative intervals correspond to negative conditioning and positive intervals to positive conditioning. Negative shifts mean shifts away from the NPF, positive ones shifts towards the NPF. B, Conditioning-dependent changes in tuning width and firing rate for the same population as in A. C, Best frequency shifts for a subpopulation of single units (n = 19-39 for different intervals). D, Best frequency shifts for a population of tuning curves recorded in two alert ferrets (n = 24-30). * = p < 0.05, ** = p < 0.005, *** = p < 0.0005, t-test. Errors bars are ±one standard error of the mean.

