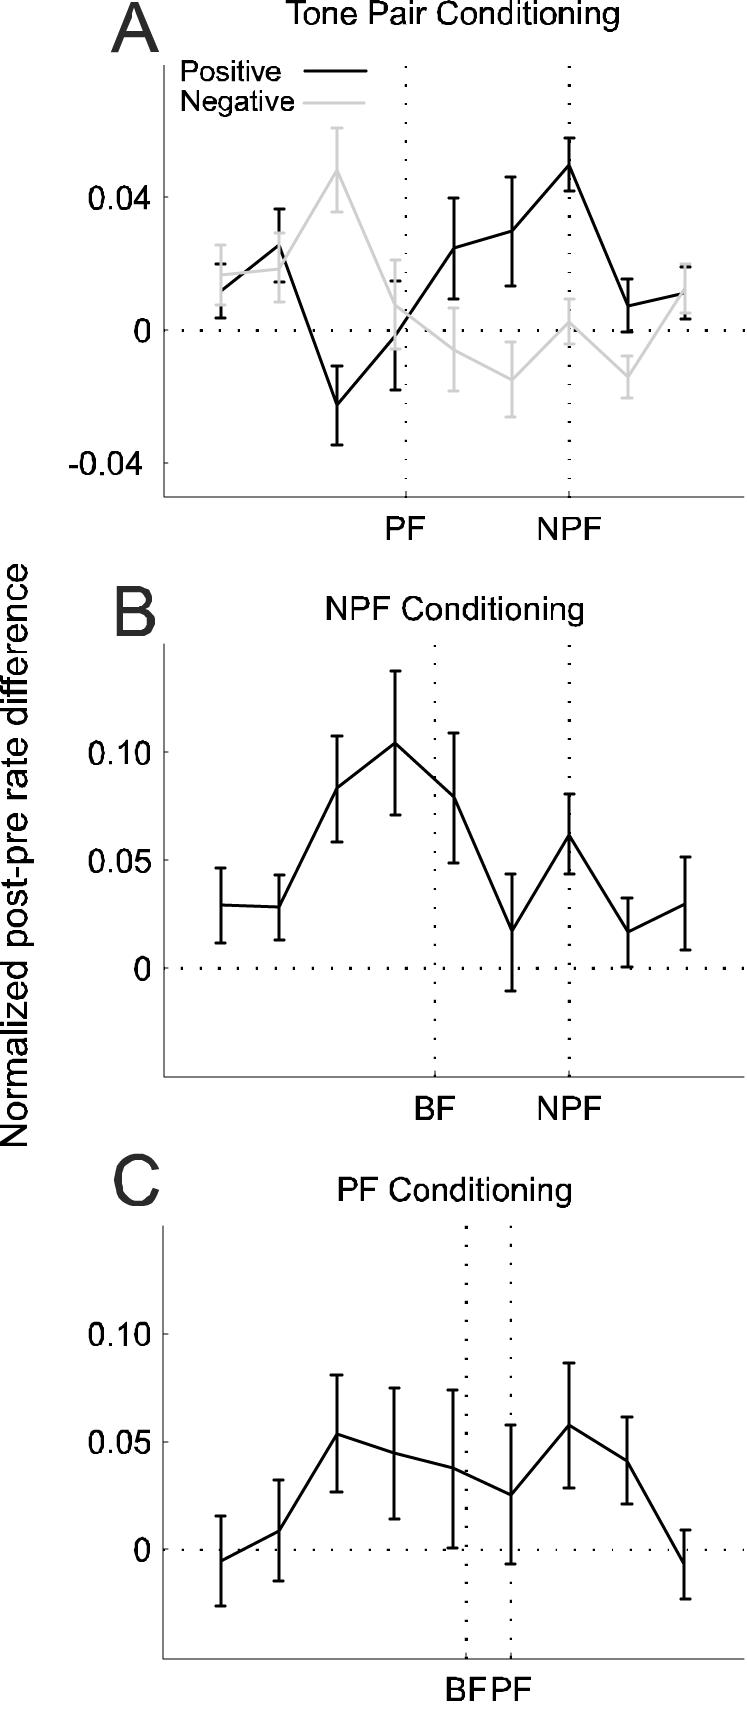
Figure 6.

Average difference-tuning curves. Subtracting pre-conditioning from post-conditioning tuning functions (see Methods) revealed the frequency regions where the response was potentiated or depressed by the conditioning procedures. A, Difference-tuning curves for positive (black, n = 311) and negative (gray, n = 273) conditioning with 8 and 12 ms intervals. While the non-preferred frequency (NPF) is known in each case, because the curves were aligned on this sound frequency, the PF marked on the x-axis represents the average value across all tuning curves. B, C, Difference-tuning curves for single-tone conditioning with an NPF or PF, respectively. The best frequency (BF) position marked on the x-axis represents the average BF across all curves. Errors bars are ±one standard error of the mean.
