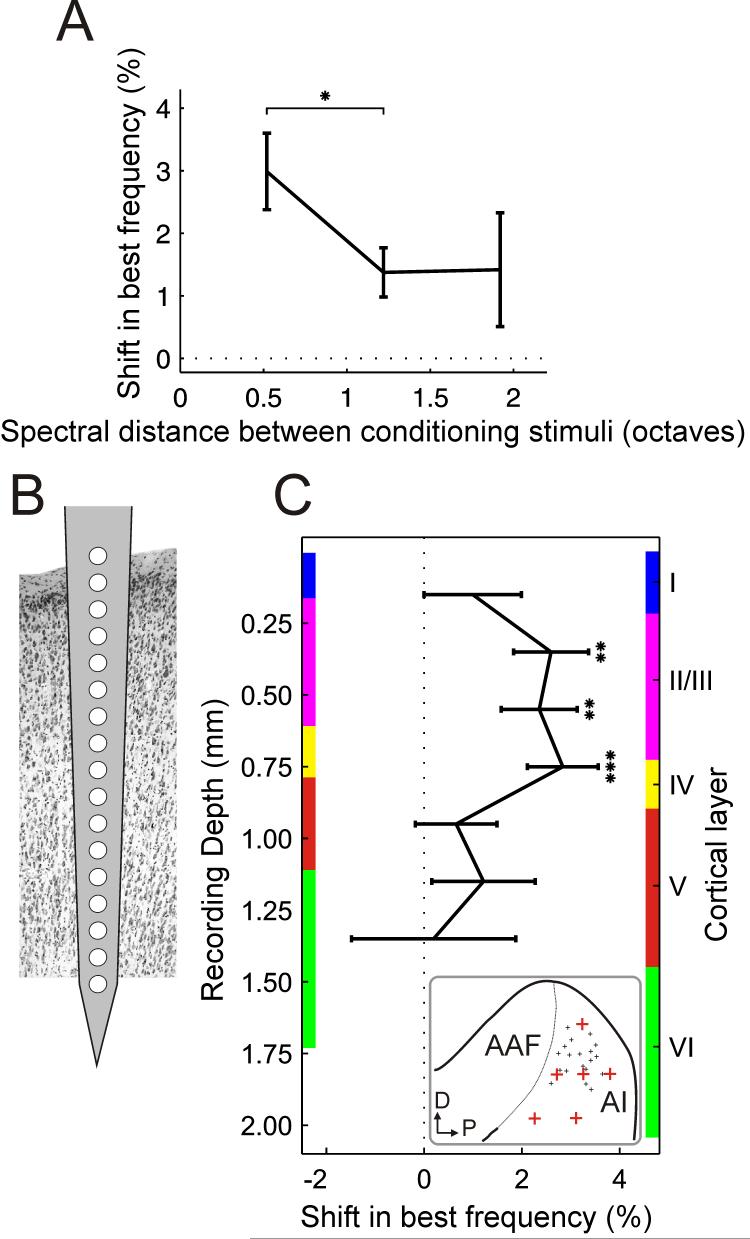
Figure 8.
Two factors affecting stimulus-timing-dependent plasticity. A, Best frequency shifts as a function of the frequency difference between the two stimuli in a conditioning pair (n = 54-326 for different frequency separations). B, Recordings were carried out with 16-site electrodes inserted perpendicular to the cortical surface. C, Best frequency shifts as a function of recording depth. Mean shifts were calculated for pairs of recording sites, excluding sites 1 and 16 from which hardly any recordings were made, and plotted as function of recording depth and cortical layer (n = 26-110 for different depths). Only data from conditioning with 8 and 12 ms intervals were considered and the sign of the results from negative conditioning was reversed so that the data could be pooled and plotted as shifts in the predicted direction. The thickness of the cortical layers was measured at six locations (depicted by the red crosses in the inset; the small black crosses indicate the locations of the recording sites) over the surface of A1 for two representative ferrets. Colored bars on either side of the graph show the thickness of the cortical layers measured at the thinnest (left) and thickest (right) of those six positions. A1, primary auditory cortex; AAF, anterior auditory field; D, dorsal; P, posterior. * = p < 0.05, ** = p < 0.005, *** = p < 0.0005, t-test. Errors bars are ±one standard error of the mean.

