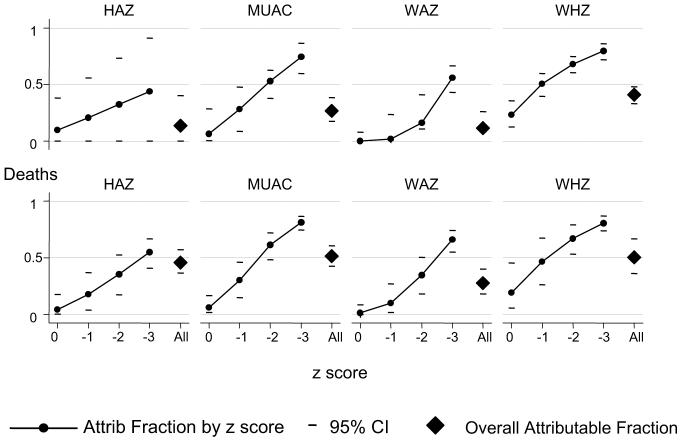
FIGURE 2.
The malnutrition-attributable (Attrib) fractions for admissions and deaths are shown according to z score and for all admissions. A separate graph shows the attributable fractions for each analysis, according to height-for-age z score (HAZ), weight-for age z score (WAZ), weight-for-height z score (WHZ), and midupper arm circumference (MUAC)-for-age z score. n = 12 207 for deaths and controls; n = 11 254 for admissions and controls.

