Figure 2.
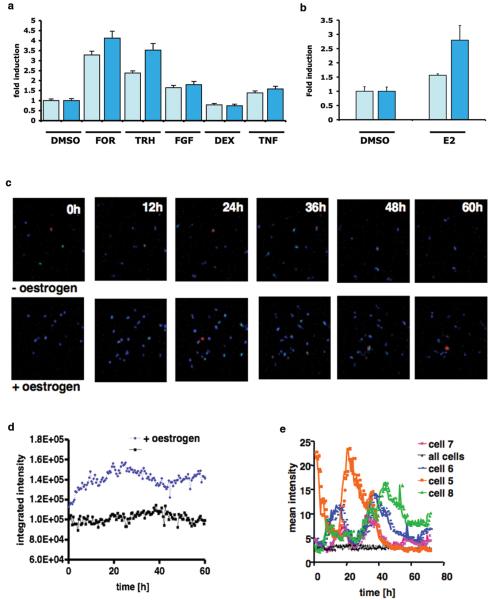
Analysis of cell lines stably transfected with the PRL-Luc BAC construct a) Stimulation of BAC cell lines and D44 cells (FOR, 1μM forskolin, TRH 300 nM, FGF-2 10 ng/ml, Dex 10 nM and TNF-α 10 ng/ml) for 8h. Results are shown as fold induction ± SD. b) Oestrogen (E2) stimulation of BAC cell lines and D44 (1nM) for 24h. Results are shown as fold induction ± SD c) Cell imaging. Oestrogen was added at time 0 and images for untreated (upper panels) and treated cells (lower panels) are shown. Scale bar, 125 μm; d) Total photon counts of a whole field of cells (~20 cells) with (blue) or without (black) addition of oestrogen; e) Quantification of the transcriptional activity in single cells under resting conditions. The data are the mean intensity of individual cell areas and the mean intensity of the whole field of cells (~ 20 cells).

