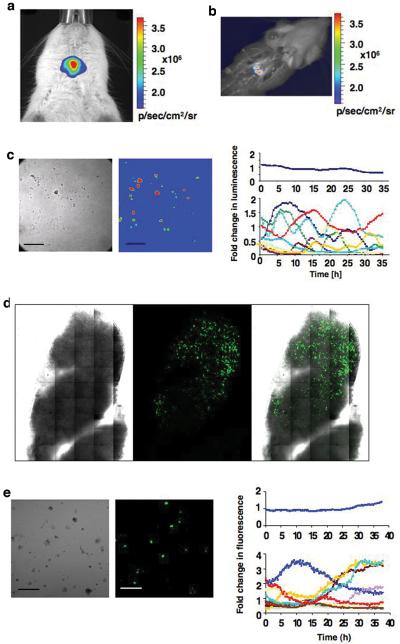
Figure 4.
In vivo imaging and ex vivo analysis of BAC PRL-Luc and PRL-d2eGFP transgenic rats. a) In vivo imaging of a female BAC PRL-Luc transgenic rat. The image was acquired with an IVIS Spectrum (Xenogen/ Caliper): 60s integration time, Bin (HR) 4, FOV 6.6, f1. b) Image taken after the rat has been euthanased. c) Ex vivo imaging of single cell preparations derived from PRL-Luc transgenic rat pituitary. Left: bright field image of the pituitary cells. Middle: pseudo-colour image of the same cells. Right: Quantification of the dynamic changes in luminescence from individual cells. Scale bar, 200 μm.
d) Tile scan imaging, with a 40x 1.3 fluar objective, of a pituitary thick section (400μm) from PRL-d2eGFP rat e) Ex vivo imaging of single cell preparations derived from PRL-d2eGFP rat pituitary. Left: bright field image of the pituitary cells. Middle: colour image of the same cells. Right: Quantification of the dynamic changes in fluorescence from individual cells. Scale bar, 200 μm.

