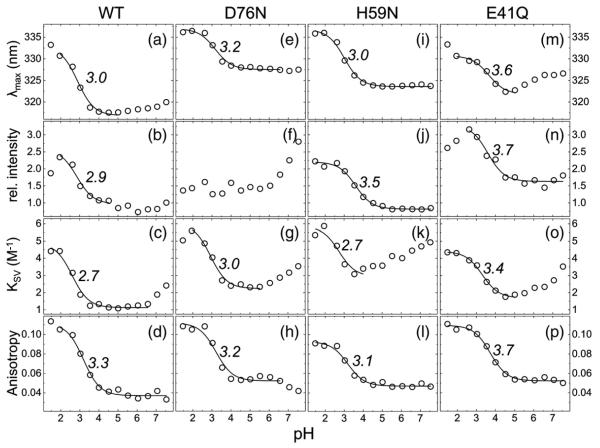
Fig. 3.
pH dependence of HdeB tryptophan fluorescence. Four different fluorescence properties over a pH range of 1.5 to 7.5 are shown: maximum of the emission peak, λmax (first row); relative intensity (second row); Stern–Volmer constant of quenching with acrylamide, KSV (third row); and steady-state fluorescence anisotropy (fourth row). These properties are displayed for HdeB WT (first column) and the mutants D76N (second column), H59N (third column), and E41Q (fourth column). The data (circles) were fitted with Eq. (3) (lines), and the obtained apparent pKa values are given.

