Fig. 5.
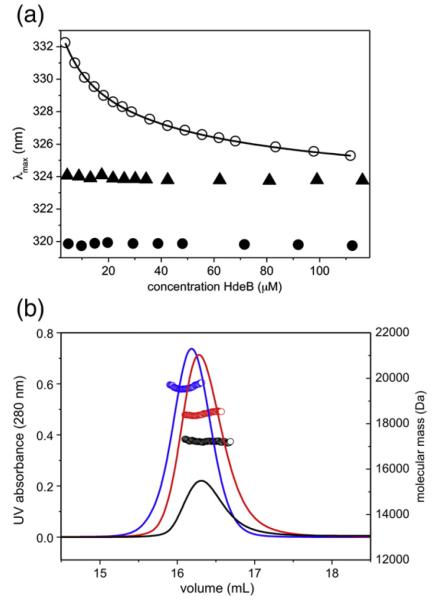
Concentration-dependent dissociation of HdeB E41Q. (a) The spectral position of the emission maximum is shown in relation to HdeB concentration for WT (filled circles) and the mutants H59N (triangles) and E41Q (open circles). A fit of the E41Q data to Eq. (9) is shown as a line. Concentrations are given as HdeB monomers. (b) Size-exclusion profiles of purified HdeB are given as absorbance at 280 nm (lines). Forty nanomoles of HdeB WT (blue) and E41Q (red) was injected. In addition, a smaller amount (10 nmol) of E41Q (black) was applied. Molecular masses over each profile were calculated from static light-scattering data (circles).

