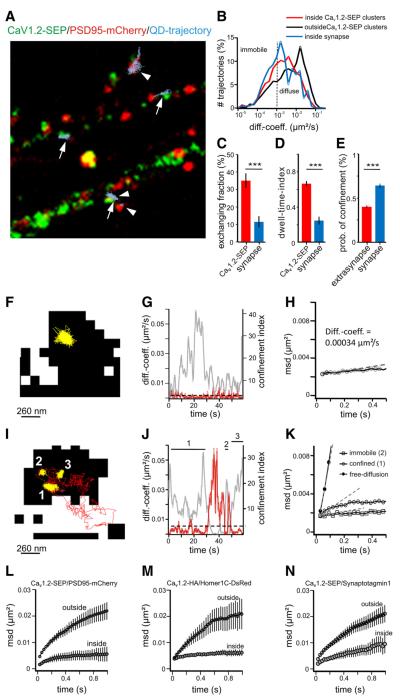
Figure 6.
SPT analysis reveals highly confined and exchanging CaV1.2s in synaptic and extrasynaptic regions of dendrites. A, Trajectories of QD-labeled CaV1.2-SEP channels (lightblue; arrows/arrowheads) relative to clusters CaV1.2-SEP (green) and PSD95-mCherry (red) in dendrites of hippocampal neurons. Note that trajectories are confined and preferentially localized at CaV1.2-SEP clusters and/or PSD95-m Cherry clusters. B, Distribution of diffusion coefficients (diff.coeff.) of channels in synapses (blue trace, 527 trajectories ncells = 20), CaV1.2-SEP clusters (red trace, 1315 trajectories, ncells = 20), and outside clusters (black trace, 1073 trajectories, ncells = 20) are significantly different (Mann-Whitney test, p < 0.0001). C, D, Fraction of channels exchanging between inside and outside of CaV1.2-SEP clusters (34.8 ± 4.2%, ntrajectories = 447, ncell = 23 of three cultures) and PSD95-m Cherry clusters (C) and their dwell time index in both compartments (D). E, CaV1.2-HA probability of confinement in the synaptic and extrasynaptic compartments. F–H, Example trajectory of a channel (yellow) in a CaV1.2–SEP cluster (black) (F) with diffusion coefficient (G, red) and MSD (H) characteristics for highly confined channels. I-K, Example trajectory of a channel switching between phases of immobility (yellow, 2), confined mobility (yellow, 1, 3), and free diffusion (red) partially outside the CaV1.2-SEP cluster (black). Corresponding plot of diffusion coefficients (J, red) and MSD functions given for each mode (K). L–N, MSD functions of channels relative to PSD95–mCherry (L), Homer1C-DsRed (M), and Synaptotagmin 1-Oyster 550 (N), are shown separately for trajectories inside and outside clusters of the respective synaptic marker.

