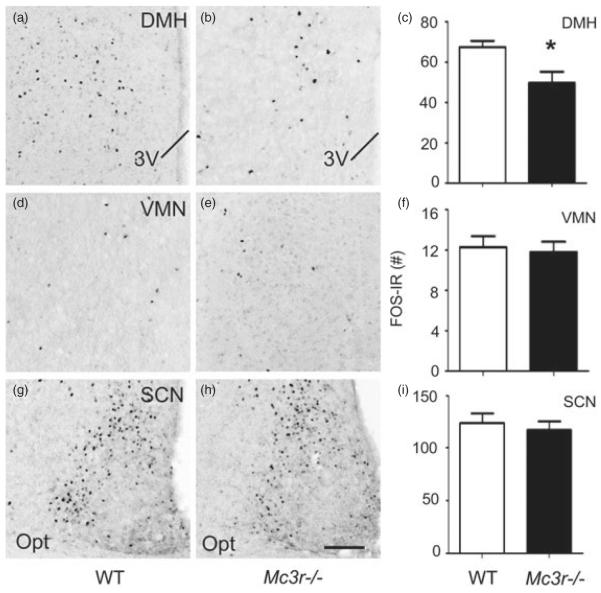
Figure 6. Mc3r−/− mice exhibit attenuated RF-associated neuronal activity in the DMH.
(a–c) Compared to WT controls (Fig. 5a–c), Mc3r−/− mice subjected to RF exhibit an attenuation of neuronal activity, indicated by FOS-IR, specifically within the DMH at bregma level of −1.82 mm. No significant differences were detected in the VMN (d–f; representative photomicrographs at bregma level: −1.56 mm) or SCN (g–i; representative photomicrograph at bregma level: −0.58 mm). Data in histograms (c, f and i) expressed as unilateral average SEM FOS-IR counts. *P < 0.05 ± vs. WT. The scale bar represents 100 μM.Brain samples were collected 90 min after food access was granted, as shown in Fig. 1a.

