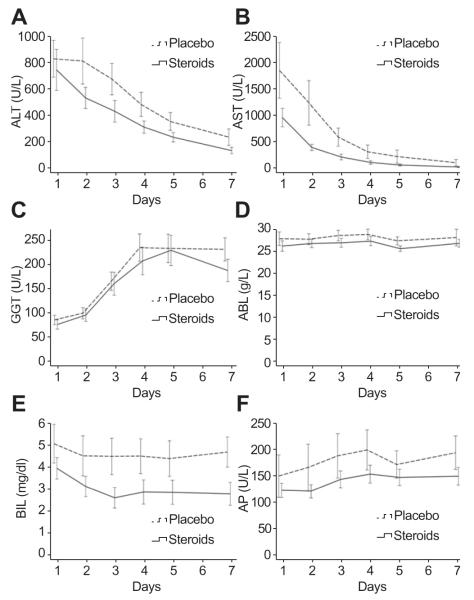
Fig. 2. Trajectories of liver function parameters in the first week after transplantation.
Mean values and standard errors of mean from day 1 to day 7 after transplantation are shown for (A) alanine transaminase (ALT) (p = 0.40), (B) aspartate transaminase (AST) (p = 0.13), (C) glutamyl transpeptidase (GGT) (p = 0.75), (D) serum albumin (ALB) (p = 0.32), (E) total bilirubin (BIL) (p = 0.14) and (F) alkaline phosphatase (AP) (p = 0.30).

