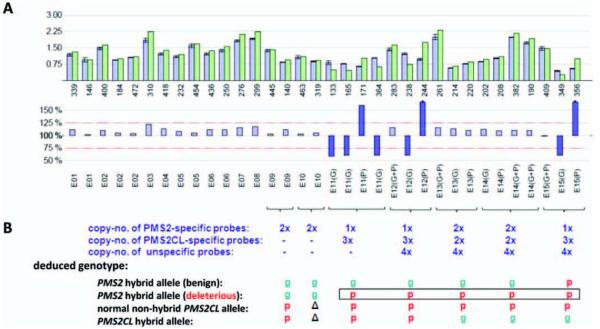
Figure 2.
MLPA results showing the deleterious hybrid PMS2 allele in patient TR13. (A) Bars in upper and lower histograms represent MLPA probes. Probe labels appear under the lower histogram. Probes for exons (E) 11–15 are designated gene-specific (G), pseudogene-specific (P), or nonspecific (G+P). Upper histogram: Lavender bars indicate mean probe signals with standard deviations for five of the selected reference DNAs reported in Table 2; green bars: probe signals for patient DNA. Numbers below the green bars indicate the amplicon size (in nts) of the corresponding MLPA probe. Lower histogram: the bar for each probe represents the probe signal for patient DNA as a percentage of the mean signal for the reference DNAs. Lavender bars represent percentages ranging from 75 to 125% (red dotted lines); larger discrepancies between patient and reference samples are represented by violet bars. (B) Number of DNA copies at sites hybridized by probes for exons 11–15 and deduced patient genotypes. Green “g”: PMS2-specific sequence; red “p”: PMS2CL-specific sequence; Δ: absent in PMS2CL (exon 10) (see text for explanation of these results). [Color figure can be viewed in the online issue, which is available at wileyonlinelibrary.com.]

