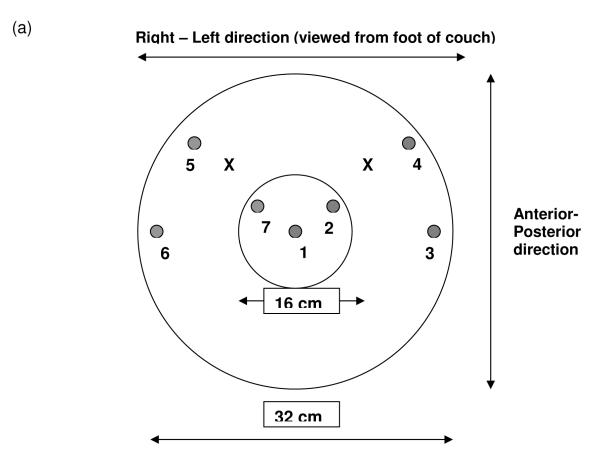
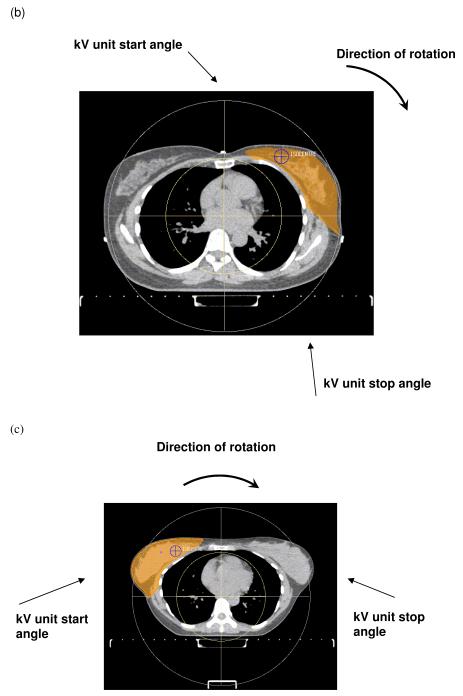
Figure 1.
(a) A schematic of the CT dose phantom showing the circular face. The left and right isocentre positions are indicated by crosses. The seven ionisation chamber measurement positions within the phantom are indicated by circles.
(b) Schematic of CT dose phantom overlaid on an example CT scan showing a left breast PTV (shown in orange).
(c) Schematic of CT dose phantom overlaid on an example CT scan showing a right breast PTV (shown in orange).


