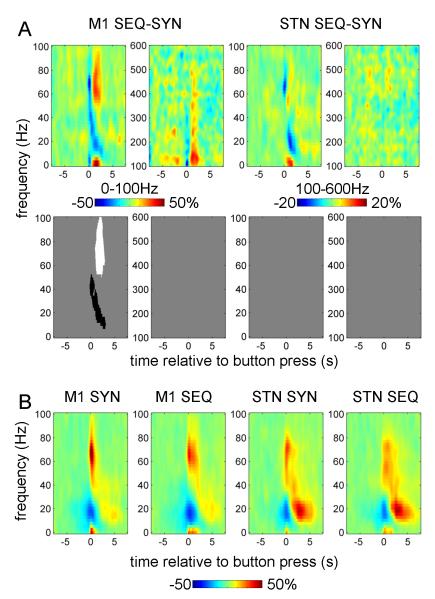
Figure 4.
Effect of task on power responses induced by button press in the contralateral M1 and STN
A. The top row shows the unthresholded contrast images (in pairs of low (0-100Hz) and high (100-600Hz) frequency spectrograms) corresponding to the effect of task in the ANOVA and the bottom row reports the corresponding significant clusters (p<0.01, cluster-level FWE correction).
B. Averaged power responses (in thr 0-100Hz band only) in M1 and STN for each of the two tasks separately.

