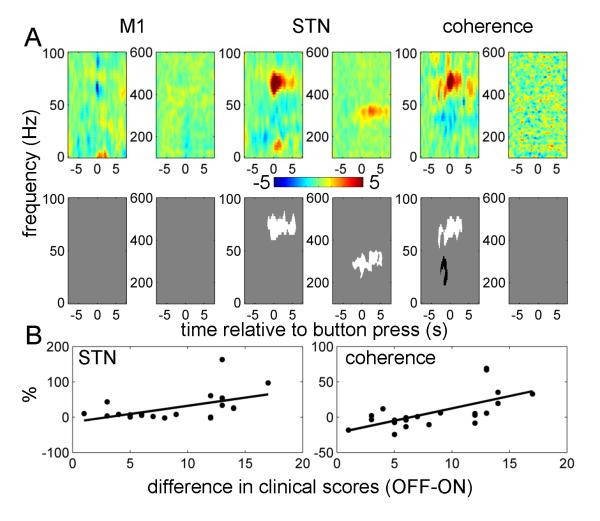
Figure 8.
Correlations between drug-induced changes in power and coherence responses with drug-induced changes in clinical scores.
Repeated measures ANCOVA was performed with contralateral hemibody bradykinesia-rigidity scores as an additional regressor. The sign of the scores was changed to negative so that positive correlations would correspond to clinical improvement.
A. The top row shows unthresholded contrast images corresponding to the effect of clinical score in the ANCOVA (the units are % change from baseline per unit change in motor UPDRS) and the bottom row reports the corresponding significant positive (white) and negative (black) clusters (p<0.01, cluster-level FWE correction).
B. Relation between the effects of drug in STN power and coherence responses in the 60-90Hz range and clinical improvement. Power and coherence responses were averaged over −0.5 to 0.5 s window. The solid lines show linear fit to the data (for STN power r2 = 0.27 p = 0.01, for coherence r2 = 0.42, p = 0.001).

