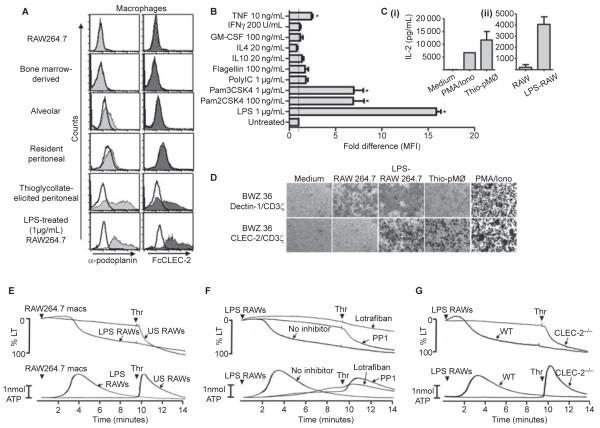
Fig. 1.
Podoplanin expression on macrophages. (A) Anti-podoplanin and FcCLEC-2 staining of various macrophage populations as indicated. Resident and thioglycollate-elicited peritoneal macrophages and resident alveolar macrophages were isolated from Balb/c mice by standard procedures. Bone marrow-derived macrophages (BMDMs) were generated from Balb/c mice by standard procedures. Filled histograms represent podoplanin staining (light grey) or FcCLEC-2 staining (dark grey). rIgG2a isotype control staining (left panel) or FcDectin-1 control staining (right panel) are represented by unfilled histograms. In all cases, detection of binding of the primary probe was with PE-conjugated secondary antibodies. Flow cytometry analysis was performed following excitation with 488 nm and detection with a 585 ± 42 nm band pass filter. Data are representative of at least three independent experiments. (B) The fold changes in podoplanin expression (represented by mean fluorescent intensities, MFI) by bone marrow-derived macrophages following stimulation for 20 h with various Toll-like receptor agonists and cytokines as indicated. Podoplanin expression was determined by flow cytometry as above. Data were generated from two independent experiments, each consisting of duplicate samples, normalized to the untreated control value and analyzed by one-way anova with Bonferroni post-tests to determine significant differences between untreated and treated cells. Error bars indicate the SEM. *P < 0.05 vs untreated control. (C) ELISA determination of interleukin (IL)-2 production from 1 × 10⁵ BWZ.36 CLEC-2/CD3ζ reporter cells (generated essentially as previously described [8]), following co-culture for 20 h with (i) thioglycollate-elicited macrophages (5 × 10⁵ to 1 × 10⁶) or PMA (65 nm) and ionomycin (2 μm) and (ii) unstimulated or LPS-treated (1 μg mL−1 for 20 h) RAW264.7 cells (1 × 10⁵ to 3 × 10⁵). The data were generated from two independent experiments. Error bars represent the SD. (D) X-gal staining using standard procedures of BWZ.36 CLEC-2/CD3ζ or Dectin-1/CD3ζ reporter cells following co-culture as before with various cell types as indicated, or stimulation with PMA/iomomycin as a positive control. Images are representative of at least three independent experiments (thioglycollate elicited peritoneal macrophages [Thio-pMØ]). (E) Unstimulated (US) or LPS-stimulated (1 μg mL−1 for 20 h) RAW264.7 macrophages (macs) were added to washed mouse platelet suspensions (3 × 10⁸ platelets per mL) at a macrophage:platelet ratio of 1:15. After 10 min, 0.1 U per mL thrombin (Thr) was added to assess the extent of the response elicited by the macrophages. (F) Washed platelets (3 × 10⁸ platelets per mL) in the absence or presence (arrows) of the Src family kinase inhibitor PP1 (10 μm) or the αIIbβ3 inhibitor lotrafiban (10 μm) were stimulated with LPS-activated RAW264.7 cells (macrophage:platelet ratio 1:15) for 10 min, followed by the addition of 0.1 U mL−1 thrombin. (G) CLEC-2-deficient washed platelets and platelets from litter-matched wild-type controls (3 × 10⁸ platelets per mL) were stimulated with LPS-activated RAW264.7 cells for 10 min, followed by the addition of 0.1 U per mL thrombin. Aggregation was quantified as a function of light transmission (LT), with 100% aggregation corresponding to 100% light transmission. Adenosine triphosphate (ATP) secretion was measured by the luciferase-luciferin method. Representative traces from three independent experiments shown. Arrowheads indicate agonist addition.

