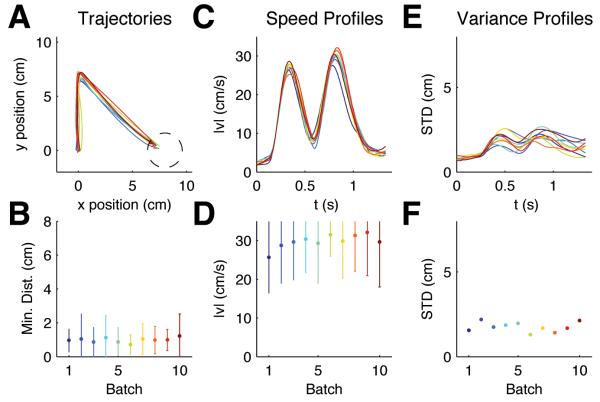
Figure 2.
Evolution of motor responses to random target jumps. (A) Mean trajectories for ±90° target jumps over batches of 200 trials, approximately 5% of which were ±90° target jump trials. Dark blue colors indicate early batches, red colors indicate later batches. (B) The lower panel shows that subjects' performance did not significantly improve over trials. Error bars indicate standard deviation over all trials and subjects. (C) Mean speed profiles for ±90° target jumps of the same trial batches. A second velocity peak is present right from the start. (D) The lower panel shows the evolution of the magnitude of the second speed peak. (E) Standard deviation for ±90° target jumps computed over the same trial batches. Over consecutive batches the variance remains constant. (F) Standard deviation over the last 500ms of movement.

