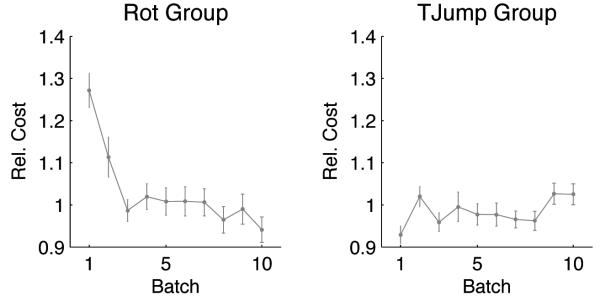
Figure 3.
Left Panel: Rotation Group. Relative cost of subjects' movements in response to ±90° visuomotor rotations. Over trial batches (200 trials) the cost of the adaptive strategy decreases. Right Panel: Target Jump Group. Relative cost of subjects' movements in response to ±90° target jumps. There is no improvement over trials. In both cases the costs have been computed by calculating the control command and the state space vectors from the experimental trajectories by assuming a quadratic cost function. The cost has been normalized to the average cost of the last three trial batches.

