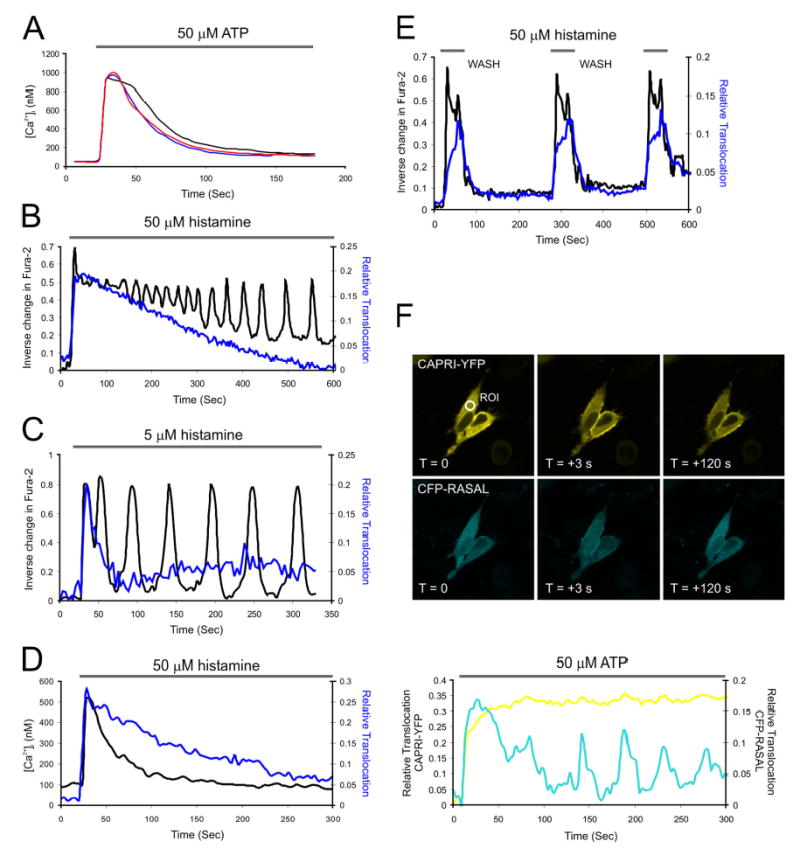
Figure 2. CAPRI is refractory to Ca2+ oscillations.

(A) Ca2+ mobilization induced by application of 50 μM ATP in CHO cell lines. Black = parental CHO T cell response (n = 35 cells); blue = CHO-CAP6 clone stably expressing CAPRI (n = 57 cells); red = CHO-MUT13 clone stably expressing CAPRI (R473S) (n = 23 cells). (B) Representative trace of the change in Fura-2 emission (black trace) and GFP-CAPRI translocation (blue trace) from a single cell displaying sinusoidal Ca2+ oscillations after 50 μM histamine. (C) Representative trace of the change in Fura-2 emission (black trace) and GFP-CAPRI translocation (blue trace) from a single cell displaying baseline Ca2+ spikes after 5 μM histamine. (D) Ca2+ mobilization in HeLa cells (black trace) after 50 μM histamine with sequential RFP-CAPRI translocation (blue trace, average n = 5 experiments) (E) Reversibility of GFP-CAPRI translocation by histamine. Change in Fura-2 emission indicated in black, relative CAPRI translocation in blue. Cells stimulated with 50 μM histamine for 60 s, followed by wash-out of agonist, followed by re-stimulation for 60 s as shown (average n = 3 cells). (F) Translocation of CAPRI-YFP and CFP-RASAL induced by 50 μM ATP in HeLa cells.
