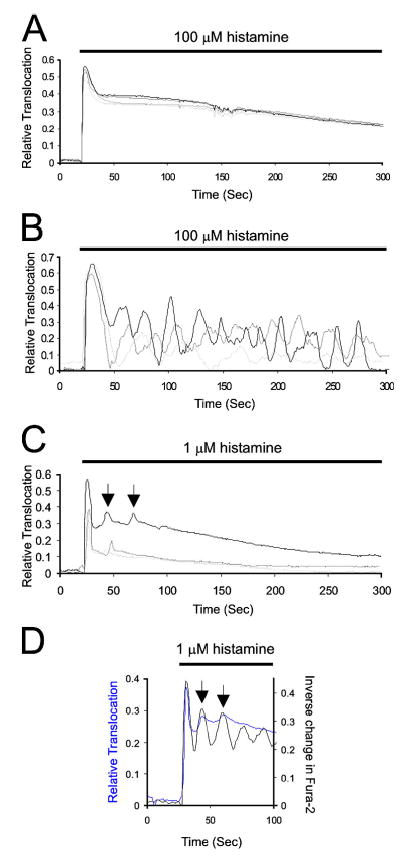
Figure 4. TIRFM.

(A) GFP-CAPRI translocation induced by 100 μM histamine monitored by TIRFM (representative experiment for n = 4 cells). (B) GFP-RASAL translocation induced by 100 μM histamine monitored by TIRFM (representative experiment for n = 3 cells). (C) Representative experiment of GFP-CAPRI translocation in HeLa cells stimulated with 1 μM histamine (n = 3 cells). Arrows indicate mini-oscillations in one trace; similar oscillations are also detectable in other cells as shown. (D) Representative trace of sequential Fura-2 (black trace; single wavelength 380-nm excitation) and TIRF imaging of GFP-CAPRI (blue trace). Mini-oscillations correlate with cytosolic Ca2+ spikes.
