Figure 1.
Properties of glycine single channels recorded in the cell-attached configuration from rat spinal motoneurones in vitro
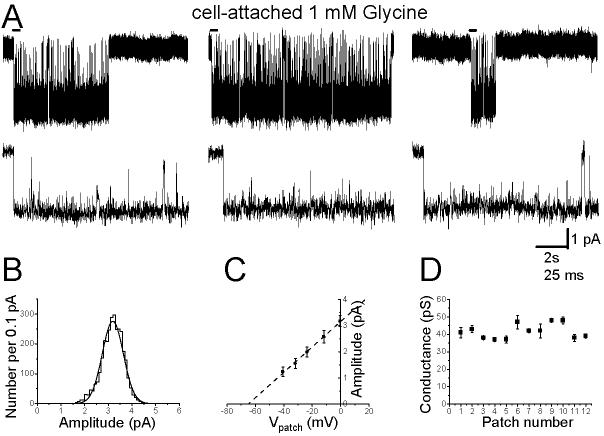
The traces in panel A show clusters of single channel openings evoked by 1 mM glycine. The beginning of each cluster (indicated by the bar) is shown on an expanded time scale below each cluster. Panel B shows the distribution of fitted amplitudes obtained in this patch at a transmembrane holding potential of 0 mV. Only openings longer than two filter rise times are included and the distribution is fitted with a single Gaussian component. Means from such fits, for openings recorded at different transmembrane potentials, give the current-voltage plot shown for this patch in panel C. Data in the current-voltage plots were fitted to straight lines in order to estimate the (slope) conductance value for each patch. A summary of these results is shown in panel D.

