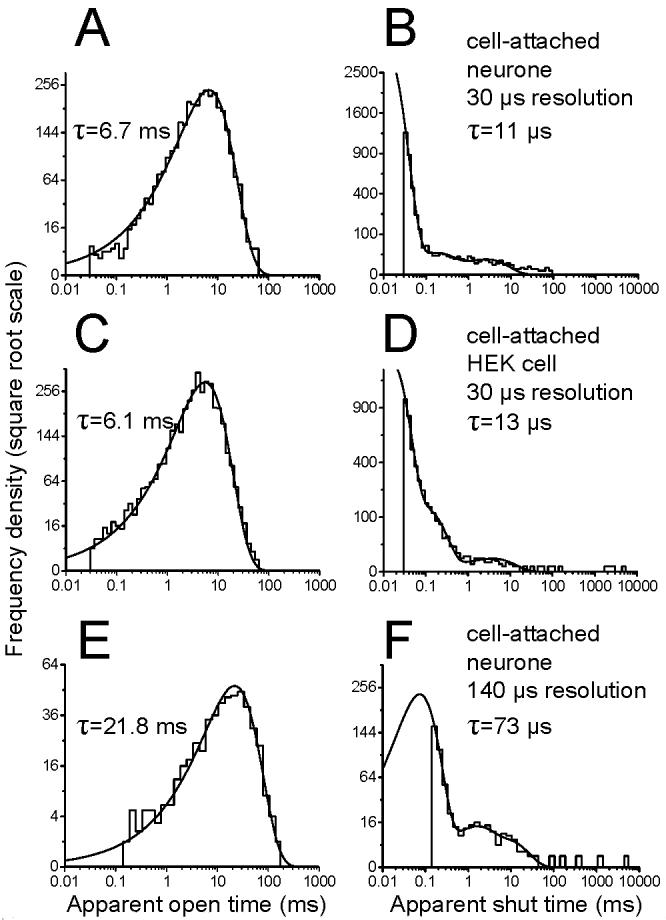
Figure 2.

The dwell time distributions of high-resolution recordings from native channels are similar to those obtained from recombinant α1β channels.
The top row of graphs shows the open period (A) and the shut time (B) distributions for native GlyRs for a recording with optimal (30 μs) time resolution. Note the similarity with the data from recombinant α1β receptors expressed in HEK293 cells (panels C and D, data from Burzomato et al., 2004) recorded at the same resolution. There is good agreement between the values for the time constants for open periods and for the fastest component in the shut time distribution.
The bottom row of graphs shows distributions from a native patch with a less favourable signal-to-noise ratio, in which only events longer than 140 μs were resolved. Note the differences in the open and shut time distributions (E, F). These differences are only apparent and are due to the distortion introduced by a greater number of missed events. Imposing the same resolution on the patch shown in the top row produces distributions similar to those observed in the low resolution native patch (details in the text).
