Figure 4.

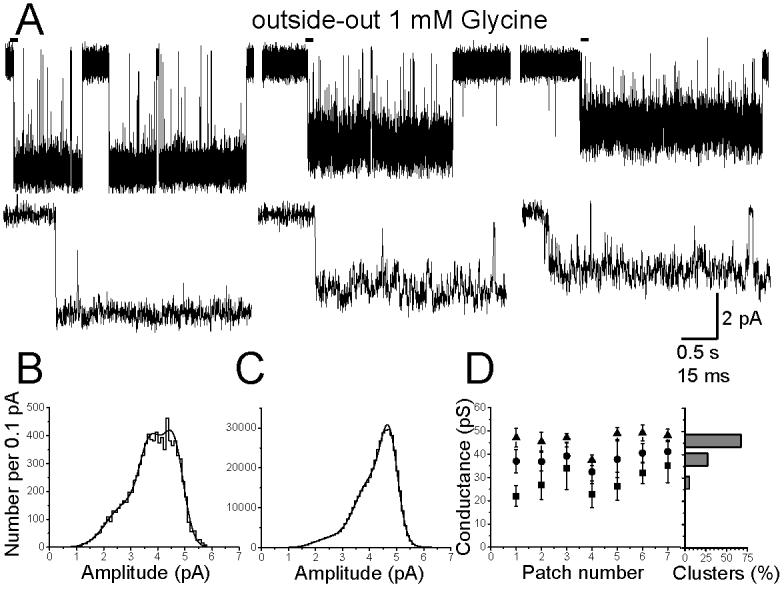
Glycine channels open to several conductance levels in outside-out patches.
The traces in panel A (top) show clusters of openings elicited by 1 mM Gly in the same patch. Three conductance levels are present but each cluster of openings only visits one level. The traces in the second row are expanded from the beginning of each cluster (bars). Inspection of these traces clearly shows that openings to the two lower levels have higher open channel noise and shorter open times.
Panels B and C show the distribution of amplitudes for the openings from the same patch: in B the fitted amplitudes are shown (each opening is one event), whereas C is an open point histogram, and effectively weights the contribution of each opening by its duration. The greater predominance of the largest conductance in C is due to the longer duration of its openings.
Panel D summarises our findings across all seven patches. For each patch, the symbols show the values for each conductance obtained from the Gaussian fits to the fitted amplitude distributions (all patches were held at −100 mV). The bar chart on the right displays the overall proportion of clusters (out of the total of 237) that fell in each of the conductance levels.
