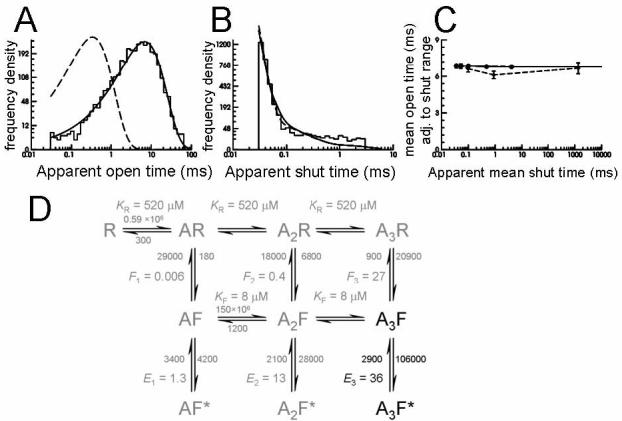
Figure 6.

Estimating the fully-liganded gating rates for GlyRs recorded in the cell attached configuration from spinal neurones in vitro
Data from the two best high-resolution recordings were fitted by maximum likelihood to the mechanism shown in panel D (the “flip” mechanism of Burzomato et al., 2004). Because our native data were obtained at a single, saturating Gly concentration, only the fully-bound gating rates (black in the mechanism) were estimated in the fit. Rate constants connecting the other states (grey) were constrained to the values estimated for recombinant α1β heteromeric GlyR by Burzomato et al. (2004).
The graphs in the top row show that the values of rate constants optimized in this process describe the data adequately, in that they predict distributions of apparent open periods (A) and shut times (B) similar to the observed data (shown as histograms; note that the fit is to the actual sequence of openings and shuttings after idealisation, not to the distributions shown here). Dashed lines show the distributions predicted for infinite resolution (i.e. no missed events). Note the profound effect of missing the very common short shut times on the apparent open time distribution. In the case of “infinite” resolution this would have a main exponential component with a time constant of 345 μs and a relative area of 99.3%).
The mechanism and its fitted rates also adequately describe the shape of the correlation between mean open periods adjacent to gaps in the specified range (shown in C). Here observations are shown as diamonds connected by dashed lines and the values calculated from the mechanism as filled circles connected by a solid line.
