

Abstract
Background
Differentiating between appropriate and inappropriate resource use represents a critical challenge in health services research. The New York University Emergency Department (NYU ED) visit severity algorithm attempts to classify visits to the ED based on diagnosis, but it has not been formally validated.
Objective
To assess the validity of the NYU algorithm. Research Design: A longitudinal study in a single integrated delivery system (IDS) from January 1999 to December 2001.
Subjects
2,257,445 commercial and 261,091 Medicare members of an IDS.
Measures
ED visits were classified as emergent, non-emergent, or intermediate severity, using the NYU ED algorithm. We examined the relationship between visit-severity and the probability of future hospitalizations and death using a logistic model with a general estimating equation (GEE) approach.
Results
Among commercially insured subjects, ED visits categorized as emergent were significantly more likely to result in a hospitalization within one-day (OR=3.37, 95% CI: 3.31–3.44) or death within 30-days (OR=2.81, 95% CI: 2.62–3.00) than visits categorized as non-emergent. We found similar results in Medicare patients and in sensitivity analyses using different probability thresholds. ED overuse for non-emergent conditions was not related to socio-economic status or insurance type.
Conclusions
The evidence presented supports the validity of the NYU ED visit severity algorithm for differentiating ED visits based on need for hospitalization and/or mortality risk; therefore, it can contribute to evidence-based policies aimed at reducing the use of the ED for non-emergencies.
Keywords: Access/Utilization of Services, Health Care Financing/Insurance, Emergency Care, NYU Algorithm, Billings
Introduction
Emergency Departments (EDs) in the United States are under considerable strain from high visit volumes, including many visits for non-emergent conditions. Often, visit demand exceeds capacity within individual EDs resulting in ambulance diversions [1–5]. Patients with non-emergent concerns are estimated to compromise as much as twenty to forty percent of U.S. ED visits [6–7]. The reasons patients choose the ED for non-emergent conditions are varied and include convenience, patient perception of disease severity, the immediate availability of diagnostic imaging and specialty care, phone referral by an advice line or a primary care provider (PCP), and limited access to PCPs [8–15]. In response, there have been many attempted interventions such as making PCP appointments more readily available, raising ED visit co-payments, and ED triage to alternative sites such as urgent care clinics, but a validated measure does not exist to quantify their effects on visits for emergent and non-emergent conditions [16–19].
Given the high cost of ED care relative to other settings and increased overcrowding, identifying methods to reliably differentiate between emergent and non-emergent conditions, i.e., appropriate and inappropriate conditions for treatment in the ED, represents a critical first step in improving the delivery of care. To address this, we set out to validate an algorithm developed by researchers at New York University (NYU) to assess the level of severity associated with ED visit diagnoses; this NYU algorithm provides the probability that each ED visit ICD-9 diagnosis code falls into one of four severity categories [20–22]. The NYU algorithm was developed with the help of a panel of emergency physicians and was based on information obtained from comprehensive chart reviews (including patient complaint and clinical data, ED resource use and final diagnosis) of nearly 6,000 patients treated in Bronx, NY hospitals in 1994 and 1999. Because the NYU algorithm uses standardized diagnosis and payment codes, it is non-proprietary and easily accessible/downloadable (SAS/SPSS/ACCESS) from NYU’s Center for Health and Public Service Research’s Website [22]. The NYU algorithm has the potential to be a powerful tool for health services researchers interested in studying the quality of ED care and approaches to improve health care efficiency. For example, the NYU algorithm has been adapted for use by the Centers for Disease Control and Prevention (CDC) to describe the characteristics of high safety-net burden EDs and has been utilized by several states and municipalities to track ED visit patterns [6–7, 23–24]. But to date, the NYU algorithm has not been formally validated.
In this study, we describe the predictive validity of an approach for classifying ED visit severity using the NYU algorithm. Specifically, we categorize all ED visits occurring in a large, prepaid integrated delivery system (IDS), and examine the association between the severity of the ED diagnosis and the probability of future hospitalizations or death.
Methods
Setting and Study Population
All subjects were members of a prepaid IDS, Kaiser Permanente-Northern California (KPNC). The study population included all active health system members as of January, 1999 (2,782,154), excluding members who regularly received part of their care outside the IDS (5.5%) and members age<1 year (1.2%). Because this validity study was part of a larger study to examine the effects of ED cost-sharing on ED visits, we separated the analysis of Medicare and commercial members and excluded members with Medicaid (1.9%) because they did not have copayments, IDS employees (0.9%) because they could self-select their copayment level, and subjects who changed insurance-type (e.g. commercial to Medicare) during the study period (1.7%).
Study Design and Rationale
We examined, at the individual patient level, the association between the severity of the ED visit diagnosis, using the probability that each ICD-9 visit diagnosis was associated with each of four categories in the NYU algorithm, and subsequent hospitalizations or deaths. We tested the hypothesis that if visits classified as high severity were in fact true emergencies, they would be followed by relatively higher proportions with near term hospitalization and mortality, and that if visits classified as low severity were true non-emergencies, there would be relatively lower proportions with subsequent hospitalizations or death. The Kaiser Foundation Research Institute (KFRI) institutional review board (IRB) approved the study.
Classification of ED Visit Diagnoses
We collected data on ED visits, hospitalizations, and deaths from the IDS’s automated clinical databases for the 36-month study period (1/1999–12/2001), and determined the severity of the ED visit condition using the NYU algorithm [20–22]. The NYU algorithm assigns the probability that each ICD-9 diagnosis code associated with an ED visit falls into one of four categories: 1) a non-emergency (NE); 2) an emergency (defined as a problem requiring contact with the medical system within 12 hours) treatable in an office visit (primary care treatable (PCT)); 3) an emergency not treatable in an office visit but preventable or avoidable (EPA) and 4) an emergency that is not preventable or avoidable (ENPA) (Figure 1). The algorithm excludes uncommon diagnoses and treats mental health (2.1% of all ED visits) and substance abuse (0.9%) diagnoses separately. We then used the probabilities derived from ICD-9 diagnosis codes to classify each ED visit as emergent or non-emergent (Figure 2). Specifically, we:
Figure 1.
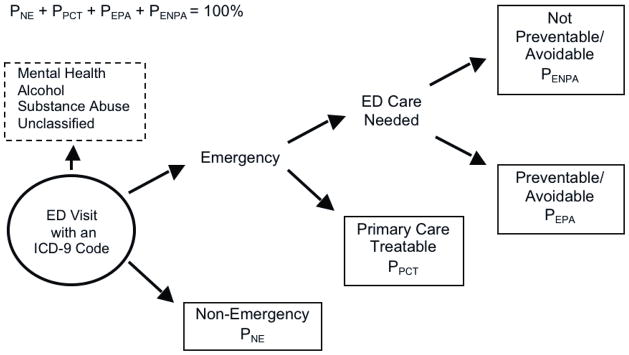
NYU Algorithm for classifying diagnoses
Figure 2.

Classification of ED Visits
We excluded 35,071 ED visits that had only mental health, alcohol or substance abuse diagnoses.
Calculated the severity category probabilities for all diagnoses associated with each ED visit using the NYU algorithm
Combined the four severity category probabilities into two levels, i.e., emergent and non-emergent for each diagnosis, using the dominant probability.
Classified each visit as emergent or non-emergent using the classification of the most emergent diagnosis
For example, if a visit diagnosis had a 10% probability of being a non-emergency (NE, severity category 1), a 39% probability of being a primary care treatable emergency (PCT, severity category 2), a 40% probability of being an emergency not treatable in an office visit but preventable or avoidable (EPA, severity category 3), and a 11% probability of being an emergency not preventable or avoidable (ENPA, severity category 4), we would combine the probabilities of the first two severity categories (10%+39%=49%) to yield a 49% probability of being non-emergent, and combine the probabilities of the last two severity categories (40%+11%=51%) to yield a 51% probability of being emergent. This visit diagnosis would then be then classified as emergent because it exceeded our 50% threshold (Figure 2). When there was a 50% probability of being both emergent and non-emergent, we classified the visit as “intermediate.”
In sensitivity analyses, we examined probability thresholds of 75% and 90% for classifying ED visits, and for dichotomizing the NYU algorithm’s four severity categories. With these sensitivity analyses, in which visits were classified as intermediate if neither emergent or non-emergent sums were greater than the chosen threshold (75% or 90%), we sought: 1) an additional check for our results (we would expect more intermediate classifications with the 90% threshold and a very strong association between visits with a 90% probability of being emergent and subsequent unfavorable clinical events) and 2) to provide future researchers with several validated thresholds for application of the NYU algorithm. Specifically, we anticipate that some studies will need to classify all visits, whereas others will aim to identify visits with a high probability of being either non-emergent or emergent and have less emphasis on classifying all visits.
Outcome Measures; Hospitalizations and Deaths
Within our study population, we identified hospitalizations and deaths occurring both in and outside the IDS. We focused on hospitalizations occurring on the same day of the ED visit as well as within one and seven days, and deaths within 30-days of the ED visit. For in-system outcomes, we used internal clinical databases and for out-of-system hospitalizations we used our referral and claims databases. For out-of-system deaths, we searched the California State death certificate databases. These databases have been very accurate in previous studies, e.g., 100% for the occurrence of a hospitalization [25–26]. During the study, 13% of ED visits and 7% of hospitalizations occurred outside the IDS; similarly, 14% of deaths were outside the IDS, i.e., deaths identified only in state death certificates.
Covariates
Socio-demographic information on age, gender, and neighborhood socio-economic status (SES) was obtained. The neighborhood SES measure includes information on both mean annual household income and level of educational attainment at the census-block level, and uses information from the 2000 US Census and from home addresses (geocoding) [27]. Clinical covariates were utilization levels in the prior calendar year for the ED, office visits, and hospitalizations, and comorbidity levels using the diagnostic cost group (DxCG) score [28]. The DxCG approach is based on both inpatient and outpatient diagnoses; Medicare currently uses this approach for risk adjustment. Health system covariates were ED and drug cost-sharing levels, having a regular primary care provider, and medical center of the ED visit. We also adjusted for the year and month of the ED visit by including two-indicator variables for the three-year study period and 11-indicator variables for the 12-months in each year.
Statistical Analysis
To examine the association between our classification of the severity of an ED visit and the probability of a subsequent hospitalization within one day or death within 30-days, we used generalized estimating equation (GEE) methods to estimate model parameters. Since subjects may have had multiple visits during the three year study period, we used a logistic model within a GEE (xtlogit, pa in Stata 8.2) to examine the probability of a hospitalization or death, while explicitly modeling the within-subject correlation. The models included indicators for two of the three ED visit categories (coded 0/1) along with the covariates listed above. We included medical center as a fixed effect, but did not examine models with additional practice-based design effects. We repeated these analyses using the high severity probability (EPA, ENPA) as a continuous variable. In sensitivity analyses, we examined associations with hospitalizations on the same day and within seven-days of the ED visit as seen in Table 3.
Table 3.
Adjusted Association Between Visit Diagnosis Categories (3-categories) and Subsequent Hospitalizations or Death
| Commercial | Medicare | |||||||
|---|---|---|---|---|---|---|---|---|
|
Hospitalization on the Same Day as the ED Visit
| ||||||||
| OR | SE | 95% | CI | OR | SE | 95% | CI | |
| Non-emergent | 1.000 | 1.000 | ||||||
| Intermediate | 2.561 | 0.042 | 2.479 | 2.645 | 2.252 | 0.039 | 2.176 | 2.330 |
| Emergent | 3.787 | 0.045 | 3.699 | 3.876 | 3.789 | 0.049 | 3.695 | 3.885 |
|
| ||||||||
|
Hospitalization within One-Day of the ED Visit
| ||||||||
| OR | SE | 95% | CI | OR | SE | 95% | CI | |
| Non-emergent | 1.000 | 1.000 | ||||||
| Intermediate | 2.303 | 0.032 | 2.241 | 2.367 | 2.085 | 0.032 | 2.024 | 2.149 |
| Emergent | 3.373 | 0.034 | 3.308 | 3.440 | 3.500 | 0.039 | 3.426 | 3.577 |
|
| ||||||||
|
Hospitalization within Seven-Days of the ED Visit
| ||||||||
| OR | SE | 95% | CI | OR | SE | 95% | CI | |
| Non-emergent | 1.000 | 1.000 | ||||||
| Intermediate | 2.033 | 0.026 | 1.982 | 2.085 | 1.890 | 0.027 | 1.837 | 1.944 |
| Emergent | 2.907 | 0.027 | 2.856 | 2.960 | 3.015 | 0.031 | 2.954 | 3.076 |
|
| ||||||||
|
Death within 30-days of the ED Visit
| ||||||||
| OR | SE | 95% | CI | OR | SE | 95% | CI | |
| Non-emergent | 1.000 | 1.000 | ||||||
| Intermediate | 2.175 | 0.101 | 1.985 | 2.382 | 1.713 | 0.050 | 1.617 | 1.814 |
| Emergent | 2.806 | 0.098 | 2.621 | 3.004 | 2.232 | 0.048 | 2.139 | 2.329 |
This table reports odds ratios (OR) of hospitalization or death by ED visit type, using a logistic model with a GEE approach. The odds ratios were adjusted for year, month, and for age, gender, SES, comorbidity, prior utilization (ED, office, hospital), having a regular PCP, drug cost-sharing level, ED cost-sharing level, and medical center.
Results
Table 1 displays the baseline subject characteristics and unadjusted annual ED visit rates.
Table 1.
Subject Characteristics, Copayment Levels, and Unadjusted ED Visit Rates
| Commercial Insurance | Medicare Insurance | |||
|---|---|---|---|---|
|
| ||||
| Total | n = 2,257,445 | (%) | n = 261,091 | (%) |
| Age: | ||||
| <15yrs | 480,188 | (21.3) | 26 | (0.0) |
| 15–17yrs | 111,607 | (4.9) | 0 | (0.0) |
| 18–29yrs | 375,413 | (16.6) | 298 | (0.1) |
| 30–39yrs | 394,481 | (17.5) | 1,309 | (0.5) |
| 40–49yrs | 413,975 | (18.3) | 2,646 | (1.0) |
| 50–64yrs | 433,680 | (19.2) | 9,924 | (3.8) |
| 65–74yrs | 36,106 | (1.6) | 142,447 | (54.6) |
| 75–84yrs | 10,022 | (0.4) | 85,074 | (32.6) |
| 85+yrs | 1,973 | (0.1) | 19,367 | (7.4) |
|
| ||||
| Female | 1,146,478 | (50.8) | 145,810 | (55.8) |
|
| ||||
| Low SES Neighborhood in 1999 | 508,861 | (22.5) | 49,251 | (18.9) |
|
| ||||
| Regular Primary Care Provider in 1999 | 1,600,968 | (70.9) | 245,550 | (94.0) |
|
| ||||
| Asthma in 1998 | 211,684 | (9.4) | 24,646 | (9.4) |
| Diabetes in 1998 | 69,065 | (3.1) | 35,750 | (13.7) |
| Heart Failure in 1998 | 6,936 | (0.3) | 14,380 | (5.5) |
| Coronary Artery Disease in 1998 | 25,194 | (1.1) | 36,600 | (14.0) |
| Hypertension in 1998 | 177,524 | (7.9) | 118,204 | (45.3) |
|
| ||||
| ED Visits in 1998: None | 1,947,136 | (86.3) | 194,327 | (74.4) |
| ED Visits in 1998: 1 Visit | 239,453 | (10.6) | 41,651 | (16.0) |
| ED Visits in 1998: 2+ Visits | 70,856 | (3.1) | 25,113 | (9.6) |
|
| ||||
| Office Visits in 1998: None | 555,516 | (24.6) | 22,146 | (8.5) |
| Office Visits in 1998: 1 Visit | 367,332 | (16.3) | 16,963 | (6.5) |
| Office Visits in 1998: 2 Visits | 298,834 | (13.2) | 19,818 | (7.6) |
| Office Visits in 1998: 3 Visits | 230,207 | (10.2) | 21,549 | (8.3) |
| Office Visits in 1998: 4 Visits | 173,761 | (7.7) | 20,887 | (8.0) |
| Office Visits in 1998: 5+ Visits | 631,795 | (28.0) | 159,728 | (61.2) |
|
| ||||
| Hospitalizations in 1998: None | 2,222,704 | (98.5) | 237,142 | (90.8) |
| Hospitalizations in 1998: 1+ | 34,741 | (1.5) | 23,949 | (9.2) |
|
| ||||
| ED Copayments in 1999: $0 | 528,954 | (23.4) | 65,129 | (24.9) |
| ED Copayments in 1999: $1–$15 | 1,300,038 | (57.6) | 184,705 | (70.7) |
| ED Copayments in 1999: $20–$100 | 428,453 | (19.0) | 11,257 | (4.3) |
| Drug Copayments in 1999: $0–$5 | 1,536,891 | (68.1) | 119,672 | (45.8) |
| Drug Copayments in 1999: $7–$15 | 556,085 | (24.6) | 130,166 | (49.9) |
| Drug Co-insurance in 1999 | 164,469 | (7.3) | 11,253 | (4.3) |
| Office Copayments in 1999: $0 | 529,380 | (23.5) | 65,129 | (24.9) |
| Office Copayments in 1999: $1–5 | 1,043,133 | (46.2) | 195,927 | (75.0) |
| Office Copayments in 1999: $10–15 | 682,616 | (30.2) | 33 | (0.0) |
| Office Copayments in 1999: $20–30 | 2,316 | (0.1) | 2 | (0.0) |
|
| ||||
| Visit Counts | Rate | Visit Counts | Rate | |
|
| ||||
| ED Visit Rate in 1999 | 414,647 | 19.6 | 134,569 | 53.0 |
| ED Visit Rate in 2000 | 338,381 | 18.2 | 120,979 | 51.4 |
| ED Visit Rate in 2001 | 297,898 | 17.4 | 115,353 | 52.4 |
This table reports the number and column percentages of subjects with each socio-demographic and clinical characteristic in the baseline year (1999), unless otherwise noted. We determined whether subjects lived in a Low SES Neighborhood, using 2000 US Census indicator for a neighborhood (census block) with low average educational attainment or household income. The subjects’ chronic disease status is based on chronic disease registry information from 1998. Under the drug co-insurance structure, patients pay 80–100% of their drug costs. ED Visit Rates reported as visits per 100 person-years; subjects can drop-out and rejoin the study as their membership status changes.
Severity of ED Visit Diagnoses
Figure 1 displays the distribution of 1,085,084 ED visits (94.3% of all ED visits) classified by the algorithm and Table 2 shows the most frequent ICD-9 codes in each category using the 50% probability threshold. Among commercially insured subjects (data not shown in figures/tables), 52.3% of ED visits were non-emergent; 36.2% were emergent; and 11.5% were intermediate –meaning that there was a 50% probability of being both non-emergent and emergent. Among Medicare subjects, 34.8% of ED visits were non-emergent; 51.6% were emergent; and 13.6% were intermediate.
Table 2.
Most Frequent ICD-9 Codes in Each Category (50% threshold)
| Non-Emergent (47.8% of all classified ED visits) | |
|---|---|
| ICD9 Code | Description |
| 789.00 | Abdominal pain, unspecified site |
| 784.0 | Headache |
| 786.52 | Painful respiration |
| 847.0 | Neck sprain or strain |
| 599.0 | Urinary tract infection, site not specified |
| Emergent (40.2% of all classified ED visits) | |
| 786.50 | Chest pain, unspecified |
| 879.8 | Multiple open wounds NOS |
| 493.90 | Asthma, unspecified |
| 780.2 | Syncope and collapse |
| 780.9 | Other general symptoms |
| Intermediate (Non-emergent = 50% and Emergent = 50%; 12.0% of all classified ED visits) | |
| 799.9 | Undiagnosed disease, not specified as to site or system involved |
| 496 | Other nonspecific abnormal findings |
| 883.0 | Open wound of fingers without complication |
| 919.6 | Superficial foreign body (splinter) of other multiple and unspecified sites without major open wound and without infection |
| 807.00 | Closed fracture of rib(s) unspecified |
Using the 75% probability threshold, the NYU algorithm categorized 48% of ED visits (51% of visits for commercially insured subjects, and 47% of visits for Medicare insured subjects), with the remaining 52% of visits falling into the intermediate category. At the 90% threshold, the algorithm categorized 27% of ED visits (31% of visits for commercially insured subjects, and 26% of Medicare insured subjects), with the remaining 73% of all ED visits falling into an intermediate category.
Among subjects with an ED visit, factors associated with having a non-emergent visit, i.e., Non-Emergency (NE) or Primary Care Treatable Emergencies (PCT), included female gender (among commercially insured subjects, OR=0.70, 95% CI:0.69–0.71; among Medicare subjects, OR=0.82, 95% CI:0.81–0.83) and low neighborhood SES (among commercially insured subjects only, OR=1.12, 95% CI:1.11–1.14).
Association between ED Visit Severity and Subsequent Hospitalizations or Death
Table 3 displays the association between ED visit severity and subsequent hospitalization(s) or death. Among commercially insured subjects and using the 50% probability threshold, ED visits categorized as emergent, i.e., Emergencies Not Preventable/Avoidable (ENPA) and Emergencies that are Preventable/Avoidable (EPA), were significantly more likely to result in a hospitalization on the day of ED visit (OR=3.37 for hospitalizations within one day, 95% CI: 3.31–3.44) or death within 30-days (OR=2.81, 95% CI: 2.62–3.00) than visits categorized as non-emergent, i.e., NE and PCT. Visits classified as intermediate also were significantly more likely than Non-Emergency visits, (but less likely than Emergency visits), to result in a hospitalization within one-day or death within 30-days, which is consistent with their definition as being equally likely of being non-emergent and emergent.
Similarly, among Medicare subjects, ED visits categorized as emergent, i.e., ENPA and EPA, were significantly more likely to result in a hospitalization within one-day (OR=3.50, 95% CI: 3.43–3.58) or death within 30-days (OR=2.23, 95% CI: 2.14–2.33) than visits categorized as non-emergent, i.e., NE and PCT.
In sensitivity analyses using all four NYU ED algorithm severity categories, the odds of death within 30-days (OR=0.87, 95% CI: 0.76–0.99) for commercial visits classified as PCT was not significantly greater than the odds for NE visits, however the odds of a hospitalization within one-day were greater (OR=1.87, 95% CI: 1.79–1.95). Among Medicare subjects, visits categorized as PCT also were slightly more likely than NE visits to result in a hospitalization within one-day (OR=1.25, 95% CI: 1.19–1.31), but the odds of death within 30-days was not significantly different between the two categories (OR=1.07, 95% CI: 0.98–1.17). In sensitivity analyses using 75% and 90% probability thresholds, we found similar results in both study populations.
Analyses using probability of visit severity as a continuous variable (the sum of the preventable and non-preventable Emergency categories) also yielded comparable results. Among both commercially and Medicare insured subjects, the odds of a hospitalization within one-day or death within 30-days heightened with a 10% increase in the high severity probability (OR=1.24, 95% CI: 1.23–1.24 and OR=1.22, 95% CI: 1.21–1.23, respectively among commercially insured subjects and OR=1.199, 95% CI: 1.196–1.203 and OR=1.16, 95% CI: 1.15–1.69, respectively among Medicare insured subjects).
Discussion
This study demonstrates that use of the NYU algorithm leads to a classification of individual ED visits that is associated with subsequent hospitalization and death.
To our knowledge, this is the first study to provide validation evidence for any ED classification algorithm with hospitalization and mortality outcome data. Moreover, this was done with a patient population in a different geographical and health care setting from that in which the algorithm was constructed. This result lends support to the use of the algorithm for studying the mix of severity in a group of ED visits. The algorithm could potentially be useful in an experimental or quasi-experimental study in which the each unit of study is a single ED or a group of EDs and the goal is to evaluate the use of different approach to decrease the use of the ED care for non-emergent conditions that could be better handled in other ways. Because it utilizes existing clinical data rather than time-intensive chart review, the NYU algorithm can be easily applied in different times and settings at relatively low cost. Researchers have the option to classify visits into two or four categories, or to use a continuous probability approach, depending on their aims and the characteristics of the population they are studying. For example, researchers who seek to maximize the number of classified ED visits can use the 50% threshold, while those searching for greater specificity (greater confidence in the severity of the diagnosis) can opt for the 75% or 90% threshold. Studies that are interested primarily in one severity category may choose a categorical analytic approach while those examining a skewed patient population (e.g., urban trauma center) may opt for a continuous approach.
This ED classification approach can serve to identify the percentage of a group of ED visits likely to be appropriate or inappropriate for the ED setting given the availability of other less resource intensive alternative settings, either within a health system or a municipality. Importantly, evaluations of ED care appropriateness need to consider not only the severity of a patient’s condition, but also access to alternative sources of care, including primary care; in situations when such alternatives are not readily available, the ED care could represent the only source of medical care. Thus, uses of this tool include evaluations of the progress of primary care programs, public education measures and other initiatives designed to address emergency department overcrowding and to encourage primary care, preventive care, and management of non-emergent medical conditions. In addition to our findings about validity, our results support the contention that ED overuse for non-urgent conditions is a problem across socio-economic status and insurance type, rather than one confined to the uninsured population [14].
Limitations
The approach described in this manuscript using diagnoses to classify individual visits has inherent limitations. Each diagnosis code includes conditions with varying severity, and diagnoses made in the ED could have a high level of clinical uncertainty, e.g., not all patients with chest pain in the ED have an acute coronary syndrome. Some of the visits classified as low severity will be for true emergencies, and could be associated with subsequent worsening of health; conversely, some of the visits that are classified as high severity will be for marginal or self-limiting cases. Consistent with the view of the developers, the NYU ED visit classifier would not seem appropriate for clinical decision making at the individual level. Nevertheless, we found a strong association between visits classified as high and low severity and subsequent need for hospitalization or death. Other possible limitations include the fact that we did not study morbidities other than hospitalization or resource utilization. Some ED visits, such as those for lacerations with the potential for permanent disfigurement, are “appropriate” despite not having high mortality or hospitalization rates. While our IDS is made up of a heterogeneous population that closely approximates the socioeconomic demographics of the service area, further study will be needed to extend the validity of our results to other populations. For example, we did not study the small Medicaid subset of our patient population, and these patients generally are of a lower socioeconomic status and may have fewer health care options available to them. Finally, our validation study population had ED visits between 1999 and 2001. Various changes in the delivery system since then, (e.g., physician coding patterns, increased ED co-payments, and patient access to secure email with PCPs), may have altered the severity make-up of ED visits.
Because diagnosis codes and physician coding patterns are likely to change over time, our study’s results will likely need to be replicated in the future to confirm the continued validity of this association. Given its reliance on probability sums, the NYU algorithm, as its Website acknowledges, is not appropriate as a means of determining levels of visit reimbursement [22]. Previous studies have demonstrated that ED triage tools for referring away non-emergent patients have not achieved adequate inter-rater reliability or safety scores [29–32]. The NYU algorithm, while not appropriate for use as a triage tool, partly because it is based on end-of-visit diagnosis codes, may assist in the modification of existing tools or in the development of new ones. This is one of many areas of potential practical application of the algorithm.
Conclusions
In conclusion, this study provides validation evidence for an approach to classifying Emergency Department visit severity. We found that the NYU algorithm-based classification approach was able to differentiate between individual ED visits that were and were not likely to result in a hospitalization or death. Our findings affirm the usefulness of the algorithm in studies requiring methods to classify the appropriateness of a group of visits to the emergency department, compared to less intensive venues. In particular, this classification algorithm will be a useful tool in studying emergency room visit patterns and can contribute to evidence-based programs and policies that reduce use of the ED for non-emergencies.
References
- 1.Institute of Medicine. Hospital-Based Emergency Care: At the Breaking Point. Washington, DC: National Academy Press; 2006. [Google Scholar]
- 2.Clancy CM. Emergency departments in crisis: opportunities for research. Health Serv Res. 2007;42:xiii–xx. doi: 10.1111/j.1475-6773.2006.00692.x. [DOI] [PMC free article] [PubMed] [Google Scholar]
- 3.Institute of Medicine. A shared destiny: Community effects of uninsurance. Washington: National Academies Press; 2003. [PubMed] [Google Scholar]
- 4.Rotarius T, Trujillo A, Unruh L, et al. Uncompensated care and emergency department utilization: a local study having national implications. Health Care Manag (Frederick) 2002 Sep;21(1):1–38. doi: 10.1097/00126450-200209000-00002. [DOI] [PubMed] [Google Scholar]
- 5.Derlet RW, Richards JR. Overcrowding in the nation’s emergency departments: complex causes and disturbing effects. Ann Emerg Med. 2000 Jan;35(1):63–8. doi: 10.1016/s0196-0644(00)70105-3. [DOI] [PubMed] [Google Scholar]
- 6.Buechner JS, Williams KA. Classification of emergency department visits: how many are necessary? Med Health RI. 2007 Mar;90(3):96–7. [PubMed] [Google Scholar]
- 7.Utah Office of Health Care Statistics. Primary care sensitive emergency ED visits in Utah, 2001. Salt Lake City, UT: Utah Department of Health; 2004. [Accessed October 7th, 2008]. http://health.utah.gov/hda/Reports/Primary_care_ERvisits_Utah2001.pdf. [Google Scholar]
- 8.Cunningham P, May J. Insured Americans drive surge in emergency department visits. Issue Brief Cent Stud Health Syst Change. 2003 Oct;(70):1–6. [PubMed] [Google Scholar]
- 9.Guttman N, Zimmerman DR, Nelson MS. The many faces of access: reasons for medically nonurgent emergency department visits. J Health Polit Policy Law. 2003 Dec;28(6):1089–120. doi: 10.1215/03616878-28-6-1089. [DOI] [PubMed] [Google Scholar]
- 10.Hunt KA, Weber EJ, Showstack JA, et al. Characteristics of frequent users of emergency departments. Ann Emerg Med. 2006 Jul;48(1):1–8. doi: 10.1016/j.annemergmed.2005.12.030. Epub 2006 Mar 30. [DOI] [PubMed] [Google Scholar]
- 11.Li G, Lau JT, McCarthy ML, et al. Emergency department utilization in the United States and Ontario, Canada. Acad Emerg Med. 2007 Jun;14(6):582–4. doi: 10.1197/j.aem.2007.02.030. Epub 2007 Apr 30. [DOI] [PubMed] [Google Scholar]
- 12.Lucas RH, Sanford SM. An analysis of frequent users of emergency care at an urban university hospital. Ann Emerg Med. 1998 Nov;32(5):563–68. doi: 10.1016/s0196-0644(98)70033-2. [DOI] [PubMed] [Google Scholar]
- 13.Redstone P, Vancura JL, Barry D, et al. Nonurgent use of the emergency department. J Ambul Care Manage. 2008 Oct-Dec;31(4):370–76. doi: 10.1097/01.JAC.0000336555.54460.fe. [DOI] [PubMed] [Google Scholar]
- 14.Meisel ZF, Pines JM. [Accessed Sept 17, 2008];The allure of the one-stop shop; the real reasons why people go to the ER when they shouldn’t. 2008 Sep 12; www.slate.com.
- 15.Ragin DF, Hwang U, Cydulka RK, et al. Emergency Medicine Patients’ Access To Healthcare (EMPATH) Study Investigators. Reasons for using the emergency department: results of the EMPATH Study. Acad Emerg Med. 2005;12(12):1158. doi: 10.1197/j.aem.2005.06.030. [DOI] [PubMed] [Google Scholar]
- 16.Washington Dl, Stevens CD, Shekelle PG, et al. Next-day care for emergency department users with nonacute conditions. A randomized, controlled trial. Ann Intern Med. 2002 Nov 5;137(9):707–14. doi: 10.7326/0003-4819-137-9-200211050-00005. [DOI] [PubMed] [Google Scholar]
- 17.O’Grady KF, Manning WG, Newhouse JP, et al. The impact of cost-sharing on emergency department use. New England Journal of Medicine. 1985;313:484–490. doi: 10.1056/NEJM198508223130806. [DOI] [PubMed] [Google Scholar]
- 18.Newhouse JP The Insurance Experiment Group. Free for All? Lessons from the RAND Health Insurance Experiment. Cambridge, MA: Harvard University Press; 1993. [Google Scholar]
- 19.Selby JV, Fireman BH, Lundstrom BE, et al. Effect of a copayment on use of the emergency department in a health maintenance organization. New England Journal of Medicine. 1996;334:635–641. doi: 10.1056/NEJM199603073341006. [DOI] [PubMed] [Google Scholar]
- 20.Billings J, Parikh N, Mijanovish T. Issue Brief. The Commonwealth Fund; Nov, 2000. Emergency department use in New York City: A substitute for primary care? pp. 1–5. [PubMed] [Google Scholar]
- 21.Billings J, Parikh N, Mijanovish T. Emergency department use: New York City. The Commonwealth Fund; Oct, 2000. [PubMed] [Google Scholar]
- 22.The Center for Health and Public Service Research. [Accessed Sept 17, 2008]; website. http://wagner.nyu.edu/chpsr/index.html?p=25.
- 23.Burt CW, Arispe IE. Characteristics of emergency departments serving high volumes of safety-net patients: United States, 2000. Vital Health Stat. 2004 May;13(155):1–16. [PubMed] [Google Scholar]
- 24.Begley CE, Vojvodic RW, Seo M, Burau K. Emergency room use and access to primary care: evidence from Houston, Texas. J Health Care Poor Underserved. 2006 Aug;17(3):610–24. doi: 10.1353/hpu.2006.0098. [DOI] [PubMed] [Google Scholar]
- 25.Selby JV, Zhang D. Risk factors for lower extremity amputation in persons with diabetes. Diabetes Care. 1995;18:509–516. doi: 10.2337/diacare.18.4.509. [DOI] [PubMed] [Google Scholar]
- 26.Selby JV, Fireman BH, Lundstrom RJ, et al. Variation among hospitals in coronary angiography practices and outcomes after myocardial infarction in a large health maintenance organization. New England Journal of Medicine. 1996;335:1888–1896. doi: 10.1056/NEJM199612193352506. [DOI] [PubMed] [Google Scholar]
- 27.Krieger N. Use of census-based aggregate variables to proxy for socioeconomic group: evidence from national samples. Am J Epidemiol. 1999;150:892–896. doi: 10.1093/oxfordjournals.aje.a010095. [DOI] [PubMed] [Google Scholar]
- 28.Ash AS, Ellis RP, Pope GC, et al. Using diagnoses to describe populations and predict costs. Health Care Financing Review. 2000;21:7–28. [PMC free article] [PubMed] [Google Scholar]
- 29.Lowe RA, Bindman AB, Ulrich SK, et al. Refusing care to emergency department of patients: evaluation of published triage guidelines. Ann Emerg Med. 1994 Feb;23(2):286–93. doi: 10.1016/s0196-0644(94)70042-7. [DOI] [PubMed] [Google Scholar]
- 30.O’Brien GM, Shapiro MJ, Woolard RW, et al. “Inappropriate” emergency department use: a comparison of three methodologies for identification. Acad Emerg Med. 1996 Mar;3(3):252–7. doi: 10.1111/j.1553-2712.1996.tb03429.x. [DOI] [PubMed] [Google Scholar]
- 31.O’Brien GM, Shapiro MJ, Fagan MJ, et al. Do internists and emergency physicians agree on the appropriateness of emergency department visits? J Gen Intern Med. 1997 Mar;12(3):188–91. doi: 10.1007/s11606-006-5028-2. [DOI] [PMC free article] [PubMed] [Google Scholar]
- 32.Asaro PV, Lewis LM. Effects of a triage process conversion on the triage of high-risk presentations. Acad Emerg Med. 2008 Oct;15(10):916–22. doi: 10.1111/j.1553-2712.2008.00236.x. [DOI] [PubMed] [Google Scholar]