

Abstract
Fungal infections pose unique challenges to molecular diagnostics; fungal molecular diagnostics consequently lags behind bacterial and viral counterparts. Nevertheless, fungal infections are often life-threatening, and early detection and identification of species is crucial to successful intervention. A high throughput PCR-based method is needed that is independent of culture, is sensitive to the level of one fungal cell per milliliter of blood or other tissue types, and is capable of detecting species and resistance mutations. We introduce the use of high resolution melt analysis, in combination with more sensitive, inclusive, and appropriately positioned panfungal primers, to address these needs. PCR-based amplification of the variable internal transcribed regions of the rDNA genes generates an amplicon whose sequence melts with a shape that is characteristic and therefore diagnostic of the species. Simple analysis of the differences between test and reference melt curves generates a single number that calls the species. Early indications suggest that high resolution melt analysis can distinguish all eight major species of Candida of clinical significance without interference from excess human DNA. Candida species, including mixed and novel species, can be identified directly in vaginal samples. This tool can potentially detect, count, and identify fungi in hundreds of samples per day without further manipulation, costs, or delays, offering a major step forward in fungal molecular diagnostics.
Rapid and economical detection, identification, and quantification of fungal species directly from clinical samples is a long-sought goal of clinicians that has still not been fulfilled.1,2,3,4,5,6 Culture-based diagnosis of fungal infections is inadequate in that many species do not culture efficiently or require unacceptably long incubations.7 Antigen-based tests for galactomannan or β-glucan are improvements over culture, but are either too specific, too insensitive, plagued by false positives, or not yet validated by widespread testing.8,9,10,11,12,13 Identification of C. albicans and C. glabrata by Peptide nucleic acid-fluorescence in situ hybridization (PNA-FISH) is in clinical use. However, this tool requires an initial culture step to increase fungal titer to detectable levels and is limited in the number of species it can identify.14,15,16,17
PCR-based strategies are the most likely solutions to challenges posed by fungal diagnostics. However, clinical diagnosis of fungal infections by PCR is perhaps its most challenging application, due to low cell numbers, potentially <1 cell/ml sample, to the added problems in lysing fungal walls, and to the similarity in rDNA sequences to human. It is clear that PCR is sufficiently sensitive and specific by in vitro testing, but sample processing under these extreme demands remains problematic. Reviews from 2002 to 2008 indicate that both the promise and problems are great.6,8,18,19 Most approaches detect positives in clinical samples at their limits of detection, meaning they lack the level of robustness needed to avoid false negatives when widely applied.1,20
PCR strategies using panfungal primers that complement conserved regions of rDNA but span the variable internal transcribed spacer regions (ITS1 and ITS2) have the strong advantage that any and all fungal species will be captured in a single reaction.21,22,23,24,25,26,27,28,29,30,31,32,33,34,35,36,37,38,39,40,41,42,43,44,45,46,47 Traditionally, these amplicons are then sequenced to identify species, using standard, automated capillary sequencing, pyrosequencing, or sequencing-grade microarrays.27, 29, 32,33,34,35, 37, 44, 47,48,49,50 Alternatively, precise determination of the base composition of the amplicons by electrospray mass spectroscopy may identify species.51 Less precise but adequate resolution may be achieved by restriction enzyme analysis of the amplicon.24,30 Repetitive sequence-PCR (REP-PCR), a version of randomly amplified polymorphic DNA (RAPD) in which primers target repetitive sequence elements, have been used for fungal identification.52,53 However, this requires pure cultures as the starting material, which is useful in some applications but is not an acceptable precondition for a clinical fungal diagnostic tool. An alternative is to identify species with probes, either standard hybridization after PCR, or during amplification using Taqman, Beacon, or Scorpion probes,22,25,28,38,41,45 or hybridization-based fluorescence resonance energy transfer (FRET) probes.54
An alternative is the use of species-specific PCR, which is typically more sensitive and does not require sequencing of product. Species that are certain to be seen with reasonable frequencies can be detected by species-specific PCR. Approximately 80% of these are species of Candida (C. albicans, C. glabrata, C. tropicalis, C. parapsilosis, C. krusei, and C. lusitaniae), or Aspergillus (A. fumigatus, A. flavus, A. terreus, A. niger). The remaining ∼20% include Fusarium, Sporothrix schenckii, zygomycetes (Absidia corymbifera, Rhizomucor pusillus, Rhizopus arrhizus, Mucor, and Cunninghamella). Some of the less common species are also the most problematic in terms of resistance or virulence. There are a number of publications reporting a variety of primers for this approach, with widely varying levels of rigor in their validation.55,56,57,58,59,60,61,62 In general, this approach has the disadvantage that multiple assays have to be run on each sample, adding cost and labor. Multiplexing is a possible alternative, but this is widely associated with reduced sensitivity. A further limitation is that many clinical samples will have novel species that may be missed by these primers.
High resolution melt analysis is likely to provide an even simpler, faster, and cheaper identification tool sufficiently specific for fungal speciation. This approach more fully exploits the shape of the melting curve of an amplicon, which is a much richer source of information than melting temperature alone. Short, regional sequences denature to form single stranded regions, which release double-stranded DNA-binding fluorescent dyes, before reaching the temperature at which the entire amplicon denatures. This influences the shape of the melt curve, to generate nuances that reflect species-specific sequence differences. Resolution can be further enhanced or normalized by several methods.63,64 This has enabled identification of bacterial and viral species.65
Our application of this tool to species of Candida shows that the separation between species is great enough to call species without any postamplification handling.
Materials and Methods
Fungal Isolates
Candida isolates were either ATCC isolates, or were clinical isolates (Table 1), and were identified to species by Chromagar Candida colony phenotype (BD; Becton, Dickinson Co., Franklin Lakes, NJ), API20C testing (bioMerieux Vitek, Hazelwood, NJ), RAPD fingerprinting, and sequencing of rDNA ITS1 and/or ITS2 amplicons (listed in Table 1). Isolates were maintained at −70 C in 1mol/L sorbitol and propagated on yeast extract-proteose peptone-dextrose agar (Difco Laboratories, Inc., Detroit, MI). Vaginal samples were lavages, obtained from symptomatic culture-positive patients, with patient consent and Institutional Review Board approval, at the Wayne State University Vaginitis Clinic at the Detroit Medical Center, Detroit, MI.
Table 1.
Identification of Candida Isolates by Σ|ΔdMelt| Analysis
| Reference species |
||||||||
|---|---|---|---|---|---|---|---|---|
| Test isolates | Ca | Cp | Cl | Cd | Ck | Cgu | Ct | Cg |
| C. albicans | ||||||||
| Sc5314 | 61 | 326 | 227 | 216 | 397 | 365 | 239 | 199 |
| Ca2 | 52 | 301 | 288 | 168 | 423 | 349 | 212 | 208 |
| Ca5 | 33 | 292 | 266 | 167 | 412 | 335 | 201 | 188 |
| Ca28815 | 49 | 340 | 262 | 225 | 405 | 376 | 255 | 223 |
| C. parapsilosis | ||||||||
| Cp2 | 314 | 27 | 372 | 173 | 430 | 88 | 111 | 213 |
| Cp3 | 317 | 20 | 370 | 179 | 430 | 87 | 120 | 214 |
| Cp4 | 323 | 25 | 374 | 187 | 434 | 82 | 124 | 218 |
| Cp5 | 314 | 50 | 359 | 191 | 421 | 77 | 117 | 209 |
| C. lusitaniae | ||||||||
| Cl2 | 301 | 392 | 60 | 351 | 367 | 418 | 339 | 230 |
| Cl3 | 254 | 365 | 35 | 313 | 368 | 395 | 306 | 203 |
| Cl5 | 234 | 345 | 40 | 292 | 360 | 375 | 285 | 186 |
| Cl6 | 260 | 355 | 39 | 310 | 358 | 384 | 300 | 197 |
| C. dubliniensis | ||||||||
| Cd5 | 184 | 212 | 341 | 71 | 425 | 266 | 158 | 203 |
| Cd6 | 207 | 190 | 348 | 56 | 437 | 248 | 144 | 203 |
| Cd7 | 242 | 181 | 234 | 175 | 349 | 217 | 120 | 84 |
| Cd8 | 228 | 198 | 376 | 90 | 445 | 253 | 167 | 229 |
| C. krusei | ||||||||
| Ck4 | 420 | 436 | 368 | 415 | 63 | 449 | 391 | 310 |
| Ck6 | 394 | 418 | 351 | 392 | 33 | 432 | 370 | 289 |
| Ck7 | 403 | 429 | 356 | 402 | 36 | 443 | 382 | 295 |
| Ck9 | 416 | 429 | 368 | 413 | 32 | 442 | 385 | 304 |
| C. guilliermondii | ||||||||
| Cgu2 | 389 | 152 | 403 | 280 | 422 | 80 | 198 | 261 |
| Cgu6 | 368 | 120 | 396 | 256 | 443 | 49 | 173 | 252 |
| Cgu7 | 369 | 120 | 395 | 256 | 443 | 48 | 173 | 251 |
| Cgu8 | 375 | 119 | 412 | 254 | 464 | 49 | 177 | 263 |
| C. tropicalis | ||||||||
| Ct2 | 189 | 132 | 297 | 101 | 381 | 178 | 42 | 128 |
| Ct3 | 227 | 105 | 308 | 124 | 372 | 145 | 26 | 139 |
| Ct4 | 240 | 93 | 312 | 136 | 384 | 133 | 35 | 150 |
| Ct1 | 214 | 114 | 313 | 114 | 381 | 157 | 29 | 144 |
| C. glabrata | ||||||||
| Cg1 | 209 | 205 | 204 | 174 | 287 | 231 | 147 | 45 |
| Cg2 | 202 | 200 | 197 | 159 | 297 | 231 | 138 | 38 |
| Cg4 | 206 | 203 | 212 | 155 | 318 | 239 | 133 | 46 |
| Cg8 | 209 | 216 | 207 | 171 | 320 | 249 | 150 | 41 |
dMelt curves are first derivatives of raw melt curve data. dMelt curves for each species (determined by averaging dMelt curves from triplicate assays of 4 to 10 isolates per species) was subtracted from dMelt curves of individual test isolates as shown in Figure 3. The sum of absolute differences along these curves from zero is reported here. Numbers in bold italics indicate cases in which the isolates are compared with same reference species; these are the lowest scores across each horizontal line of comparison, allowing identification of the test isolate, except for Cd7 (underlined, see text). dMelt curves of individual isolates used here were averaged from triplicate reactions, but the same identifications were possible using each curve separately, as predicted from Figure 2. Species abbreviations across the top correspond to full names in column one. All isolates except SC5314 and Ca28815 are clinical samples.
DNA Isolation
Total DNA was extracted from pure cultures of each species using a zymolyase-SDS-phenol extraction protocol.66 Amounts of DNA recovered were determined by fluorescence assay in 96-well plates (Quant-iT dsDNA HS Assay kit; Invitrogen Corp., Carlsbad, CA). DNA was also recovered by direct lysis of colonies using Quick Extract Plant DNA Extraction Solution (Epicenter Biotechnologies Madison, WI) optimized with the following modifications: Proteinase K (1 μl of 50 μg/μl) was added to 100 μl Quick Extract Plant DNA Extraction solution with sample, then incubated at 65°C for 30 minutes followed by 98°C for 15 minutes. DNA from vaginal samples was recovered following the same protocol, after the following sample processing: 1 ml of SDS buffer (10 mmol/L Tris, pH 7.6; 10 mmol/L EDTA, pH 8.0;10 mmol/L NaCl; 50 mmol/L SDS; 0.2% Proteinase K, 200 μg/ml) was added to 1 ml of lavage and incubated at 65°C for 30 minutes. The lavage was then centrifuged at 18,000 × g for 10 minutes. The pellet was resuspended in 1.5 ml Tris-EDTA (10 mmol/L Tris, pH 7.6; 1 mmol/L EDTA, pH 8.0), centrifuged again, followed by another repeat wash. DNA was prepared from the final pellet using the Quick Extract Plant DNA Extraction protocol, and was diluted 100-fold in Tris-EDTA buffer for use in PCR reactions. Mock samples were processed alongside vaginal samples as negative controls.
qPCR
Several panfungal primers targeting the internal transcribed spacers (ITS1, ITS2) rDNA domain were designed and tested in silico and at the bench, to ensure that all available species of Candida and other fungi were amplified and detectable down to the equivalent of less than one cell per reaction (fungal species typically have >50 copies of rDNA genes per genome). One primer set, forward primers Fungal-7a (5′-GTCGTGCTGGGGATARAGCAT-3′), Fungal-7b (5′-GTCGTGCTGGGGATAGARCAT-3′), and reverse primer RT1 (5′-GATATGCTTAAGTTCAGCGGGT-3′), spanned both ITS1 and ITS2, amplified all tested fungal species without interference from human DNA, and generated an amplicon with the greatest capacity for species identification. Its amplification program, 95°C (5 minutes); 95°C (30 s), 60°C (30 s), 72°C (60 s) × 45 cycles, was optimized in a Smartcycler thermocycler (Cepheid, Sunnyvale, CA) and later adapted to the Lightcycler 480 (Roche) in experiments. Experiments for HRM were typically performed using High Resolution Master Mix 480 (Roche Diagnostics Corp., Indianapolis, IN), which has a double-stranded DNA binding fluorophore that is present at saturating levels; however, comparable results were obtained using a standard TaqDNA polymerase and buffer (Gene Choice) with 0.073× Sybr Green (Invitrogen, from supplied 10,000× stock, diluted with dimethyl sulfoxide to 7.3× for storage). Vaginal samples and controls were analyzed using primers FL79 (5′-GTGAATCATCGARTCTTTGAACG-3′) and RT1, using the optimized program 95°C (5 minutes); 95°C (30 s), 50°C (30 s), 72°C (30 s) × 40 cycles. This alternative primer pair amplifies ITS2, not ITS1.
DNA Sequencing and Analysis
Amplicons were verified by agarose gel electrophoresis and were enzymatically cleaned using a 5 μl solution of 0.1 units of NTPhos thermolabile phosphatase and 1 unit of Exonuclease I (Epicenter Biotechnologies), in 20 mmol/L Tris pH 8.3, 50 mmol/L KCl, and 10 mmol/L MgCl2 (1× PCR reaction buffer, Invitrogen Corporation), 37°C for 15 minutes, then inactivated by 80°C for 15 minutes. These were then sequenced (Functional Biosciences, Inc., Madison WI) from both ends using flanking vector primers. Sequences representing vector or low quality base calls were removed, and discrepancies between strands were resolved by visual inspections of chromatograms. Sequences were identified to species by nucleotide BLAST on the NCBI website (http://blast.ncbi.nlm.nih.gov/Blast.cgi; accessed 07/22/08). Sequences within a species were aligned (ClustalW) with relaxed gap penalties, followed by manual adjustments. Aligned sequences were compared with generate base substitution matrices and bootstrapped phylogenetic trees (Mega4 software).
Results
In silico Potential of the ITS1-ITS2 Amplicon for HRM-Based Identification of Fungal Species
Since HRM analysis relies on subtle differences in the shape of melt curves of amplicons, it was important to ascertain in advance whether the ITS1-ITS2 domain has sufficient diversity among clinically important fungal species to allow their discrimination by HRM analysis. Therefore, we aligned this region from ∼100 fungal pathogens for which sequence data were available. Figure 167,68,69,70 shows that almost all interspecies variations are very high. The average difference between species was ∼25 base changes per hundred, ranging from 2 to 48. By comparison, there are ∼17 base changes per hundred in the comparable regions of man versus chimpanzee, ∼28 base changes per hundred between man and mouse. Comparing even similar species, eg, C. albicans versus C. dubliniensis and A. terreus versus A. niger, there are ∼2 to 3 base changes per hundred, or ∼16 to 24 differences per ∼800 bp amplicon. In contrast, there are only small variations within fungal species. These data suggest that HRM analysis of the ITS1-2 domain has the potential to allow identification of most or all medically important fungal species. Exceptions to this may include closely related species of Mucor and Rhizopus. Furthermore, it suggests that successful resolution of the closely related species of Candida should extrapolate to the more diverse species of molds. Therefore, HRM analyses of the Candida species is a good initial challenge to test whether the tool is feasible.
Figure 1.
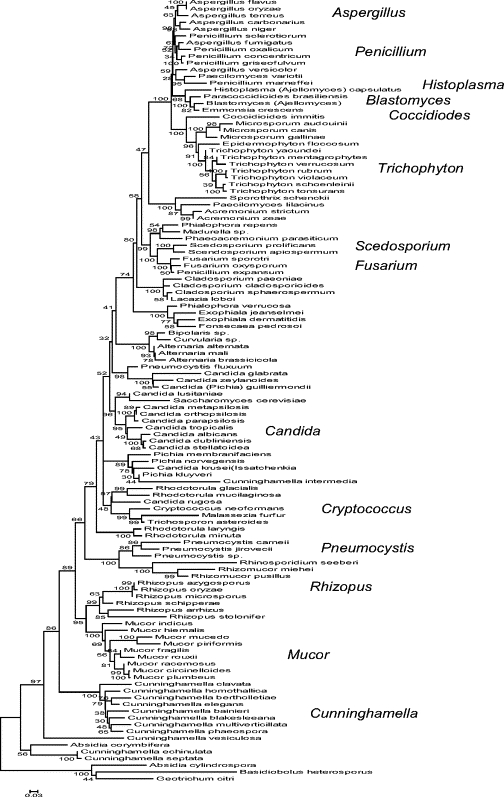
Evolutionary relationships of rDNA ITS1-ITS2 sequences of fungal pathogenic species. Representative sequences for each species were taken from the NCBI database or derived from isolates in this study. Sequences were aligned and trimmed to common ends defined by the panfungal primer binding sites, using MEGA4.67 Their evolutionary history was inferred using the Neighbor-Joining method68; largely similar trees were derived using other available phylogenetic tools. The bootstrap consensus tree inferred from 500 replicates is taken to represent the evolutionary history of the taxa analyzed. The percentage of replicate trees in which the associated taxa clustered together in the bootstrap test (500 replicates) are shown next to the branches.69 The tree is drawn to scale, with branch lengths in the same units as those of the evolutionary distances used to infer the phylogenetic tree. The evolutionary distances were computed using the Maximum Composite Likelihood method70 and are in the units of the number of base substitutions per site. All positions containing alignment gaps and missing data were eliminated only in pairwise sequence comparisons (Pairwise deletion option). There were a total of 1359 positions in the final dataset. Phylogenetic analyses were conducted in MEGA4. Human and a few fungal plant pathogens are included. Note that some species are outliers relative to the position they should hold in the tree (eg, Penicillium expansum); these may reflect misidentifications or errors in sequencing and indicate that multiple independent reads per species should be used.
HRM Profiles of Major Species of Candida
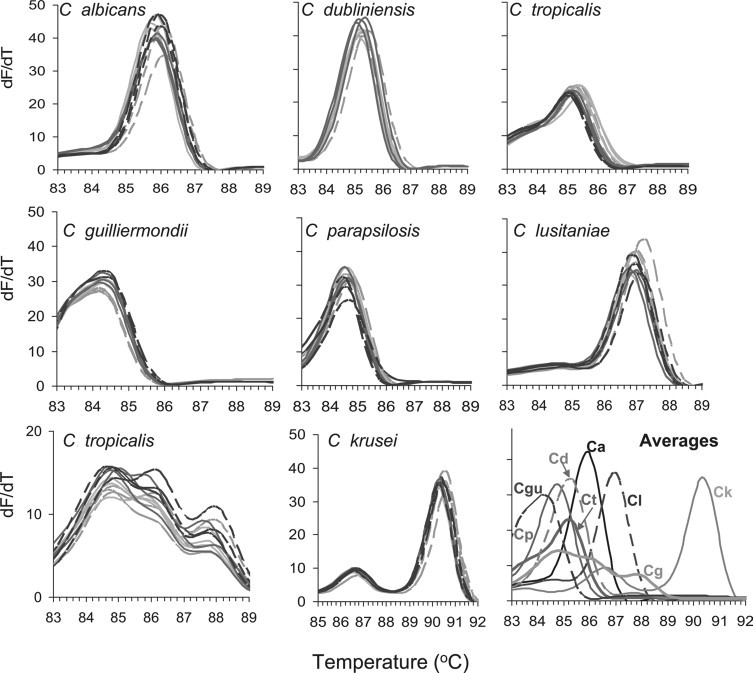
ITS1-2 amplicons generated from triplicate reactions of four independent isolates each of eight species of Candida were subject to HRM analysis. Isolates within each species generated a first derivative melt curve (dMelt; Figure 2) that was characteristic of its species. This indicated that these curve shapes could be used to identify these species. We found that dMelt curves were a more reliable marker for the species than normalized raw melt curves, probably since they report the shapes of the melt curves and are less sensitive to variations in sample composition and initial template concentration.
Figure 2.
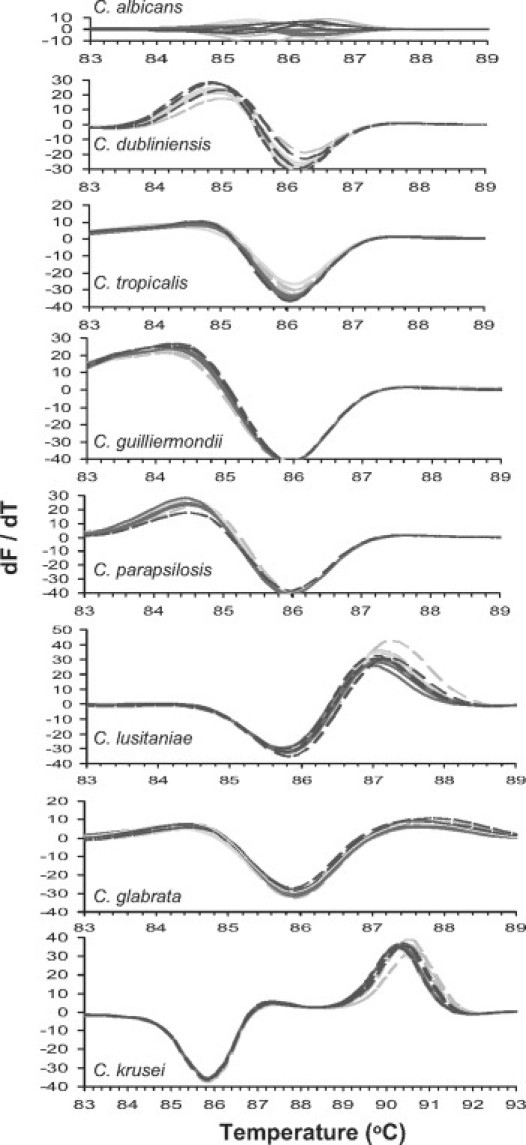
First derivative ITS1-2 melt curves (dMelt) of Candida species. Genomic DNA (∼1 ng) of four independent isolates of each species was amplified in triplicate, and analyzed using the melting temperature calling algorithm of the Lightcycler 480. First derivative curves were derived from non-normalized melt curves. Each of the triplicate curves is shown individually to convey their reproducibility. An average normalized melt curve was calculated from up to 10 independent isolates of each species.
Identification of Species by Analysis of Difference dMelt (ΔdMelt) Curves
Because normalized and dMelt curves are immediately available after amplification, high throughput identification without further intervention is possible. To make the analysis of these data equally high throughput, we developed an algorithm within Microsoft Excel that generates a single number that defines each species of Candida. This allows identification of up to 96 samples simultaneously. This number is generated from difference curves as shown in Figure 3. Values along the x axis of the dMelt curve of the reference species (C. albicans) is subtracted from the corresponding values of each individual sample dMelt curve. When the two curves were derived from the same species, the difference curve (ΔdMelt) hovers around 0, varying within 10 units. However, when the test curve was derived from a species other than the reference curve, the ΔdMelt curve fluctuates much more dramatically, and in a manner that is characteristic of the species. We show as examples, difference curves of four independent isolates of each species, in triplicate. In the top panel, in which test isolates are the same species as the reference, differences deviated very little from zero along their entire length. In contrast, subtraction of reference species from dMelt curves of isolates belonging to any other species resulted in much larger deviations, in the lower panels.
Figure 3.
ΔdMelt analysis of ITS1-2 domains of Candida species. Average dMelt curves for C. albicans were determined by averaging dMelt curves of triplicate reactions of 10 independent isolates. These reference curves were subtracted from dMelt curves of four test isolates of each Candida species, performed in triplicate to generate the two sets of difference curves.
ΔdMelt curves using any single reference species are characteristic of the test species (Figure 3), but because some (eg, C. parapsilosis and C. guilliermondii) have overall similarity, we conclude that the most unambiguous identification algorithm would be to subtract each reference species from each test isolate, and identify the species by the reference comparison that remained close to zero along the x axis. Rather than using a cumbersome visual inspection of 96 × 8 difference curves per multiwell plate, we simply added the absolute values of each difference curve along the x axis, a task that is easily templated in Excel. This calculation, Σ|ΔdMelt|, generates unambiguous species calls (Table 1).
Reading along the rows of Table 1 shows that 31 of the 32 test isolates gave lowest Σ|ΔdMelt| scores for the correct species. If these were unknowns, they would have been unambiguously assigned to the correct species. Even in comparisons of more closely related species, there is an exact identification. The single exception among 32 test isolates, Cd7, had been misidentified by its API20C profile. This isolate, initially identified as C. dubliniensis, was shown by sequence analysis to be C. glabrata, and therefore was correctly identified by HRM analysis.
If HRM analysis generates melt curves that are reproducible over time, a database of reference species could be generated, stored and used in the Σ|Δ%ddMelt| calculations, without having to rerun as standards each time. To test this, we challenged the database of dMelt curves generated in Table 1, with 75 repeat runs of 7 species of Candida, performed on up to 3 different days spanning three months relative to the initial assay. The resulting Σ|Δ%ddMelt| calculations for all 75 reactions correctly identified the test species (data not shown). This suggests that a small and growing database of reference species of clinical importance could be established for most or all fungal species, and is an initial level of validation of the assay as a reliable indicator of species.
Modified Calculation, Σ|Δ%ddMelt|, to Identify Species from Samples with Low Initial Template Concentrations and with an Excess of Human DNA
Samples in which initial template concentrations are near single molecule, ΔdMelt curves tend to change shape just below the melting temperature of the amplicon. These curves are still visually recognizable as the correct species, but for four of the eight species, their Σ|ΔdMelt| scores become ambiguous. The scores were not improved by taking derivatives of normalized melt curves. Furthermore, there is the potential that human DNA in clinical samples might alter the shape of the melt curve, resulting in ambiguity. We tested these issues by performing HRM analysis on serially diluted template of several Candida species, all containing 10 ng human DNA. We found that curve shapes throughout the dilution series could be normalized by taking the second derivative of raw melt curves, normalizing these by setting all values to a percentage of the maximum value on each curve, and finally subtracting reference species curves from test isolate curves. Representative Δ%ddMelt curves (Figure 4A) show that all dilutions down to femtogram levels of template virtually superimpose on curves from reactions starting at high template concentrations, and are species-specific. Summation of absolute values of deviations from these difference curves from each reference curve (highest initial template) generates unambiguous species calls for all eight species at dilutions down to the limit of detection. Human DNA in the reactions did not lower the sensitivity of the assay nor did it prevent species recognition. These data also indicate the reactions are quantitative, showing a linear relationship between Ct and input template concentration over five orders of magnitude, down to the equivalent of less than one cell per reaction (Figure 4B).71
Figure 4.
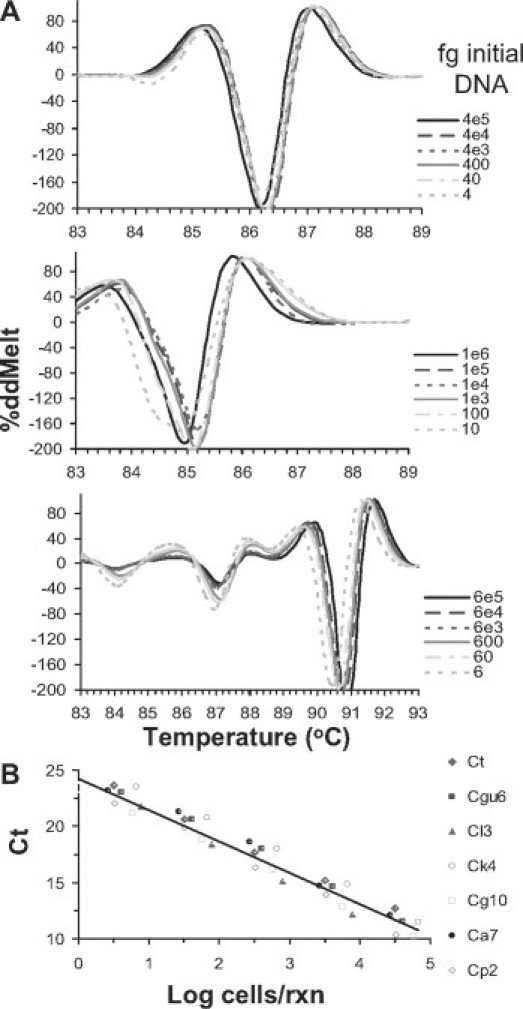
%ddMelt analysis and quantification of serially diluted Candida genomic DNA (gDNA). Genomic DNA of each species C. albicans (top), C. parapsilosis (middle), C. krusei (bottom) was serially diluted and amplified to obtain ITS1-2 amplicons, in the presence of an excess (10 ng) human DNA. A: Second derivatives of each melt curve were determined, and set on a percentage scale, setting the maximum positive value at 100%. B: Quantification of Candida species. Ct values are proportional to initial template concentrations over five orders of magnitude, and report an amplification efficiency of ∼2.1, slightly higher than 2, due to progressively increasing but small contribution of non-templated product as initial template concentration decreases. The linear regression plot includes data from seven species with a correlation coefficient of −0.95. Data are reported as cell equivalents per reaction, assuming the diploid C. albicans genome is ∼30 Mb, which ≅ 40 fg and has 110 copies of the rDNA genes,71 template concentration was determined with the fluorescence Quant-it assay.
Identification of Candida Species in Vaginal Samples
To test whether our HRM analysis could identify Candida present in clinical samples, we analyzed 22 samples from patients whose samples were positive for yeasts by culture on SAB or Chromagar Candida agar plates, with titers ranging from 1 CFU/ml to 2e6 CFU/ml. All samples generated amplicons, and 18 of 22 had Σ|ΔdMelt| scores that allowed their correct identification as C. albicans, scoring at least 1.5-fold lower than the next highest, incorrect species. Their extreme and average dMelt curves are shown in Figure 5, and all species identifications were confirmed by sequencing the amplicons. One of these, #318, fell slightly outside the distribution of the other C. albicans isolates, which was consistent with its more diverse rDNA sequence. The dMelt and Σ|ΔdMelt| score of sample 298 indicated C. glabrata, again consistent with its rDNA sequence. Two sequential isolates from the same patient, 322 and 332, had ambiguous Σ|ΔdMelt| scores, ie, their lowest scores (C. dubliniensis) were <1.5-fold lower than the next closest species. This flagged them for closer scrutiny; visual inspection of their dMelt curves suggested they were mixtures of C. albicans and C. glabrata. This was verified by recovery of colonies characteristic of both species from these samples on Chromagar Candida, and by sequencing. A “virtual mix” of C. albicans and C. glabrata melt curves, used as a reference, correctly identified the mix by its low Σ|ΔdMelt| score, as did an actual mix of equal amounts of the two templates. Only one vaginal sample, #312, would have been misidentified by Σ|ΔdMelt| scoring. Its melt curve had a unique profile, most closely resembling C. parapsilosis, but different in that it had an additional shoulder at ∼86.5°C, and lacked the signature shoulder seen in all C. parapsilosis isolates in the 81 to 83°C range. Sequencing of this amplicon showed that it is the basidiomycete Sporidiobolales (100% identity over 530 bases read from each end of the amplicon). However, inclusion of this dMelt into the reference database results in correct calling of sample #312 as Sporidiobolales.
Figure 5.
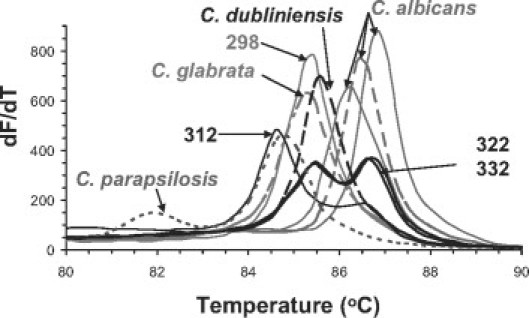
Identification of Candida species in vaginal samples of VVC patients. Twenty-two samples from culture-positive, symptomatic VVC patients were amplified with ITS2 primers. dMelt curves were averaged from duplicate or triplicate assays and plotted (solid lines) next to curves derived from select reference species (dashed lines). Atypical profiles are labeled with their 3-digit codes. The 18 samples with C. albicans profiles were summarized by showing the two most extreme variants (solid lines) and the averaged curve (dashed line) for the group.
Discussion
HRM analysis is capable of distinguishing all clinically important species of Candida, even if present at very limiting initial template concentrations. This is accomplished without the need for heteroduplex formation or internal control templates, which are needed to identify point mutations. Species identification, along with quantification, results immediately from the analysis of the amplicon with no further manipulations, enabling processing of hundreds of samples at low cost. Candida species were used here as a proof of principle, since these are the dominant genus clinically and are closely related, to challenge the tool. If these results extrapolate to all clinically important fungi, HRM analysis could become a major new tool for fungal molecular diagnosis.
A number of robust features were observed. Analysis of our vaginal lavage samples showed that clinical samples are readily assayed without interference from human DNA and tissue contaminants. It further demonstrates that variations within a species are tolerated by the assay, that it can resolve mixed samples, and that it flags novel species for sequence analysis and subsequent incorporation into a growing HRM database. The flagging of two vaginal samples as mixtures of both C. albicans and C. glabrata shows that the strategy can detect mixed infections. The mixture was evident from the shapes of their dMelt curves, and was also flagged by their Σ|Δ%ddMelt| scores, which indicated no matches to existing reference species. The observation that an in silico mixed reference could be generated, by simple averaging of two pure reference curves, to identify the mixed template, indicates that large numbers of possible combination templates need not be performed routinely to predict the content of mixtures. The flagging of a Sporidiobolales isolate in vaginal lavage #312 by its distinct dMelt curve is a validation of tools capacity to identify “newly emerging” species as they present, which would be missed by other methods such as species-specific primers. It also shows that basidiomycetes are included by our panfungal primers, PCR protocol, and sample processing. Whether sample #312 was contaminated with the atypical Sporidiobolales isolate (present at high titer) or the species was a true colonizer or infectious agent in this patient, does not detract from our argument that its detection is a validation of the tool. However, the Σ|Δ%ddMelt| scoring of sample #312 alone, without visual inspection of the dMelt curve, would have identified the isolate as C. parapsilosis in the absence of the correct reference species dMelt curve. This limitation is imposed by our initial, small database, which only permits the calling of species as the lowest Σ|Δ%ddMelt| score. As this database grows, the actual value of this score will take on an empirically imposed maximum value to retain an automated score; samples above this value will be flagged for visual inspection of dMelt curves. Of course, incorporation of “new” species into the database will continually minimize numbers of problematic samples. In the interim, dMelt curves should be inspected visually as a primary tool for detecting variants or novel species.
One might envision that application of this tool to more fungal species (the aspergilli, zygomycetes, Fusarium, Scedosporium) might, by chance, result in finding nearly identical melt profiles for different species. However, our early experience with these species suggests that they generate even more diverse, unique melt profiles, which can be identified without complication. This is supported by the evolutionary distances between most species (Figure 1).67,68,69,70 However, extrapolating from this experience among Candida species, the near identity of ITS1-2 domains among some species will not allow resolution to species level. This includes several groups, such as Mucor circinelloides, M. plumbeus, and M. racemosus, or Rhizopus azygosporus, R. oryzae, and R. microsporus, or some of the Penicillium or the Trichophyton species. Offsetting this limitation, there is little indication that resolution beyond genus level is clinically important for Mucor, Rhizopus, or the other zygomyctes.72,73 This is controversial among for Trichophyton spp.,74,75 and resolution of Penicillium marnefeii from other species of Penicillium may be important, but more susceptibility studies are needed to establish these needs. In the few samples in which species resolution is important but for which the melt analysis is ambiguous, it is always be an option to incorporate a second amplicon, or sequencing. Preliminary data suggest that our tool will resolve species of Aspergillus, the most common mold pathogen. Ultimately, validation of this approach will require testing of large numbers of clinical samples, comparing HRM profiles to their corresponding sequences, and the generation of a database of profiles that encompass potential deviations within species. It would not be surprising to learn that other curve comparison methods will be better suited for discriminating closely related species.
Published and commercial methods of HRM analysis usually rely on a normalization algorithm of the raw melting curve data, and then subtraction of each normalized curve from a reference curve. We have applied these methods to the data presented here, but found that they generate unwanted diversity of curves within a species, which is not based on real sequence difference. Often such curves have identical shapes but are displaced on the y axis, making species calling ambiguous, even with sophisticated normalizing algorithms. By comparing the first derivative of the melt curves, our method focuses on the shape of the melt curves rather than on absolute or normalized values, minimizing these differences without compromising the ability to distinguish among species. Our correct identification of Candida species from DNA directly recovered from vaginal samples supports this analysis and suggests that interference from human DNA and other clinical material will not be significant.
The strength of the HRM analysis tool is inexpensive and rapid identification of fungal species. This is important because of increasing incidences in which species is the deciding factor in therapy (http://www.idsociety.org/Content.aspx?id=9088; accessed 07/18/08). For example, among Candida species, fluconazole treatment should be avoided if the organism is known to be C. krusei or C. glabrata. Amphotericin B should not be used if the infecting species is A. terreus or C. lusitaniae. Among molds, identification of an Aspergillus is needed to warrant use of voriconazole, whereas a zygomycete infection might be treated with posaconazole.76,77,78 A limitation of our tool in its present form is that it will not detect acquired resistance within an otherwise susceptible species.
HRM analysis is, a priori, ideally suited to fungal speciation for several reasons. First, most clinical samples will have only a single dominant species. Second, the number of clinically important fungal species is small (in the dozens to hundreds), relative to clinically important bacterial species (thousands). Third, appropriate amplicon sequences are very divergent between even closely related species, while being conserved within the species. Finally, it is likely that newly emerging, more resistant fungal species will be identified as a result of increases in the population of immunocompromised patients, in the duration of immunosuppression, and in suppression of now dominant fungal species. HRM analysis is ideally suited for detection of new unknowns without the need for redesign and validation of new assays. Since the species identification can be made directly from the amplicon in the initial PCR reaction, using generic double-stranded DNA binding fluorescent dyes, rapid diagnosis of hundreds of clinical samples is feasible, fast, and economical.
Footnotes
Supported in part by a grant from the Michigan Economic Development Corporation and NIH grant 1R21AI081174-01A1.
References
- 1.White PL, Barton R, Guiver M, Linton CJ, Wilson S, Smith M, Gomez BL, Carr MJ, Kimmitt PT, Seaton S, Rajakumar K, Holyoake T, Kibbler CC, Johnson E, Hobson RP, Jones B, Barnes RA. A consensus on fungal polymerase chain reaction diagnosis? a United Kingdom-Ireland evaluation of polymerase chain reaction methods for detection of systemic fungal infections. J Mol Diagn. 2006;8:376–384. doi: 10.2353/jmoldx.2006.050120. [DOI] [PMC free article] [PubMed] [Google Scholar]
- 2.Baskova L, Landlinger C, Preuner S, Lion T. The Pan-AC assay: a single-reaction real-time PCR test for quantitative detection of a broad range of Aspergillus and Candida species. J Med Microbiol. 2007;56:1167–1173. doi: 10.1099/jmm.0.47212-0. [DOI] [PubMed] [Google Scholar]
- 3.De Marco D, Perotti M, Ossi CM, Burioni R, Clementi M, Mancini N. Development and validation of a molecular method for the diagnosis of medically important fungal infections. New Microbiol. 2007;30:308–312. [PubMed] [Google Scholar]
- 4.Dial SM. Fungal diagnostics: current techniques and future trends. Vet Clinics N Am. 2007;37:373–392. doi: 10.1016/j.cvsm.2006.11.002. [DOI] [PubMed] [Google Scholar]
- 5.Lau A, Chen S, Sorrell T, Carter D, Malik R, Martin P, Halliday C. Development and clinical application of a panfungal PCR assay to detect and identify fungal DNA in tissue specimens. J Clin Microbiol. 2007;45:380–385. doi: 10.1128/JCM.01862-06. [DOI] [PMC free article] [PubMed] [Google Scholar]
- 6.Tuon FF. A systematic literature review on the diagnosis of invasive aspergillosis using polymerase chain reaction (PCR) from bronchoalveolar lavage clinical samples. Rev Iberoam Micol. 2007;24:89–94. [PubMed] [Google Scholar]
- 7.Arendrup MC, Chryssanthou E, Gaustad P, Koskela M, Sandven P, Fernandez V. Diagnostics of fungal infections in the Nordic countries: we still need to improve! Scand J Infect Dis. 2007;39:337–343. doi: 10.1080/00365540601071859. [DOI] [PubMed] [Google Scholar]
- 8.Francesconi A, Kasai M, Petraitiene R, Petraitis V, Kelaher AM, Schaufele R, Hope WW, Shea YR, Bacher J, Walsh TJ. Characterization and comparison of galactomannan enzyme immunoassay and quantitative real-time PCR assay for detection of Aspergillus fumigatus in bronchoalveolar lavage fluid from experimental invasive pulmonary aspergillosis. J Clin Microbiol. 2006;44:2475–2480. doi: 10.1128/JCM.02693-05. [DOI] [PMC free article] [PubMed] [Google Scholar]
- 9.Verdaguer V, Walsh TJ, Hope W, Cortez KJ. Galactomannan antigen detection in the diagnosis of invasive aspergillosis. Exp Rev Mol Diagn. 2007;7:21–32. doi: 10.1586/14737159.7.1.21. [DOI] [PubMed] [Google Scholar]
- 10.Clancy CJ, Jaber RA, Leather HL, Wingard JR, Staley B, Wheat LJ, Cline CL, Rand KH, Schain D, Baz M, Nguyen MH. Bronchoalveolar lavage galactomannan in diagnosis of invasive pulmonary aspergillosis among solid-organ transplant recipients. J Clin Microbiol. 2007;45:1759–1765. doi: 10.1128/JCM.00077-07. [DOI] [PMC free article] [PubMed] [Google Scholar]
- 11.Scotter JM, Chambers ST. Comparison of galactomannan detection. PCR-enzyme-linked immunosorbent assay, and real-time PCR for diagnosis of invasive aspergillosis in a neutropenic rat model and effect of caspofungin acetate. Clin Diagn Lab Immunol. 2005;12:1322–1327. doi: 10.1128/CDLI.12.11.1322-1327.2005. [DOI] [PMC free article] [PubMed] [Google Scholar]
- 12.Willinger B. Laboratory diagnosis and therapy of invasive fungal infections. Curr Drug Targets. 2006;7:513–522. doi: 10.2174/138945006776359340. [DOI] [PubMed] [Google Scholar]
- 13.Wheat LJ. Antigen detection, serology, and molecular diagnosis of invasive mycoses in the immunocompromised host. Transpl Infect Dis. 2006;8:128–139. doi: 10.1111/j.1399-3062.2006.00165.x. [DOI] [PubMed] [Google Scholar]
- 14.Alexander BD, Ashley ED, Reller LB, Reed SD. Cost savings with implementation of PNA FISH testing for identification of Candida albicans in blood cultures. Diagn Microbiol Infect Dis. 2006;54:277–282. doi: 10.1016/j.diagmicrobio.2005.10.011. [DOI] [PubMed] [Google Scholar]
- 15.Forrest GN, Mankes K, Jabra-Rizk MA, Weekes E, Johnson JK, Lincalis DP, Venezia RA. Peptide nucleic acid fluorescence in situ hybridization-based identification of Candida albicans and its impact on mortality and antifungal therapy costs. J Clin Microbiol. 2006;44:3381–3383. doi: 10.1128/JCM.00751-06. [DOI] [PMC free article] [PubMed] [Google Scholar]
- 16.Rigby S, Procop GW, Haase G, Wilson D, Hall G, Kurtzman C, Oliveira K, Von Oy S, Hyldig-Nielsen JJ, Coull J, Stender H. Fluorescence in situ hybridization with peptide nucleic acid probes for rapid identification of Candida albicans directly from blood culture bottles. J Clin Microbiol. 2002;40:2182–2186. doi: 10.1128/JCM.40.6.2182-2186.2002. [DOI] [PMC free article] [PubMed] [Google Scholar]
- 17.Wilson DA, Joyce MJ, Hall LS, Reller LB, Roberts GD, Hall GS, Alexander BD, Procop GW. Multicenter evaluation of a Candida albicans peptide nucleic acid fluorescent in situ hybridization probe for characterization of yeast isolates from blood cultures. J Clin Microbiol. 2005;43:2909–2912. doi: 10.1128/JCM.43.6.2909-2912.2005. [DOI] [PMC free article] [PubMed] [Google Scholar]
- 18.Yeo SF, Wong B. Current status of nonculture methods for diagnosis of invasive fungal infections. Clin Microbiol Rev. 2002;15:465–484. doi: 10.1128/CMR.15.3.465-484.2002. [DOI] [PMC free article] [PubMed] [Google Scholar]
- 19.Anane S, Khalfallah F. [Biological diagnosis of systemic candidiasis: difficulties and future prospects] Pathol Biol (Paris) 2007;55:262–272. doi: 10.1016/j.patbio.2006.03.003. [DOI] [PubMed] [Google Scholar]
- 20.El-Mahallawy HA, Shaker HH, Ali Helmy H, Mostafa T, Razak Abo-Sedah A. Evaluation of pan-fungal PCR assay and Aspergillus antigen detection in the diagnosis of invasive fungal infections in high risk paediatric cancer patients. Med Mycol. 2006;44:733–739. doi: 10.1080/13693780600939955. [DOI] [PubMed] [Google Scholar]
- 21.Al Mosaid A, Sullivan DJ, Polacheck I, Shaheen FA, Soliman O, Al Hedaithy S, Al Thawad S, Kabadaya M, Coleman DC. Novel 5-flucytosine-resistant clade of Candida dubliniensis from Saudi Arabia and Egypt identified by Cd25 fingerprinting. J Clin Microbiol. 2005;43:4026–4036. doi: 10.1128/JCM.43.8.4026-4036.2005. [DOI] [PMC free article] [PubMed] [Google Scholar]
- 22.Botelho AR, Planta RJ. Specific identification of Candida albicans by hybridization with oligonucleotides derived from ribosomal DNA internal spacers. Yeast (Chichester, England) 1994;10:709–717. doi: 10.1002/yea.320100603. [DOI] [PubMed] [Google Scholar]
- 23.Carr MJ, Clarke S, O'Connell F, Sullivan DJ, Coleman DC, O'Connell B. First reported case of endocarditis caused by Candida dubliniensis. J Clin Microbiol. 2005;43:3023–3026. doi: 10.1128/JCM.43.6.3023-3026.2005. [DOI] [PMC free article] [PubMed] [Google Scholar]
- 24.de Llanos Frutos R, Fernandez-Espinar MT, Querol A. Identification of species of the genus Candida by analysis of the 5.8S rRNA gene and the two ribosomal internal transcribed spacers. Antonie van Leeuwenhoek. 2004;85:175–185. doi: 10.1023/B:ANTO.0000020154.56649.0f. [DOI] [PubMed] [Google Scholar]
- 25.Ellepola AN, Hurst SF, Elie CM, Morrison CJ. Rapid and unequivocal differentiation of Candida dubliniensis from other Candida species using species-specific DNA probes: comparison with phenotypic identification methods. Oral Microbiol Immunol. 2003;18:379–388. doi: 10.1046/j.0902-0055.2003.00103.x. [DOI] [PubMed] [Google Scholar]
- 26.Fujita S, Lasker BA, Lott TJ, Reiss E, Morrison CJ. Microtitration plate enzyme immunoassay to detect PCR-amplified DNA from Candida species in blood. J Clin Microbiol. 1995;33:962–967. doi: 10.1128/jcm.33.4.962-967.1995. [DOI] [PMC free article] [PubMed] [Google Scholar]
- 27.Gee SF, Joly S, Soll DR, Meis JF, Verweij PE, Polacheck I, Sullivan DJ, Coleman DC. Identification of four distinct genotypes of Candida dubliniensis and detection of microevolution in vitro and in vivo. J Clin Microbiol. 2002;40:556–574. doi: 10.1128/JCM.40.2.556-574.2002. [DOI] [PMC free article] [PubMed] [Google Scholar]
- 28.Guiver M, Levi K, Oppenheim BA. Rapid identification of Candida species by TaqMan PCR. J Clin Pathol. 2001;54:362–366. doi: 10.1136/jcp.54.5.362. [DOI] [PMC free article] [PubMed] [Google Scholar]
- 29.Iida S, Imai T, Oguri T, Okuzumi K, Yamanaka A, Moretti-Branchini ML, Nishimura K, Mikami Y. Genetic diversity of the internal transcribed spacers (ITS) and 5.8S rRNA genes among the clinical isolates of Candida parapsilosis in Brazil and Japan. Nihon Ishinkin Gakkai zasshi. Japanese J Med Mycol. 2005;46:133–137. doi: 10.3314/jjmm.46.133. [DOI] [PubMed] [Google Scholar]
- 30.Irobi J, Schoofs A, Goossens H. Genetic identification of Candida species in HIV-positive patients using the polymerase chain reaction and restriction fragment length polymorphism analysis of its DNA. Mol Cell Probes. 1999;13:401–406. doi: 10.1006/mcpr.1999.0266. [DOI] [PubMed] [Google Scholar]
- 31.Kano R, Sakamoto Y, Hanahachi A, Kamata H, Fukuda Y, Fujiwara K, Hasegawa A. Molecular identification of Candida parapsilosis from crop mucosa in a cockatiel. J Vet Diagn Invest. 2001;13:437–439. doi: 10.1177/104063870101300515. [DOI] [PubMed] [Google Scholar]
- 32.Kurzai O, Korting HC, Harmsen D, Bautsch W, Molitor M, Frosch M, Muhlschlegel FA. Molecular and phenotypic identification of the yeast pathogen Candida dubliniensis. J Mol Med (Berlin, Germany) 2000;78:521–529. doi: 10.1007/s001090000142. [DOI] [PubMed] [Google Scholar]
- 33.Lott TJ, Burns BM, Zancope-Oliveira R, Elie CM, Reiss E. Sequence analysis of the internal transcribed spacer 2 (ITS2) from yeast species within the genus Candida. Curr Microbiol. 1998;36:63–69. doi: 10.1007/s002849900280. [DOI] [PubMed] [Google Scholar]
- 34.Lott TJ, Holloway BP, Logan DA, Fundyga R, Arnold J. Towards understanding the evolution of the human commensal yeast Candida albicans. Microbiology (Reading, England) 1999;145:1137–1143. doi: 10.1099/13500872-145-5-1137. [DOI] [PubMed] [Google Scholar]
- 35.Lott TJ, Kuykendall RJ, Reiss E. Nucleotide sequence analysis of the 5.8S rDNA and adjacent ITS2 region of Candida albicans and related species. Yeast (Chichester, England) 1993;9:1199–1206. doi: 10.1002/yea.320091106. [DOI] [PubMed] [Google Scholar]
- 36.Lu HZ, Jia JH, Wang QM, Bai FY. Candida asparagi sp nov Candida diospyri sp nov and Candida qinlingensis sp nov, novel anamorphic, ascomycetous yeast species. Int J Sys Evol Microbiol. 2004;54:1409–1414. doi: 10.1099/ijs.0.03055-0. [DOI] [PubMed] [Google Scholar]
- 37.Millon L, Piarroux R, Drobacheff C, Monod M, Grenouillet F, Bulle B, Bole J, Blancard A, Meillet D. Evaluation of internal transcribed spacer region of ribosomal DNA sequence analysis for molecular characterization of Candida albicans and Candida dubliniensis isolates from HIV-infected patients. Med Mycol. 2002;40:535–543. doi: 10.1080/mmy.40.6.535.543. [DOI] [PubMed] [Google Scholar]
- 38.Park S, Wong M, Marras SA, Cross EW, Kiehn TE, Chaturvedi V, Tyagi S, Perlin DS. Rapid identification of Candida dubliniensis using a species-specific molecular beacon. J Clin Microbiol. 2000;38:2829–2836. doi: 10.1128/jcm.38.8.2829-2836.2000. [DOI] [PMC free article] [PubMed] [Google Scholar]
- 39.Pinjon E, Jackson CJ, Kelly SL, Sanglard D, Moran G, Coleman DC, Sullivan DJ. Reduced azole susceptibility in genotype 3 Candida dubliniensis isolates associated with increased CdCDR1 and CdCDR2 expression. Antimicrob Agents Chemo. 2005;49:1312–1318. doi: 10.1128/AAC.49.4.1312-1318.2005. [DOI] [PMC free article] [PubMed] [Google Scholar]
- 40.Prasad GS, Mayilraj S, Sood N, Singh V, Biswas K, Lal B. Candida digboiensis sp nov, a novel anamorphic yeast species from an acidic tar sludge-contaminated oilfield. Int J Sys Evol Microbiol. 2005;55:967–972. doi: 10.1099/ijs.0.63313-0. [DOI] [PubMed] [Google Scholar]
- 41.Selvarangan R, Bui U, Limaye AP, Cookson BT. Rapid identification of commonly encountered Candida species directly from blood culture bottles. J Clin Microbiol. 2003;41:5660–5664. doi: 10.1128/JCM.41.12.5660-5664.2003. [DOI] [PMC free article] [PubMed] [Google Scholar]
- 42.Shin JH, Nolte FS, Holloway BP, Morrison CJ. Rapid identification of up to three Candida species in a single reaction tube by a 5′ exonuclease assay using fluorescent DNA probes. J Clin Microbiol. 1999;37:165–170. doi: 10.1128/jcm.37.1.165-170.1999. [DOI] [PMC free article] [PubMed] [Google Scholar]
- 43.Sugita T, Takeo K, Ohkusu M, Virtudazo E, Takashima M, Asako E, Ohshima F, Harada S, Yanaka C, Nishikawa A, Majoros L, Sipiczki M. Fluconazole-resistant pathogens Candida inconspicua and C. norvegensis: dNA sequence diversity of the rRNA intergenic spacer region, antifungal drug susceptibility, and extracellular enzyme production. Microbiol Immunol. 2004;48:761–766. doi: 10.1111/j.1348-0421.2004.tb03602.x. [DOI] [PubMed] [Google Scholar]
- 44.Tamura M, Watanabe K, Mikami Y, Yazawa K, Nishimura K. Molecular characterization of new clinical isolates of Candida albicans and C. dubliniensis in Japan: analysis reveals a new genotype of C. albicans with group I intron. J Clin Microbiol. 2001;39:4309–4315. doi: 10.1128/JCM.39.12.4309-4315.2001. [DOI] [PMC free article] [PubMed] [Google Scholar]
- 45.Wahyuningsih R, Freisleben HJ, Sonntag HG, Schnitzler P. Simple and rapid detection of Candida albicans DNA in serum by PCR for diagnosis of invasive candidiasis. J Clin Microbiol. 2000;38:3016–3021. doi: 10.1128/jcm.38.8.3016-3021.2000. [DOI] [PMC free article] [PubMed] [Google Scholar]
- 46.White PL, Williams DW, Kuriyama T, Samad SA, Lewis MA, Barnes RA. Detection of Candida in concentrated oral rinse cultures by real-time PCR. J Clin Microbiol. 2004;42:2101–2107. doi: 10.1128/JCM.42.5.2101-2107.2004. [DOI] [PMC free article] [PubMed] [Google Scholar]
- 47.Xu J, Millar BC, Moore JE, McClurg R, Walker MJ, Evans J, Hedderwick S, McMullan R. Comparison of API20C with molecular identification of Candida spp isolated from bloodstream infections. J Clin Microbiol. 2002;55:774–777. doi: 10.1136/jcp.55.10.774. [DOI] [PMC free article] [PubMed] [Google Scholar]
- 48.Zeng X, Kong F, Halliday C, Chen S, Lau A, Playford G, Sorrell TC. Reverse line blot hybridization assay for identification of medically important fungi from culture and clinical specimens. J Clin Microbiol. 2007;45:2872–2880. doi: 10.1128/JCM.00687-07. [DOI] [PMC free article] [PubMed] [Google Scholar]
- 49.Playford EG, Kong F, Sun Y, Wang H, Halliday C, Sorrell TC. Simultaneous detection and identification of Candida, Aspergillus, and Cryptococcus species by reverse line blot hybridization. J Clin Microbiol. 2006;44:876–880. doi: 10.1128/JCM.44.3.876-880.2006. [DOI] [PMC free article] [PubMed] [Google Scholar]
- 50.Garaizar J, Brena S, Bikandi J, Rementeria A, Ponton J. Use of DNA microarray technology and gene expression profiles to investigate the pathogenesis, cell biology, antifungal susceptibility and diagnosis of Candida albicans. FEMS Yeast Res. 2006;6:987–998. doi: 10.1111/j.1567-1364.2006.00108.x. [DOI] [PubMed] [Google Scholar]
- 51.Sampath R, Hall TA, Massire C, Li F, Blyn LB, Eshoo MW, Hofstadler SA, Ecker DJ. Rapid Identification of Emerging Infectious Agents Using PCR and Electrospray Ionization Mass Spectrometry. Ann NY Acad Sci. 2007;1102:109–120. doi: 10.1196/annals.1408.008. [DOI] [PMC free article] [PubMed] [Google Scholar]
- 52.Balajee SA, Sigler L, Brandt ME. DNA and the classical way: identification of medically important molds in the 21st century. Med Mycol. 2007;45:475–490. doi: 10.1080/13693780701449425. [DOI] [PubMed] [Google Scholar]
- 53.Wise MG, Healy M, Reece K, Smith R, Walton D, Dutch W, Renwick A, Huong J, Young S, Tarrand J, Kontoyiannis DP. Species identification and strain differentiation of clinical Candida isolates using the DiversiLab system of automated repetitive sequence-based PCR. J Med Microbiol. 2007;56:778–787. doi: 10.1099/jmm.0.47106-0. [DOI] [PubMed] [Google Scholar]
- 54.Loeffler J, Henke N, Hebart H, Schmidt D, Hagmeyer L, Schumacher U, Einsele H. Quantification of fungal DNA by using fluorescence resonance energy transfer and the light cycler system. J Clin Microbiol. 2000;38:586–590. doi: 10.1128/jcm.38.2.586-590.2000. [DOI] [PMC free article] [PubMed] [Google Scholar]
- 55.Hsu MC, Chen KW, Lo HJ, Chen YC, Liao MH, Lin YH, Li SY. Species identification of medically important fungi by use of real-time LightCycler PCR. J Med Microbiol. 2003;52:1071–1076. doi: 10.1099/jmm.0.05302-0. [DOI] [PubMed] [Google Scholar]
- 56.Carvalho A, Costa-De-Oliveira S, Martins ML, Pina-Vaz C, Rodrigues AG, Ludovico P, Rodrigues F. Multiplex PCR identification of eight clinically relevant Candida species. Med Mycol. 2007;45:619–627. doi: 10.1080/13693780701501787. [DOI] [PubMed] [Google Scholar]
- 57.Haynes KA, Westerneng TJ. Rapid identification of Candida albicans. C glabrata, C parapsilosis and C krusei by species-specific PCR of large subunit ribosomal DNA. J Med Microbiol. 1996;44:390–396. doi: 10.1099/00222615-44-5-390. [DOI] [PubMed] [Google Scholar]
- 58.Jaeger EE, Carroll NM, Choudhury S, Dunlop AA, Towler HM, Matheson MM, Adamson P, Okhravi N, Lightman S. Rapid detection and identification of Candida. Aspergillus, and Fusarium species in ocular samples using nested PCR. J Clin Microbiol. 2000;38:2902–2908. doi: 10.1128/jcm.38.8.2902-2908.2000. [DOI] [PMC free article] [PubMed] [Google Scholar]
- 59.Luo G, Mitchell TG. Rapid identification of pathogenic fungi directly from cultures by using multiplex PCR. J Clin Microbiol. 2002;40:2860–2865. doi: 10.1128/JCM.40.8.2860-2865.2002. [DOI] [PMC free article] [PubMed] [Google Scholar]
- 60.Nishikawa A, Sugita T, Shinoda T. Rapid identification of Debaryomyces hansenii/Candida famata by polymerase chain reaction. Med Mycol. 1999;37:101–104. [PubMed] [Google Scholar]
- 61.Pontieri E, Caracciolo C, Bianchini S, Dantonio D, Novelli G, Dallapiccola B, Carruba G. Single primer pair for PCR identification of Candida parapsilosis group I isolates. J Med Microbiol. 2001;50:441–448. doi: 10.1099/0022-1317-50-5-441. [DOI] [PubMed] [Google Scholar]
- 62.Shin JH, Nolte FS, Morrison CJ. Rapid identification of Candida species in blood cultures by a clinically useful PCR method. J Clin Microbiol. 1997;35:1454–1459. doi: 10.1128/jcm.35.6.1454-1459.1997. [DOI] [PMC free article] [PubMed] [Google Scholar]
- 63.Rudi K, Kleiberg GH, Heiberg R, Rosnes JT. Rapid identification and classification of bacteria by 16S rDNA restriction fragment melting curve analyses (RFMCA) Food Microbiol. 2007;24:474–481. doi: 10.1016/j.fm.2006.09.006. [DOI] [PubMed] [Google Scholar]
- 64.Rudi K, Skanseng B, Dromtorp SM. Explorative screening of complex microbial communities by real-time 16S rDNA restriction fragment melting curve analyses. Biotechniques. 2005;39:116–121. doi: 10.2144/05391GT02. [DOI] [PubMed] [Google Scholar]
- 65.Seipp MT, Durtschi JD, Liew MA, Williams J, Damjanovich K, Pont-Kingdon G, Lyon E, Voelkerding KV, Wittwer CT. Unlabeled oligonucleotides as internal temperature controls for genotyping by amplicon melting. J Mol Diagn. 2007;9:284–289. doi: 10.2353/jmoldx.2007.060136. [DOI] [PMC free article] [PubMed] [Google Scholar]
- 66.Vazquez JA, Beckley A, Sobel JD, Zervos MJ. Comparison of restriction enzyme analysis and pulsed-field gradient gel electrophoresis as typing systems for Candida albicans. J Clin Microbiol. 1991;29:962–967. doi: 10.1128/jcm.29.5.962-967.1991. [DOI] [PMC free article] [PubMed] [Google Scholar]
- 67.Tamura K, Dudley J, Nei M, Kumar S. MEGA4: Molecular Evolutionary Genetics Analysis (MEGA) software version 4.0. Mol Biol Evol. 2007;24:1596–1599. doi: 10.1093/molbev/msm092. [DOI] [PubMed] [Google Scholar]
- 68.Saitou N, Nei M. The neighbor-joining method: a new method for reconstructing phylogenetic trees. Mol Biol Evol. 1987;4:406–425. doi: 10.1093/oxfordjournals.molbev.a040454. [DOI] [PubMed] [Google Scholar]
- 69.Felsenstein J: Confidence limits on phylogenies: An approach using the bootstrap. Evolution 39: 783–791 [DOI] [PubMed]
- 70.Tamura K, Nei M, Kumar S. Prospects for inferring very large phylogenies by using the neighbor-joining method. Proc Natl Acad Sci USA. 2004;101:11030–11035. doi: 10.1073/pnas.0404206101. [DOI] [PMC free article] [PubMed] [Google Scholar]
- 71.Jones T, Federspiel NA, Chibana H, Dungan J, Kalman S, Magee BB, Newport G, Thorstenson YR, Agabian N, Magee PT, Davis RW, Scherer S. The diploid genome sequence of Candida albicans. Proc Natl Acad Sci USA. 2004;101:7329–7334. doi: 10.1073/pnas.0401648101. [DOI] [PMC free article] [PubMed] [Google Scholar]
- 72.Rogers TR. Treatment of zygomycosis: current and new options. J Antimicrob Chemother. 2008;61:i35–i40. doi: 10.1093/jac/dkm429. [DOI] [PubMed] [Google Scholar]
- 73.Torres-Narbona M, Guinea J, Martinez-Alarcon J, Pelaez T, Bouza E. In vitro activities of amphotericin B, caspofungin, itraconazole, posaconazole, and voriconazole against 45 clinical isolates of zygomycetes: comparison of CLSI M38-A, Sensititre YeastOne, and the Etest antimicrobial agents. Chemother. 2007;51:1126–1129. doi: 10.1128/AAC.01539-06. [DOI] [PMC free article] [PubMed] [Google Scholar]
- 74.Gupta A.K. YK. In vitro susceptibility testing of ciclopirox, terbinafine, ketoconazole and itraconazole against dermatophytes and nondermatophytes, and in vitro evaluation of combination antifungal activity. Br J Dermatol. 2003;149:296–305. doi: 10.1046/j.1365-2133.2003.05418.x. [DOI] [PubMed] [Google Scholar]
- 75.Espinel-Ingroff A, Boyle K, Sheehan D. In vitro antifungal activities of voriconazole and reference agents as determined by NCCLS methods: review of the literature. Mycopathologia. 2001;150:101–115. doi: 10.1023/a:1010954803886. [DOI] [PubMed] [Google Scholar]
- 76.Mishra NN, Prasad T, Sharma N, Payasi A, Prasad R, Gupta DK, Singh R. Pathogenicity and drug resistance in Candida albicans and other yeast species. A review. Acta Microbiol Immunol Hung. 2007;54:201–235. doi: 10.1556/AMicr.54.2007.3.1. [DOI] [PubMed] [Google Scholar]
- 77.Chandrasekar PH. Antifungal resistance in Aspergillus. Med Mycol. 2005;43 Suppl 1:S295–S298. doi: 10.1080/13693780400029130. [DOI] [PubMed] [Google Scholar]
- 78.Polak A. Antifungal therapy—state of the art at the beginning of the 21st century. Progress in drug research. Fortschritte der Arzneimittelforschung. 2003:59–190. doi: 10.1007/978-3-0348-7974-3_4. [DOI] [PubMed] [Google Scholar]