

Vertebrate visual pigment rhodopsin is a G protein-coupled receptor (GPCR) responsible for twilight vision. Upon activation by light, rhodopsin initiates the visual transduction cascade that leads to the transmission of an optic nerve signal to the brain.[1–3] In both flying and terrestrial animals such a signal is vital for foraging, navigation, and mate selection within their immediate environment.[4,5] Both the vertebrate (bovine) and invertebrate (squid) rhodopsins contain a 11-cis-retinal chromophore bound covalently to a protonated Schiff base (PSBR) nitrogen atom of a lysine residue at site 296 and 305, respectively. In bovine rhodopsin, Glu113 is the main counterion and forms a hydrogen bond with the PSBR.[6–9] However, in squid rhodopsin the position corresponding to Glu113 is occupied by Tyr111, and together with Asn87 they serve as potential hydrogen-bonding partners for the PSBR. There is only one glutamate (Glu180) in the interior of squid rhodopsin and is situated at ≈5 Å away from PSBR and corresponds to Glu181 in bovine rhodopsin. All other glutamates in squid rhodopsin are at the surface and more than 17 Å away from PSBR.[10,11]
Despite their large phylogenetic distance, the most important difference between the vertebrate and invertebrate rhodopsins arises from their selective activation of G protein subtypes.[12] Bovine rhodopsin signals through transducin, the α-subunit of a Gt-type of G protein that activates the cyclic guanosine monophosphate phosphodiesterase and then closes the cation channel. In contrast, squid rhodopsin signals through the α-subunit of a Gq-type of G protein that activates phospholipase C and opens a calcium channel.[12,13] Recently two X-ray crystal structures of squid rhodopsin have been reported at 3.7[10] and 2.5 Å[11] resolution (Figure 1). They present a major step toward understanding the mechanistic details of the chemistry of vision in a Gq-coupled GPCR.
Figure 1.

Side and top view of the overlay of the backbone atom positions of seven transmembrane α-helices of 2.5 Å (green), 3.7 Å (blue) crystal structures and QM/MM optimized structure (red) of the WS2 model of squid rhodopsin.
Hybrid quantum mechanical/molecular mechanics (QM/MM) calculations are the method of choice for investigating structural and spectroscopic properties of complex biomolecular systems such as retinal proteins. In such methods, a relatively small region of the system in which the chemical reactions occur is modeled at QM level and the remaining part is treated with MM force fields.[14,15] In this study, we have investigated the role of the protein environment and internal water molecules on the structure and electronic spectra of the PSBR by applying QM/MM methods on an X-ray structure of squid rhodopsin. The accuracy and applicability of this computational setup have already been shown to provide novel insights into the understanding of retinal architecture in wild type and mutant bovine rhodopsins.[16,17]
Generally, cavities inside proteins are often found to be empty in X-ray studies,[18] but are actually found to be filled with water molecules in NMR measurements.[19] The presence of internal water molecules near the SB terminal seems, however, to be a common structural motif characterizing GPCR chromophore binding sites. Conserved water molecules have been recently shown to mediate activation signals from the retinal binding pocket to the cytoplasmic surface of rhodopsin and rhodopsin-like GPCRs.[20] In bovine rhodopsin, there are two water molecules near the SB terminal[21] that are involved in the counterion switch mechanism from Glu113 to Glu181 during the formation of metarhodopsin-I.[22] Bacteriorhodopsin[23] and halorhodopsin[24] contain three water molecules near the SB region and are shown to play a critical role in the chromophore counterion interactions. Xanthorhodopsin, a proton pump with a light-harvesting cartenoid antenna, contains a bridged-water molecule between the SB and the counterions.[25] Molecular dynamics simulations of wild-type β1 and β2 adrenergic receptors have also provided evidence for the presence of one or two internal water molecules that are absent in their crystal structures.[26]
In squid rhodopsin, the available X-ray studies with 2.5 and 3.7 Å resolutions could not resolve any internal water molecules near the SB region.[8,9] However, there is space available for the inclusion of some water molecules near the SB region and therefore the effect of inclusion of such water molecules and their effect on the structural rearrangement and spectroscopic properties is also investigated in this study.
In the presence and absence of such additional internal water molecules, we obtained squid rhodopsin structures with QM/MM (QM=B3LYP/6-31G*; MM=AMBER) geometry optimizations in ONIOM Scheme (see Supporting Information). The backbone atom positions of the seven transmembrane α-helices of two crystal structures are very well conserved in the resulting QM/MM structures (Figure 1). However, positions of the potential hydrogen-bonding residues (Asn87, Tyr111) near the SB region are affected significantly by the number of water molecules (see Table 1).
Table 1.
Comparison of distances from the PSB nitrogen atom to side-chain oxygen atom of the Asn87, Tyr111, and Glu180 residues between the X-ray and optimized QM/MM geometries.
| Distance [Å] | QM/MMa | X-rayb | ||||
|---|---|---|---|---|---|---|
| WS0 | WS1 | WS2 | WS3 | 2Z73 | 2ZIY | |
| OH(Tyr111)–N(PSBR) | 3.11 | 5.08 | 3.41 | 3.29 | 2.99 | 2.89 |
| OD1(Asn87)–N(PSBR) | 2.82 | 4.48 | 3.93 | 2.85 | 3.73 | 3.77 |
| OE2(Glu180)–N(PSBR) | 4.52 | 3.99 | 4.29 | 4.72 | 5.08 | 5.66 |
Optimized QM/MM models contain no water (WS0), one water (WS1), two water (WS2) and three water (WS3) molecules near the SB region.
X-ray data sets are taken from chain A of 2.5 Å (PDB code: 2Z73) and 3.7 Å (PDB code: 2ZIY) structures.
Compared to the X-ray structures, in the absence of any additional water molecules around the SB region (water system WS0), the distance between Asn87 side chain and SB nitrogen is underestimated by ≈1 Å and as a consequence Asn87 forms a strong hydrogen bond with the PSBR. In the presence of one such water molecule (WS1) the distance is overestimated by ≈2 Å. However, inclusion of two water molecules (WS2) brings the key distance between SB nitrogen and potential hydrogen-bonding residues (Asn87, Tyr111) within 0.5 Å deviation and also in good agreement with the X-ray data. In the WS2 model, W1 forms a hydrogen bond with a SB nitrogen atom and Asn87 (W1), and W2 forms an hydrogen bond with W1 and backbone oxygen atom of Tyr111 (Figure 2).
Figure 2.

Optimized QM/MM model (WS2) of squid rhodopsin containing two internal water molecules (W1, W2). The H-bond network between SB nitrogen of PSBR chromophore (cyan), and side chain oxygen of Asn87 (magenta), Tyr111 (green), Glu180 (yellow) are shown in black dots. The distances in numbers are given in Table 1.
We also included a third water molecule near the anionic Glu180 (WS3). Although this improves the position of Glu180 considerably, the trend seen in positions of Asn87 and Tyr111 are similar to WS0 and WS1 models. Incidentally, low-temperature FTIR study suggests the presence of a bridged water molecule near the SB region[27] and this may actually correspond to W1 in Figure 2 or OH moiety of Tyr111.
The deviations seen in the calculated geometry parameters are irrespective of the inclusion of water molecules in the QM region. Also, the calculated deviations in the WS0–3 systems may appear to be large at first glance; however, the distances between Asn87 and Tyr111 side chains or between Glu180 side chain and the SB nitrogen atom in the X-ray structures, also deviate by more than 0.6 Å.
Geometric parameters of PSBR in the two available crystal structures and in the QM/MM-optimized WS0, WS1, WS2, and WS3 systems at B3LYP/AMBER level are given in Figure 3. First of all, it should be noted that due to non-availability of well-established parameters in the standard X-ray refinement softwares, PSBR coordinates in the crystal structures of retinal proteins are often based on the outcome of some low-level MM calculations fitted to the experimental electron density.[9] This explains why geometry parameters of PSBR in the two available crystal structures differ significantly from each other and also from the optimized QM/MM geometries (Figure 4).
Figure 3.

Comparison of the bond length alternation (bottom), bond angles (middle) and dihedral angles (top) along the conjugated carbon chain of the 2.5 Å (red), 3.7 Å (green) X-ray and QM/MM retinal geometry in four different set-ups; WS0 (blue), WS1 (cyan), WS2 (black), WS3 (magenta). The experimental structure sets taken from chain A. The dihedral angle deviations are from either cis (0°) or the trans (180°) configuration.
Figure 4.
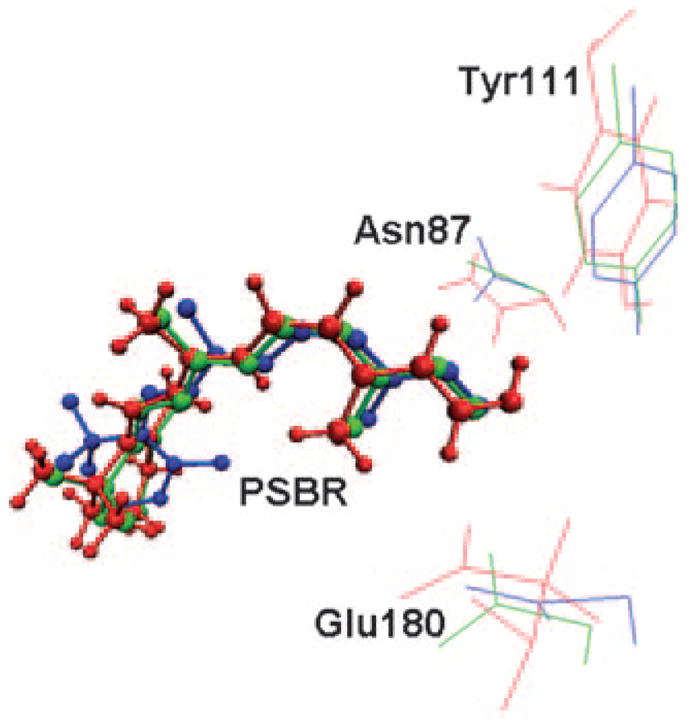
Overlay of the 11-cis-retinal protonated Schiff base (PSBR) and Glu180, Tyr111, Asn87, residues of 2.5 Å (green), 3.7 Å (blue) crystal structures and QM/MM optimized structure (red) of the WS2 model of squid rhodopsin.
Compared to the X-ray structures, the deviations in the calculated bond lengths is also the smallest in the presence of only two internal water molecules near the SB region. Analogously, it has been shown on bovine rhodopsin that the calculated QM/MM geometry parameters of the PSBR are more consistent with the experimental NMR data rather than those in the X-ray structures.[16] Therefore in the absence of any such available experimental NMR data for squid rhodopsin, the optimized QM/MM geometry presented in this study should provide a reasonable reference point for further studies on squid rhodopsin.
Although less pronounced compared to the X-ray data, QM/MM calculations reveal significant single/double bond-length alternation (BLA) patterns along the retinal polyene chain (Figure 3 bottom). The peaks correspond to the single bond lengths that range as high as 1.47 Å for C6–C7 to as low as 1.40 Å for C14–C15 bonds. On the other hand, the troughs indicate reduction in values of the order of ≈0.10 Å for the corresponding double bonds. Average BLA of C5–N moiety (which is defined as the average of the bond lengths of single bonds minus that of double bonds), is 0.07 Å for all QM/MM models (WS0–3). It is 0.01 Å larger than that calculated for bovine rhodopsin.[16]
Probably due to hybridization changes caused by alternating atomic charges, the bond angles (Figure 3 middle) centered at odd numbered carbon atoms are always smaller than their direct neighbors.[28,29] The smallest bond angles appear at C9 and C13 due to the presence of spacious methyl substituents at these positions. Significant nonplanar distortions (mostly in the range of −10±10°) are induced into the chromophore (Figure 3 top) in presence of the forces exerted by the protein pocket. The C5-C6-C7-C8 twist angle of the β-ionone ring is found to be significantly different in the two available X-ray structures. The lower resolution (3.7 Å) X-ray study estimates almost a planar ring with −13° relative to the polyene chain,[10] while the higher resolution data (2.5 Å) give an almost perpendicular twist of −71°.[11] The present QM/MM calculations find an intermediate value of −45°, analogous to that found in bovine rhodopsin.[9,16] In particular, the negative pre-twist required for the photoisomerization of the C11–C12 double bond is evident from the calculated dihedral angle of −17°.
The difference in response between the excited and ground states to the external perturbation from the protein environment is popularly referred to as spectral tuning. For the gas-phase retinal systems as well as bovine rhodopsin and its mutants, the cost-effective multireference SORCI+ Q ab initio method with the present computational settings (see Experimental Section) has been shown to yield the first singlet vertical excitation (corresponding to the experimental λmax of a UV/Vis spectrum) not only consistent with the more extensive MRCISD+Q and CASPT2 methods, but also within ±15 nm of the experimental measurements.[16,17] Therefore, we use this method to perform absorption wavelength calculations of the chromophore in the QM/MM-optimized structures of squid rhodopsin. These SORCI+Q calculations were performed in the gas phase (PSBRgp) and in the presence of electrostatic and polarizing fields of protein environment of squid rhodopsin (PSBRprotein). In the following, the absorption wavelength values (λ) are discussed mainly for the WS2 and WS0 (given in parentheses) models. The conclusions drawn are the same for other water systems (see data at the footnote of Table 2).
Table 2.
The calculated SORCI+Q first vertical absorption wavelengths (λ) in nm, oscillator (f) and rotatory (R) strengths [in au] of the PSBR in gas-phase (gp) and protein environments.a,f
| WS0 | WS2 | |||||
|---|---|---|---|---|---|---|
| λ | f | R | λ | f | R | |
| PSBRgp | 599 | 0.9 | 0.12 | 604 | 0.9 | 0.16 |
| PSBRproteinb | 476 | 1.2 | 0.26 | 490 | 1.1 | 0.32 |
| PSBRproteinb –Asn87c | 517 | 1.1 | 0.21 | 510 | 1.1 | 0.32 |
| PSBRproteinb –Tyr111c | 487 | 1.1 | 0.26 | 501 | 1.1 | 0.31 |
| PSBRproteinb –Glu180c | 606 | 0.9 | 0.11 | 591 | 1.0 | 0.17 |
| PSBRproteind,e | – | – | – | 599 | 1.0 | 0.17 |
See Supporting Information for the second vertical excitation energies.
Protein containing the deprotonated/charged Glu180.
Charges of that particular amino acid turned off.
Protein containing the protonated/neutral Glu180.
PSBRgp absorbs at 632 nm when Glu180 is protonated.
For WS3, PSBRgp absorbs at 599 nm, PSBRprotein absorbs at 463 nm and PSBRprotein–Glu180 absorbs at 570 nm.
In the absence of any electrostatic or polarization effect from the protein, PSBR in the gasphase absorbs at 604 (599) nm (Table 2). Compared to the optimized PSBR in vacuo that absorbs at 625 nm,[17] geometrical distortions induced by the protein environment blue shifts the absorption wavelength by ≈20 nm, a trend also seen in the QM/MM calculations on bacteriorhodopsin.[30] Recent experimental measurements and theoretical calculations[31–33] have already shown that PSBR in the gas phase absorbs at 610 nm, therefore our calculated value of 604 nm will serve as a good reference point for evaluating the important residual effects from the protein (MM region). When the electrostatic and polarization effects from the protein are included, the chromophore absorbs at 490 (476) nm, in excellent agreement with the experimental measurements (480[6] and 493 nm[7]) and thus the absorption wavelength dramatically blue-shifts by ≈120 nm, an aspect analogous to the findings in bovine rhodopsin.[16,17,34–36]
QM/MM studies allow us to investigate the contribution of a specific amino acid on the absorption wavelength by turning off its charges. Therefore, to determine the origin of the significant blue shift (≈120 nm) from gas phase to the squid rhodopsin, we turned off the charges of several amino acids (see Supporting Information). The most significant contributions come from Tyr111, Asn87 and Glu180 (in the increasing order) and they all blue shift the absorption maximum. The effects of other amino acids are within ±10 nm and counterbalance each other (see Supporting Information for details). Tyr111 induces a blue shift of only 10 (11) nm, whereas Asn87 induces 20 (41) nm shift. In the absence of any water molecule near the SB region (WS0), the effect of Asn87 is larger by ≈20 nm since it forms a strong hydrogen bond with the SB nitrogen atom (Table 1).
Deprotonated Glu180 shifts the absorption wavelength in all models by more than 100 nm (in the presence and absence of its charge: 490 (476) and 591 (606) nm respectively). When the structures are reoptimized with protonated Glu180, the calculated absorption wavelength (599 nm) is almost equal to the gas-phase value (604 nm). This shows that Glu180 is negatively charged and serves as the main counterion in squid rhodopsin.
The position corresponding to Glu180 is occupied by Glu181 in bovine rhodopsin, and irrespective of its protonation state it was shown to exert a negligible effect on the excitation energy due to the presence of the principal counterion Glu113.[16,37–40] Therefore, despite their bonding schemes (hydrogen-bonded Glu113 and non-hydrogen-bonded Glu180) and position being drastically different, it is remarkable that Glu113 and Glu180 induce a blue shift of over 100 nm in bovine and squid rhodopsins.
The two internal water molecules (W1, W2) induce a 14 nm red shift. Although this shift is analogous to the effect of W2a and W2b in bovine rhodopsin (20 nm),[41] their positions and bonding schemes are also completely different.
CD spectroscopy is a useful tool to monitor the overall shape and absolute conformation of an inherently chiral chromophore. Determination of the absolute sense of twist around the 12s-bond adjacent to the cis–trans isomerization site of the chromophore is critical, since the helicity direction should determine the chromophore movement after photoisomerization.
Experimental and theoretical studies on bovine rhodopsin have shown the out of plane distortion to be negative about the C11–C12 and positive about the C12–C13 bonds.[9,42,43] This pattern is also seen in the higher resolution 2.5 Å X-ray data (−7°, +175°) of squid rhodopsin, but not in the lower resolution (3.7 Å) X-ray structure (+5°, +171°). The QM/MM-optimized geometries are in good agreement with the higher resolution X-ray structure (−17°, +166°). These two dihedral angles impart a positive helicity on the chromophore, yielding a positive rotatory strength (R). The calculated α-band at 490 nm and R value of +0.32 au agree both in sign and magnitude with those determined experimentally (495 nm, +0.20 au).[44] Also we find that half of the calculated rotatory strength arises from the chromophore–protein electrostatic interaction.
In conclusion, the availability of squid rhodopsin crystal structures has opened the way for studying the structure and wavelength selection of PSBR in Gq-coupled GPCRs. The QM/MM calculations on the available X-ray structures of squid rhodopsin have provided additional structural details of the PSBR geometry and its environment. As a first step towards understanding the role of water molecules near the SB region, several conceivable internal water models and their effect on the structural rearrangement and spectral tuning mechanisms are discussed. Although the presence of internal water molecules affect the structures near the SB region, their impact on the absorption maximum is minimal (475±15 nm). Therefore, despite considerable study, it is still quite difficult to judge the reliability of water models using the present X-ray structures.
A negatively charged Glu180 residue situated at ≈5 Å away from the SB region, and which cannot form any hydrogen bonds with the SB nitrogen atom, acts as the principal counterion in squid rhodopsin. In particular, the strong electrostatic interaction between the chromophore and the non-hydrogen-bonded counterion (Glu180) dominates the mechanism of spectral tuning from gas phase to the protein environment. Therefore, compared to bovine and other related retinal proteins, this property merits consideration as the absence of a direct hydorgen-bonding Glu/Asp counterion is critical for differentiating the structure and understanding the wavelength regulation in squid rhodopsin.
Experimental Section
We started from the 2.5 Å crystal structure of squid rhodopsin (pdb code: 2Z73). The details of setup procedure are given in the Supporting Information. Although there is a debate in literature on the protonation state of Glu181 in vertebrate rhodopsins, its analogue in squid rhodopsin (Glu180) is certainly deprotonated as one of its carboxylic oxygen (O) atom forms hydrogen bonds with Tyr190 and Tyr277, whereas the other forms hydrogen bonds with Asn185. The geometries of the protonated and fully optimized structures at AMBER force field level were further refined at a hybrid QM/MM (QM=B3LYP/6-31G*; MM=AMBER96) level.[45,46] The resulting geometries were used to calculate absorption and circular dichroism (CD) spectra with three-root spectroscopy oriented configuration interaction (SORCI) method[47] including +Q Davidson correction for excitations higher than doubles on complete active space self-consistent field (CASSCF) wave function. We employed the 6-31G* basis set throughout the study. The active space encompasses six electrons in six orbitals. Computational efficiency of SORCI+Q calculations was enhanced by setting Tpre, Tnat, and Tsel thresholds to 10−4, 10−6, and 10−6 Eh, respectively. Further details can be found in the Supporting Information and in references [16,17].
Supplementary Material
Acknowledgments
This work at Emory is supported in part by a grant from the National Institutes of Health (R01EY016400-04) and at Kyoto by a Core Research for Evolutional Science and Technology (CREST) grant in the Area of High Performance Computing for Multiscale and Multiphysics Phenomena from JST.
Footnotes
Supporting information for this article is available on the WWW under http://dx.doi.org/10.1002/chem.200903194.
References
- 1.Birge RR. Biochim Biophys Acta. 1990;1016:293–327. doi: 10.1016/0005-2728(90)90163-x. [DOI] [PubMed] [Google Scholar]
- 2.Mathies RA, Lugtenburg J. Molecular Mechanisms of Visual Transduction. Elsevier; Amsterdam: 2000. p. 55. [Google Scholar]
- 3.Gärtner W. Angew Chem. 2001;113:3065–3069. [Google Scholar]; Angew Chem Int Ed. 2001;40:2977–2981. doi: 10.1002/1521-3773(20010817)40:16<2977::AID-ANIE2977>3.0.CO;2-E. [DOI] [PubMed] [Google Scholar]
- 4.Yokoyama S. Prog Ret Eye Res. 2000;19:385–419. doi: 10.1016/s1350-9462(00)00002-1. [DOI] [PubMed] [Google Scholar]
- 5.Briscoe AD, Chittka L. Annu Rev Entomol. 2001;46:471–510. doi: 10.1146/annurev.ento.46.1.471. [DOI] [PubMed] [Google Scholar]
- 6.Hubbard R, St George RCC. J Gen Physiol. 1958;41:501–528. doi: 10.1085/jgp.41.3.501. [DOI] [PMC free article] [PubMed] [Google Scholar]
- 7.Hara T, Hara R, Takeuchi J. Nature. 1967;214:572–573. doi: 10.1038/214572a0. [DOI] [PubMed] [Google Scholar]
- 8.Hara Nishimura I, Kondo M, Nishimura M, Hara R, Hara T. FEBS Lett. 1993;317:5–11. doi: 10.1016/0014-5793(93)81480-n. [DOI] [PubMed] [Google Scholar]
- 9.Okada T, Sugihara M, Bondar AN, Elstner M, Entel P, Buss V. J Mol Biol. 2004;342:571–583. doi: 10.1016/j.jmb.2004.07.044. [DOI] [PubMed] [Google Scholar]
- 10.Shimamura T, Hiraki K, Takahashi N, Hori T, Ago H, Masuda K, Takio K, Ishiguro M, Miyano M. J Biol Chem. 2008;283:17753–17756. doi: 10.1074/jbc.C800040200. [DOI] [PMC free article] [PubMed] [Google Scholar]
- 11.Murakami M, Kouyama T. Nature. 2008;453:363–367. doi: 10.1038/nature06925. [DOI] [PubMed] [Google Scholar]
- 12.Terakita A, Yamashita T, Tachibanaki S, Shichida Y. FEBS Lett. 1998;439:110–114. doi: 10.1016/s0014-5793(98)01340-4. [DOI] [PubMed] [Google Scholar]
- 13.Schertler GFX. Nature. 2008;453:292–293. doi: 10.1038/453292a. [DOI] [PubMed] [Google Scholar]
- 14.Vreven T, Morokuma K. Ann Rep Comp Chem. 2006;2:35–52. [Google Scholar]
- 15.Senn HM, Thiel W. Top Curr Chem. 2007;268:173–290. [Google Scholar]
- 16.Altun A, Yokoyama S, Morokuma K. J Phys Chem B. 2008;112:6814–6827. doi: 10.1021/jp709730b. [DOI] [PMC free article] [PubMed] [Google Scholar]
- 17.Altun A, Yokoyama S, Morokuma K. J Phys Chem B. 2008;112:16883–16890. doi: 10.1021/jp807172h. [DOI] [PMC free article] [PubMed] [Google Scholar]
- 18.Quillin ML, Winfield PT, Mathews BW. Proc Natl Acad Sci USA. 2006;103:19749–19753. doi: 10.1073/pnas.0609442104. [DOI] [PMC free article] [PubMed] [Google Scholar]
- 19.Olano LR, Rick SW. J Am Chem Soc. 2004;126:7991–8000. doi: 10.1021/ja049701c. [DOI] [PubMed] [Google Scholar]
- 20.Angel TE, Chance MR, Palczewski K. Proc Natl Acad Sci USA. 2009;106:8555–8560. doi: 10.1073/pnas.0903545106. [DOI] [PMC free article] [PubMed] [Google Scholar]
- 21.Okada T, Fujiyoshi Y, Silow M, Navarro J, Landau EM, Shichida Y. Proc Natl Acad Sci USA. 2002;99:5982–5987. doi: 10.1073/pnas.082666399. [DOI] [PMC free article] [PubMed] [Google Scholar]
- 22.Yan ECY, Kazmi MA, Ganim Z, Hou JM, Pan D, Chang BSW, Sakmar TP, Mathies RA. Proc Natl Acad Sci USA. 2003;100:9262–9267. doi: 10.1073/pnas.1531970100. [DOI] [PMC free article] [PubMed] [Google Scholar]
- 23.Garczarek F, Gerwert K. Nature. 2006;439:109–112. doi: 10.1038/nature04231. [DOI] [PubMed] [Google Scholar]
- 24.Muneda N, Shibata M, Demura M, Kandori H. J Am Chem Soc. 2006;128:6294–6295. doi: 10.1021/ja060253d. [DOI] [PubMed] [Google Scholar]
- 25.Luecke H, Schobert B, Stagno J, Imasheva ES, Wang JM, Balashov SP, Lanyi JK. Proc Natl Acad Sci USA. 2008;105:16561–16565. doi: 10.1073/pnas.0807162105. [DOI] [PMC free article] [PubMed] [Google Scholar]
- 26.Vanni S, Neri M, Tavernelli I, Rothilsberger U. Biochemistry. 2009;48:4789–4797. doi: 10.1021/bi900299f. [DOI] [PubMed] [Google Scholar]
- 27.Ota T, Furutani Y, Terakita A, Yoshinori S, Kandori H. Biochemistry. 2006;45:2845–2851. doi: 10.1021/bi051937l. [DOI] [PubMed] [Google Scholar]
- 28.Dähne L, Grahn W, Jones PG, Chrapkowski A. Z Kristallogr. 1994;209:514–516. [Google Scholar]
- 29.Buss V, Schreiber M, Fülscher MP. Angew Chem. 2001;113:3284–3286. doi: 10.1002/1521-3773(20010903)40:17<3189::AID-ANIE3189>3.0.CO;2-E. [DOI] [PubMed] [Google Scholar]; Angew Chem Int Ed. 2001;40:3189–3190. doi: 10.1002/1521-3773(20010903)40:17<3189::AID-ANIE3189>3.0.CO;2-E. [DOI] [PubMed] [Google Scholar]
- 30.Hoffmann M, Wanko M, Strodel P, Kçnig PH, Frauenheim T, Schulten K, Thiel W, Tajkhorshid E, Elstner M. J Am Chem Soc. 2006;128:10808–10818. doi: 10.1021/ja062082i. [DOI] [PubMed] [Google Scholar]
- 31.Andersen LH, Nielsen IB, Kristensen MB, El Ghazaly MOA, Haake S, Brondsted Nielsen M, Petersen MA. J Am Chem Soc. 2005;127:12347–12350. doi: 10.1021/ja051638j. [DOI] [PubMed] [Google Scholar]
- 32.Nielsen IB, Lammich L, Andersen LH. Phys Rev Lett. 2006;96:018304–4. doi: 10.1103/PhysRevLett.96.018304. [DOI] [PubMed] [Google Scholar]
- 33.Sekharan S, Weingart O, Buss V. Biophys J. 2006;91:L7–L9. doi: 10.1529/biophysj.106.087122. [DOI] [PMC free article] [PubMed] [Google Scholar]
- 34.Gasc+n JA, Sproviero EM, Batista VS. Acc Chem Res. 2006;39:184–193. doi: 10.1021/ar050027t. [DOI] [PubMed] [Google Scholar]
- 35.Sekharan S, Sugihara M, Buss V. Angew Chem. 2007;119:273–275. doi: 10.1002/anie.200603306. [DOI] [PubMed] [Google Scholar]; Angew Chem Int Ed. 2007;46:269–271. [Google Scholar]
- 36.Sekharan S, Sugihara M, Weingart O, Okada T, Buss V. J Am Chem Soc. 2007;129:1052–1054. doi: 10.1021/ja066970p. [DOI] [PubMed] [Google Scholar]
- 37.Terakita A, Yamashita T, Shichida Y. Proc Natl Acad Sci USA. 2000;97:14263–14267. doi: 10.1073/pnas.260349597. [DOI] [PMC free article] [PubMed] [Google Scholar]
- 38.Teratkita A, Koyanagi M, Tsukamoto H, Yamashita T, Miyata T, Shichida Y. Nat Struct Biol. 2004;11:284–289. doi: 10.1038/nsmb731. [DOI] [PubMed] [Google Scholar]
- 39.Kusnetzow AK, Dukkipati A, Babu KR, Ramos L, Knox BE, Birge RR. Proc Natl Acad Sci USA. 2004;101:941–946. doi: 10.1073/pnas.0305206101. [DOI] [PMC free article] [PubMed] [Google Scholar]
- 40.Sekharan S, Buss V. J Am Chem Soc. 2008;130:17220–17221. doi: 10.1021/ja805992d. [DOI] [PubMed] [Google Scholar]
- 41.Sekharan S. Photochem Photobiol. 2009;85:517–520. doi: 10.1111/j.1751-1097.2008.00499.x. [DOI] [PubMed] [Google Scholar]
- 42.Buss V, Kolster K, Terstegen F, Vahrenhorst R. Angew Chem. 1998;110:1997–2000. [Google Scholar]; Angew Chem Int Ed. 1998;37:1893–1895. [Google Scholar]
- 43.Fujimoto Y, Fishkin N, Pescitelli G, Decatur J, Berova N, Nakanishi K. J Am Chem Soc. 2002;124:7294–7302. doi: 10.1021/ja020083e. [DOI] [PubMed] [Google Scholar]
- 44.Shichida S, Tokunaga F, Yoshizawa T. Biochim Biophys Acta Bioenerg. 1978;504:413–430. doi: 10.1016/0005-2728(78)90064-6. [DOI] [PubMed] [Google Scholar]
- 45.Lee C, Yang W, Parr RG. Phys Rev B. 1988;37:785–789. doi: 10.1103/physrevb.37.785. [DOI] [PubMed] [Google Scholar]
- 46.Cornell WD, Cieplak P, Bayly CI, Gould IR, Merz KM, Ferguson DM, Spellmeyer DC, Fox T, Caldwell JW, Kollman PA. J Am Chem Soc. 1995;117:5179–5197. [Google Scholar]
- 47.Neese F. J Chem Phys. 2003;119:9428–9443. [Google Scholar]
Associated Data
This section collects any data citations, data availability statements, or supplementary materials included in this article.