

Abstract
Objectives
The public health implications of regional variation in incidence and outcome of severe traumatic injury remain to be analyzed. The objective of this study was to determine whether the incidence and outcome associated with severe traumatic injury differs across geographic regions of North America.
Methods
A prospective, observational study was conducted of the Resuscitation Outcomes Consortium of all patients in 9 North American sites (6 US and 3 Canadian) sustaining severe traumatic injury from April 1, 2006 to March 31, 2007 followed to hospital discharge. Eligible patients were assessed by organized emergency medical services, and had field-based physiologic criteria including systolic blood pressure ≤90 mm Hg, Glasgow Coma Scale score ≤12, respiratory rate <10 or >29 per minute, advanced airway procedure, or traumatic death in the field. Census data were used to determine rates adjusted for age and sex. The main outcome measures were incidence rate, mortality rate, case fatality rate, and survival to discharge for patients sustaining severe traumatic injury assessed by EMS.
Results
The total catchment population of 20.5 million yielded 7080 cases of severe traumatic injury. Median age was 36 years and 67% were male. The median incidence of EMS-assessed severe traumatic injury per 100,000 population across sites was 37.4 (interquartile range [IQR] = 24.6 – 69.6); survival ranged from 39.8% to 80.8%, with a median of 64.5% (IQR = 55.5–78.4). About 942 cases were pronounced dead at the scene and 5857 patients were transported to hospital; 4477 (63.2%) were discharged alive. The median incidence of severe trauma due to a blunt mechanism, transported to hospital, was 25.8 (IQR = 13.1–44.3); survival ranged from 52.6% to 87.3%, with a median of 78.0% (IQR = 68.4–83.5). The median incidence of severe penetrating trauma, transported to hospital, was 2.6 (IQR = 1.5–10.4); survival ranged from 37.5% to 84.7%, with a median of 67.5% (IQR = 54.1–75.9). All P values for differences across sites for incidence and survival were <0.001.
Conclusions
In this study involving 9 geographic regions in North America, there were significant and important regional differences in severe traumatic injury, incidence, and outcome. These differences were sustained for patients with either isolated blunt or penetrating injury mechanisms.
The consequences of injury remain a major public health problem. According to the CDC,1 in 2004 more than 167,000 deaths resulted from injury. In addition, 1.9 million hospitalizations and over 65 million initial visits to emergency departments or physicians offices were attributable to injury. This resulted in more than $400 billion for the combined economic burden of medical treatment and lost productivity. The incidence and outcome of severe traumatic injury is not well characterized. Overall outcome varies, dependent on age, sex, race/ethnicity, and relative percentage of different mechanism of injury types of the population.1
Accurate estimation of the burden of severe traumatic injury is essential to evaluate progress of injury prevention programs. While existing national hospital-based statistics are essential, they do not provide insight into severe injury where the greatest burden for morbidity and mortality originates. Knowledge of regional variation in outcomes from severe traumatic injury could guide identification of effective interventions that are used in some communities, but not in others. Potential interventions include culturally-appropriate injury prevention initiatives, community support, and equitable access to high quality prehospital and hospital emergency care.
The Resuscitation Outcomes Consortium (ROC) is a clinical research network, conducting prehospital studies in the areas of cardiopulmonary arrest and severe traumatic injury. The network consists of 11 sites and 1 central coordinating center. The ROC was established to evaluate the treatment of life-threatening injury or out-of-hospital cardiac arrest, and conduct clinical trials of promising scientific and clinical advances to improve resuscitation outcomes. A registry (ROC Epistry-Trauma) was created by this consortium, which includes all severe traumatic injury assessed or treated by emergency medical services (EMS) personnel in participating geographic regions. The objective of this study was to analyze regional variation in the incidence and outcome of severe traumatic injury.
METHODS
Design and Setting
The ROC Epistry-Trauma is a prospective multicenter observational registry of severe traumatic injury in EMS agencies and receiving institutions in 8 US sites and 3 Canadian sites.2 These sites are participants in the ROC clinical research network. Two sites which self-reported incomplete case capture (San Diego, CA; Milwaukee, WI) were excluded from all analyses.
Population
The population of interest was all severe traumatic injury cases that occurred within the catchment area of a participating EMS agency, including infants, children, and adults. The census tract of the location of the case was recorded to assess the catchment population served by the agency using census data. Subgroups of the cohort included all EMS-assessed severe traumatic injury, EMS-transported severe traumatic injury, EMS-transported severe traumatic injury due to any blunt mechanism, and EMS-transported severe traumatic injury due to any penetrating mechanism.
Inclusion Criteria
Included were cases of severe traumatic injury, which were assessed by organized EMS personnel and: (a) were pronounced dead at the scene either with or without attempted resuscitation; or (b) were transported to a trauma receiving institution; or (c) were treated and released at the scene or refused transport by EMS. Severe traumatic injury followed the American College of Surgeons Committee on Trauma (ACSCOT) major trauma triage guidelines and was defined as: (a) any abnormal vital sign to include systolic blood pressure ≤ 90 mm Hg, or respiratory rate <10 or >29 breaths per minute; (b) Glasgow Coma Scale score ≤12; (c) any patient with field intubation; and (d) any patient pronounced dead in the field.3
Data Management and Quality Assurance
Each site used multiple strategies to identify consecutive cases of severe traumatic injury. Examples of case identification strategies included regular hand sorting through paper EMS charts, or electronic queries of EMS records by a variety of data fields; ie, dispatch call type, vital signs, diagnosis, or a combination of these fields.
Data were abstracted from EMS and hospital records using standardized definitions for patient characteristics, EMS process and outcome at hospital discharge. Data were abstracted locally, coded without personal health information and transmitted to the data coordinating center by web entry of individual cases or batch upload of multiple cases grouped together. Site-specific quality assurance included initial and continuing education of EMS providers in data collection. The data coordinating center assured the quality of the data by (a) using range and logic checks in the web-based data entry forms and the batch upload process, (b) systematic review of data to uncover inconsistencies, (c) review of randomly selected records to confirm accuracy of data entry, and (d) annual site visits.
Outcome Measures
The annual incidence was calculated per 100,000 population for the 12 month period of April 1, 2006 to March 31, 2007. The incidence rate in persons of any age was adjusted for age and sex to those of the 2000 census for the United States and 2001 census for Canada. The mortality rate was calculated as the number of known deaths per population using similar methods. The case fatality rate was calculated as the number of known deaths divided by the total number of cases including those with missing vital status. The survival rate was calculated as the number of known survivors divided by the total number of cases, including those with missing final vital status. Note that case fatality and survival rate would only sum to 100% if final vital status were known for all patients.
Survival to discharge was defined as discharge alive from hospital after the index injury. Patients who were transferred to another acute care facility (eg, to undergo a higher level of trauma care) were considered to be still hospitalized. Patients transferred to a nonacute ward or rehabilitation facility were considered discharged.
Statistical Analysis
We were aware before study implementation that the use of the prehospital emergency care record to abstract data for inclusion in the study databases could be associated with incomplete data due to the need for rapid treatment in the field and consequent lack of time for EMS providers to complete the record. A common approach to accounting for such unobserved data is to use multivariate analysis to describe observed outcomes as a function of covariates based on cases with complete data. Then outcomes are estimated for cases with incomplete data. However, this method underestimates uncertainty.4 Instead missing cases were accounted for by using multiple imputation methods.5–7 Estimated expected cases for agency by month were determined by averaging observed cases in an agency by month based on March 2006 to February 2007 data. We assumed an agency was missing cases if the observed rate was “much” less than expected average (P < 0.005), especially at the start of the enrollment period and at the end of the reporting year. A Poisson regression model was used within each site to estimate the expected incidence m for each month with underreported episodes for each agency. For each of 10 imputed datasets, a random draw from a Poisson distribution with mean m was used to impute the number of missing cases. For each such missing case, covariate values were then obtained through hot deck imputation using valid cases from months with good data at the corresponding agency.6
The baseline characteristics of EMS systems and the EMS performance on cases were summarized by using categorical and parametric or nonparametric descriptors as appropriate. These were reported by site. Imputation was performed by using Excel (Microsoft Corporation, Redmond, WA) Statistical analyses were performed by using S-PLUS 6.2 (TIBCO Software Inc, Palo Alto, CA). Differences in rates between sites were assessed by χ2 tests.
Human Subjects
The study was approved under waiver of documented written consent under minimal risk criteria by 74 US institutional review boards and 34 Canadian research ethics boards as well as 26 EMS institutional review boards. In addition, approval in the form of a memorandum of understanding was obtained from 24 hospitals and from 94 EMS systems.
RESULTS
Nine sites were included (Table 1). The median catchment population was 1,751,119 (interquartile range [IQR] = 975,657–3,405,034) with a median population density of 485 (IQR = 392–1589) individuals per square mile. 172 EMS agencies participating in the consortium treated patients included in this analysis. Air transports were included only if the patient was injured within the catchment area. Air transports from outside the catchment area arriving at participating hospitals were not included in this analysis. Patients were transported to a total of 192 receiving hospitals within the catchment area of participating sites.
TABLE 1.
Characteristics of Included Sites
| Site | Service Area Population | Population Density (Residents/Square Mile) | No. EMS Agencies | No. Hospitals |
|---|---|---|---|---|
| Alabama | 644,701 | 485 | 13 | 14 |
| Dallas, TX | 1,989,357 | 3173 | 11 | 22 |
| Iowa | 1,015,347 | 388 | 19 | 19 |
| Ottawa-OPALS, ON | 4,030,696 | 314 | 39 | 37 |
| Pittsburgh, PA | 935,967 | 396 | 6 | 38 |
| Portland, OR | 1,751,119 | 431 | 15 | 16 |
| Seattle-King County, WA | 1,666,978 | 1573 | 35 | 18 |
| Toronto, ON | 5,627,021 | 911 | 32 | 55 |
| Vancouver, BC | 2,779,373 | 1604 | 39 | 33 |
| Total | 20,458,559 | 640 | 209 | 252 |
EMS indicates emergency medical services.
The total catchment population was 20.5 million (Fig. 1). There were 7080 cases of severe traumatic injury assessed by EMS. Of these, 6913 (97.6% of total) were observed and 167 (2.4%) were imputed. These imputed cases were distributed among 44 agencies (25.6% of total) across all sites. Resuscitation was attempted in 6200 (87.6% of total). Of these, 5857 (82.7%) were transported to a consortium hospital, 942 (13.3%) died at the scene, 281 (4.0%) were alive at the scene and were not transported, and 4477 (63.2% of total) were known discharged alive.
FIGURE 1.
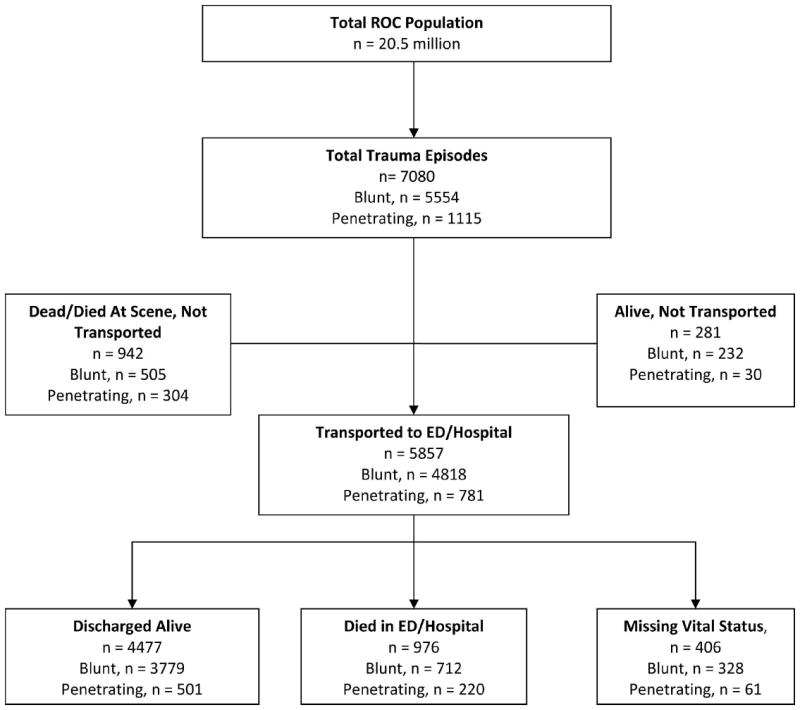
Patient flow based on Utstein template for out-of-hospital traumatic injury.
The patients and EMS characteristics of all cases assessed and transported are shown in Tables 2 to 4. EMS-assessed severe traumatic injury patients had a median age of 36 years (IQR = 23, 55; Table 2). There were no differences in age of those pronounced dead at the scene and those transported to hospital (P = 0.23). Males were more likely to sustain any mechanism of injury than females. Blunt mechanisms accounted for the majority of severe trauma (78.4%). Injuries related to moving vehicles and falls accounted for the majority of all blunt mechanism injuries. Firearm injuries and piercing/stabbing injuries accounted for almost 90% of penetrating injuries. Wide variability in injury mechanism in EMS-assessed patients was noted across sites with the proportion of motor vehicle occupant injury ranging from 15.2% in Toronto to 45.3% in Alabama. Conversely, fall proportion ranged from 6.4% in Alabama to 49.2% in Toronto. Of the 942 patients pronounced dead at the scene and not transported, 798 received no attempts at resuscitation upon EMS arrival. The proportion of patients pronounced dead in the field ranged from 5.5% in Seattle to 21.8% in Vancouver.
TABLE 2.
Patient and EMS Characteristics: All EMS-Assessed Injury
| Alabama | Dallas | Iowa | Ottawa-OPALS | Pittsburgh | Portland | Seattle–King County | Toronto | Vancouver | ROC Total | |
|---|---|---|---|---|---|---|---|---|---|---|
| N | 486 | 911 | 387 | 653 | 476 | 331 | 1633 | 1707 | 496 | 7080 |
| Age, median (IQR) | 34 (25) | 33 (25) | 40 (39) | 38 (36) | 31 (30) | 36 (32) | 34 (31) | 43 (47) | 37 (28) | 36 (32) |
| Gender: % male | 72.2 | 74.3 | 65.6 | 67.8 | 64.5 | 72.8 | 66.6 | 60.9 | 73.8 | 67.3 |
| Injury type | ||||||||||
| Blunt | 64.0% | 52.4% | 75.5% | 70.9% | 60.3% | 79.5% | 64.2% | 82.0% | 55.4% | 78.4% |
| Penetrating | 18.3% | 17.1% | 6.7% | 10.3% | 17.0% | 7.9% | 12.4% | 4.4% | 11.7% | 15.7% |
| Injury mechanism | ||||||||||
| Motorvehicle occupant | 45.3% | 26.3% | 19.4% | 24.2% | 25.6% | 15.4% | 20.2% | 15.2% | 35.3% | 23.0% |
| Motorcyclist | 4.7% | 2.6% | 2.6% | 3.7% | 3.8% | 4.5% | 3.3% | 1.9% | 6.5% | 3.3% |
| Pedestrian | 5.8% | 5.6% | 4.4% | 7.2% | 5.3% | 9.7% | 6.0% | 4.8% | 13.5% | 6.3% |
| Fall | 6.4% | 18.6% | 39.5% | 31.2% | 24.6% | 36.0% | 35.7% | 49.2% | 13.3% | 32.2% |
| Other blunt mechanism | 7.0% | 9.2% | 15.5% | 16.7% | 12.2% | 18.7% | 11.9% | 2.4% | 10.9% | 9.8% |
| Cut/pierce/stab | 4.3% | 5.4% | 4.4% | 9.3% | 2.7% | 3.9% | 7.0% | 3.6% | 7.1% | 5.4% |
| Gunshot | 16.7% | 22.4% | 5.2% | 2.6% | 21.4% | 5.1% | 8.1% | 2.6% | 8.5% | 9.4% |
| Other mechanism | 1.4% | 6.8% | 6.2% | 2.3% | 4.0% | 3.9% | 5.0% | 19.4% | 2.4% | 8.0% |
| No/missing mechanism | 14.0% | 3.2% | 3.1% | 2.8% | 0.4% | 2.4% | 2.8% | 0.9% | 2.4% | 2.6% |
| Field characteristics | ||||||||||
| SBP ≤90 | 33.7% | 38.9% | 22.2% | 31.7% | 48.5% | 15.1% | 37.5% | 49.6% | 39.7% | 38.8% |
| RR <10 or >29 | 23.3% | 17.0% | 41.6% | 22.2% | 27.5% | 28.1% | 30.5% | 20.2% | 44.0% | 26.3% |
| Advanced airway | 17.1% | 13.2% | 7.0% | 13.9% | 8.6% | 23.0% | 29.6% | 3.9% | 36.7% | 16.5% |
| GCS ≤12 | 65.8% | 54.2% | 45.7% | 51.3% | 35.5% | 74.3% | 33.0% | 40.7% | 64.5% | 46.5% |
| Dead on arrival | 15.0% | 19.5% | 8.5% | 14.5% | 16.2% | 7.3% | 5.5% | 7.0% | 21.8% | 11.3% |
EMS indicates emergency medical service; IQR, interquartile range; SBP, systolic blood pressure; RR, respiratory rate; GCS, Glasgow Coma Score; ET, endotracheal tube.
TABLE 4.
Patient and EMS Characteristics: Transported Penetrating Traumatic Injury
| Alabama | Dallas | Iowa | Ottawa-OPALS | Pittsburgh | Portland | Seattle–King County | Toronto | Vancouver | ROC Total | |
|---|---|---|---|---|---|---|---|---|---|---|
| N | 89 | 156 | 26 | 67 | 81 | 26 | 202 | 75 | 58 | 781 |
| Age, median (IQR) | 30 (21) | 30 (21) | 30 (30) | 37 (22) | 25 (14) | 27 (32) | 28 (17) | 23 (9) | 27 (20) | 28 (18) |
| Gender: % male | 84.3 | 82.7 | 80.8 | 77.6 | 87.7 | 80.8 | 82.7 | 88.0 | 94.8 | 84.3 |
| Injury mechanism | ||||||||||
| Cut/pierce/stab | 22.5% | 22.4% | 46.2% | 88.1% | 13.6% | 38.5% | 48.0% | 57.3% | 50.0% | 40.7% |
| Gunshot | 71.9% | 72.4% | 34.6% | 4.5% | 71.6% | 30.8% | 40.1% | 29.3% | 37.9% | 48.7% |
| Other mechanism | 0.0% | 1.3% | 0.0% | 0.0% | 3.7% | 0.0% | 5.9% | 12.0% | 0.0% | 3.3% |
| Field characteristics | ||||||||||
| SBP ≤90 | 65.2% | 66.7% | 34.6% | 58.2% | 72.8% | 19.2% | 38.6% | 78.7% | 60.3% | 57.1% |
| RR <10 or >29 | 37.1% | 26.3% | 61.5% | 31.3% | 43.2% | 46.2% | 26.7% | 32.0% | 53.4% | 55.5% |
| Advanced airway | 20.2% | 28.2% | 19.2% | 10.4% | 12.3% | 34.6% | 58.4% | 20.0% | 46.6% | 32.5% |
| GCS ≤12 | 59.6% | 62.2% | 46.2% | 38.8% | 48.1% | 73.1% | 29.2% | 37.3% | 63.8% | 47.2% |
| Transport type | ||||||||||
| Ground | 89.9% | 98.1% | 100.0% | 100.0% | 95.1% | 100.0% | 97.5% | 100.0% | 96.6% | 97.1% |
| Air | 10.1% | 1.9% | 0.0% | 0.0% | 4.9% | 0.0% | 2.5% | 0.0% | 3.4% | 2.9% |
| Advanced airway | ||||||||||
| Oral/nasal ET | 29.2% | 23.7% | 19.2% | 10.4% | 18.5% | 38.5% | 56.9% | 21.3% | 46.6% | 33.2% |
| Cricothyrotomy | 0.0% | 0.6% | 7.7% | 0.0% | 0.0% | 0.0% | 1.0% | 0.0% | 1.7% | 0.8% |
| Other | 0.0% | 4.5% | 0.0% | 0.0% | 6.2% | 26.9% | 41.1% | 0.0% | 0.0% | 13.1% |
| None | 70.8% | 73.1% | 73.1% | 89.6% | 79.0% | 61.5% | 41.1% | 78.7% | 51.7% | 64.9% |
| Paralyzed/sedated | 1.1% | 0.0% | 0.0% | 0.0% | 2.5% | 15.4% | 32.2% | 0.0% | 19.0% | 10.6% |
| Hemorrhage control | 48.3% | 17.3% | 61.5% | 65.7% | 24.7% | 7.7% | 30.7% | 26.7% | 48.3% | 33.5% |
EMS indicates emergency medical service; IQR, interquartile range; SBP, systolic blood pressure; RR, respiratory rate; GCS, Glasgow Coma Score; ALS, advanced life support; ET, endotracheal tube.
Field characteristics that met severe trauma inclusion criteria are also shown in Table 2. Altered mental status, defined as GCS score ≤12 was a common finding and occurred in a low of 35.5% of patients in Pittsburgh to a high of 74.3% of patients in Portland. Shock, defined as systolic blood pressure ≤90 mm Hg, was present in a range of 15.1% in Portland to a high of 49.6% in Toronto. For transported blunt (Table 3) and penetrating (Table 4) mechanism patients, respiratory distress, defined as respiratory rate <10 or >29, was a common presenting sign; however, a wide range existed in the proportion of patients receiving an advanced airway and chemical paralysis or sedation across sites. Not surprising, a higher proportion of patients in the penetrating mechanism group required efforts aimed at hemorrhage control. Time from dispatch to ALS arrival was similar across groups and was not different between those dead at the scene and those transported to hospital (data not shown, P = 0.79).
TABLE 3.
Patient and EMS Characteristics: Transported Blunt Traumatic Injury
| Alabama | Dallas | Iowa | Ottawa-OPALS | Pittsburgh | Portland | Seattle–King County | Toronto | Vancouver | ROC Total | |
|---|---|---|---|---|---|---|---|---|---|---|
| N | 311 | 477 | 292 | 463 | 287 | 263 | 1049 | 1400 | 275 | 4818 |
| Age, median (IQR) | 35 (26) | 35 (27) | 41 (43) | 37 (39) | 35 (35) | 38 (31) | 38 (36) | 45 (49) | 37 (26) | 39 (36) |
| Gender: % male | 70.1 | 71.3 | 62.0 | 65.2 | 54.7 | 71.1 | 63.5 | 58.1 | 70.2 | 63.4 |
| Injury mechanism | ||||||||||
| Motorvehicle occupant | 66.2% | 40.9% | 20.2% | 24.0% | 34.5% | 17.1% | 27.1% | 13.8% | 39.6% | 27.0% |
| Motorcyclist | 6.8% | 4.2% | 2.7% | 4.8% | 4.5% | 4.9% | 4.6% | 1.9% | 9.8% | 4.2% |
| Pedestrian | 7.4% | 8.4% | 4.8% | 9.7% | 7.7% | 11.0% | 8.2% | 5.2% | 21.1% | 8.1% |
| Fall | 9.3% | 30.2% | 49.7% | 41.7% | 35.9% | 42.2% | 44.3% | 56.2% | 15.3% | 41.9% |
| Other blunt mechanism | 9.0% | 14.3% | 19.5% | 19.2% | 16.4% | 19.0% | 13.5% | 2.9% | 12.0% | 11.5% |
| Field characteristics | ||||||||||
| SBP ≤90 | 31.5% | 39.2% | 21.6% | 35.0% | 53.0% | 14.4% | 39.6% | 52.4% | 41.1% | 40.7% |
| RR <10 or >29 | 24.4% | 18.4% | 42.5% | 24.8% | 30.3% | 27.4% | 31.3% | 19.4% | 49.1% | 26.9% |
| Advanced airway | 19.6% | 13.0% | 5.5% | 16.2% | 10.5% | 23.2% | 31.3% | 3.3% | 45.5% | 16.7% |
| GCS ≤12 | 82.6% | 74.2% | 50.7% | 64.6% | 43.6% | 82.5% | 40.6% | 45.6% | 82.9% | 55.9% |
| Transport type | ||||||||||
| Ground | 73.3% | 96.2% | 100.0% | 97.6% | 80.8% | 94.7% | 94.9% | 98.3% | 86.2% | 93.8% |
| Air | 26.7% | 3.8% | 0.0% | 2.4% | 19.2% | 5.3% | 5.1% | 1.7% | 13.8% | 6.2% |
| Advanced airway | ||||||||||
| Oral/nasal ET | 21.2% | 12.2% | 6.5% | 18.8% | 15.3% | 24.3% | 31.8% | 3.2% | 46.9% | 17.5% |
| Cricothyrotomy | 0.0% | 0.2% | 0.0% | 0.0% | 0.0% | 0.0% | 0.0% | 0.0% | 0.0% | 0.0% |
| Other | 0.3% | 2.7% | 3.1% | 0.4% | 9.1% | 19.0% | 19.5% | 0.3% | 1.1% | 6.5% |
| None | 78.5% | 85.5% | 92.5% | 81.4% | 83.6% | 75.3% | 67.9% | 96.6% | 52.7% | 81.9% |
| Paralyzed/sedated | 4.8% | 0.2% | 1.4% | 0.2% | 4.2% | 9.5% | 10.4% | 0.2% | 24.0% | 4.9% |
| Hemorrhage control | 17.0% | 3.6% | 13.0% | 14.7% | 4.2% | 1.5% | 11.9% | 9.6% | 16.0% | 10.3% |
EMS indicates emergency medical service; IQR, interquartile range; SBP, systolic blood pressure; RR, respiratory rate; GCS, Glasgow Coma Score; ET, endotracheal tube.
EMS-assessed severe traumatic injury incidence and outcome are described in Table 5. There were 7080 EMS-assessed severe traumatic injuries during 20.5 million person-years of observation, resulting in an unadjusted incidence of EMS-assessed severe traumatic injury of 34.5 per 100,000 person years. The adjusted incidence per 100,000 census population ranged from 14.3 to 95.3 (median = 37.4, IQR = 24.6–69.6). The adjusted mortality rate per 100,000 census population ranged from 3.8 to 29.2 (median = 7.6, IQR = 5.2–16.2). The known case fatality rate ranged from 13.7% to 50.7% (median = 26.1%, IQR = 18.6%–38.3%). The known survival to discharge ranged from 39.8% to 80.8% (median = 64.5%, IQR = 55.5%–78.4%). The proportion of patients with vital status missing ranged from 2.3% to 12.5% (median = 5.7%, IQR = 3.0%–9.0%). All P values for differences across sites were <0.001.
TABLE 5.
Incidence and Outcome of EMS-Assessed Out-of-Hospital Traumatic Injury
| Site Identity | Alabama N = 486 | Dallas N = 911 | Iowa N = 387 | Ottawa-OPALS N = 653 | Pittsburgh N = 476 | Portland N = 331 | Seattle–King County N = 1633 | Toronto N = 1707 | Vancouver N = 496 | Overall N = 7080 | P |
|---|---|---|---|---|---|---|---|---|---|---|---|
| Adjusted incidence rate, per 100,000 | 88.8 | 45.4 | 37.4 | 15.2 | 50.4 | 18.3 | 95.3 | 30.8 | 14.3 | 33.6 | <0.001 |
| Adjusted mortality rate, per 100,000 | 29.2 | 19.2 | 7.6 | 5.2 | 13.1 | 3.8 | 13.1 | 5.2 | 7.3 | 8.5 | <0.001 |
| Case fatality rate, % | 32.9% | 42.2% | 20.3% | 34.3% | 26.1% | 20.6% | 13.7% | 16.9% | 50.7% | 25.2% | <0.001 |
| Survival to discharge, % | 64.5% | 49.5% | 71.3% | 62.0% | 61.4% | 76.1% | 80.6% | 80.8% | 39.8% | 69.3% | <0.001 |
| Vital status missing, % | 2.6% | 8.3% | 8.4% | 3.6% | 12.5% | 3.3% | 5.7% | 2.3% | 9.5% | 5.5% | <0.001 |
After excluding those dead at the scene as well as those alive, not transported, EMS-assessed severe traumatic injury transported to an ED or hospital are described in Table 6. There were 5857 severe traumatic injuries transported; the adjusted incidence per 100,000 census population ranged from 11.0 to 78.6 (median = 27.7, IQR = 14.1–43.4). The adjusted mortality rate ranged from 2.5 to 16.3 (median = 3.9, IQR = 3.1–7.0). The survival rate to hospital discharge per 100,000 census population ranged from 51.9% to 86.2% (median = 75.4%, IQR = 69.6%–81.6%). All P values for differences across sites were <0.001.
TABLE 6.
Incidence and Outcome of EMS Transported Traumatic Injury
| Site Identity | Alabama N = 410 | Dallas N = 690 | Iowa N = 341 | Ottawa-OPALS N = 538 | Pittsburgh N = 393 | Portland N = 299 | Seattle–King County N = 1335 | Toronto N = 1509 | Vancouver N = 342 | Overall N = 5857 | P |
|---|---|---|---|---|---|---|---|---|---|---|---|
| Adjusted incidence rate, per 100,000 | 75.9 | 34.8 | 32.9 | 13.1 | 43.4 | 16.8 | 78.6 | 27.7 | 11.0 | 14.1 | <0.001 |
| Adjusted mortality rate, per 100,000 | 16.3 | 10.4 | 3.5 | 3.1 | 6.9 | 2.5 | 7.0 | 3.1 | 3.9 | 3.0 | <0.001 |
| Case fatality rate, % | 21.5% | 29.9% | 10.6% | 23.9% | 15.9% | 14.8% | 8.9% | 11.3% | 35.8% | 21.5% | <0.001 |
| Survival to discharge, % | 75.4% | 59.3% | 79.9% | 71.9% | 69.6% | 81.6% | 84.3% | 86.2% | 51.9% | 75.5% | <0.001 |
| Vital status missing, % | 3.1% | 10.9% | 9.5% | 4.2% | 14.5% | 3.6% | 6.9% | 2.5% | 12.4% | 3.0% | <0.001 |
EMS-transported severe traumatic injury due to blunt mechanisms is described in Table 7. The unadjusted incidence of severe trauma secondary to blunt mechanism was 23.5 per 100,000 person years. The adjusted incidence per 100,000 census population ranged from 8.8 to 62.3 (median = 25.8, IQR = 13.1– 44.3). The adjusted mortality rate per 100,000 census population ranged from 2.0 to 10.7 (median = 3.2, IQR = 2.5–5.8). The known case fatality rate ranged from 8.3% to 36.3% (median = 13.6%, IQR = 9.7%–24.3%). The known survival to discharge ranged from 52.6% to 87.3% (median = 78.0%, IQR = 68.4%– 83.5%). The proportion of patients with vital status missing ranged from 2.4% to 15.7% (median = 7.2%, IQR = 3.4%–10.7%). All P values for differences across sites were <0.001. Further subgroup analysis was performed for motor vehicle injuries and falls individually. Similar ranges in incidence, mortality, and case fatality as well as survival to discharge were noted.
TABLE 7.
Incidence and Outcome of Transported Blunt Injury
| Site Identity
|
P | ||||||||||
|---|---|---|---|---|---|---|---|---|---|---|---|
| Alabama | Dallas | Iowa | Ottawa-OPALS | Pittsburgh | Portland | Seattle–King County | Toronto | Vancouver | ROC Total | ||
| All patients, N | 311 | 477 | 294 | 463 | 287 | 263 | 1049 | 1400 | 274 | 4818 | |
| Adjusted incidence rate | 57.4 | 24.5 | 28.1 | 11.3 | 31.2 | 14.8 | 62.3 | 25.8 | 8.8 | 23.5 | <0.001 |
| Adjusted mortality rate | 10.7 | 5.9 | 2.3 | 2.8 | 3.6 | 2.0 | 5.7 | 2.7 | 3.2 | 3.5 | <0.001 |
| Case fatality rate | 18.6% | 24.0% | 8.3% | 24.5% | 11.5% | 13.6% | 9.1% | 10.3% | 36.3% | 14.8% | <0.001 |
| Survival to discharge | 78.0% | 65.8% | 80.6% | 70.9% | 72.9% | 83.1% | 83.8% | 87.3% | 52.6% | 78.9% | <0.001 |
| Vital status missing | 3.4% | 10.2% | 11.1% | 4.6% | 15.7% | 3.3% | 7.2% | 2.4% | 11.1% | 6.3% | <0.001 |
| Motor vehicle crash, N | 236 | 229 | 80 | 163 | 131 | 94 | 367 | 261 | 155 | 1716 | |
| Adjusted incidence rate | 43.6 | 10.9 | 8.0 | 3.9 | 14.6 | 5.1 | 20.5 | 4.6 | 4.9 | 8.1 | <0.001 |
| Adjusted mortality rate | 8.1 | 3.3 | 0.6 | 1.2 | 1.7 | 0.9 | 2.2 | 0.7 | 1.4 | 1.5 | <0.001 |
| Case fatality rate | 18.6% | 30.3% | 7.4% | 30.8% | 11.8% | 17.2% | 10.6% | 15.0% | 29.4% | 18.7% | <0.001 |
| Survival to discharge | 77.2% | 61.3% | 88.1% | 65.4% | 71.9% | 79.6% | 83.9% | 82.6% | 57.8% | 74.9% | <0.001 |
| Falls, N | 29 | 145 | 150 | 194 | 112 | 116 | 484 | 788 | 43 | 2061 | |
| Adjusted incidence rate | 5.3 | 8.5 | 13.7 | 4.9 | 11.6 | 6.7 | 30.5 | 14.9 | 1.5 | 10.3 | <0.001 |
| Adjusted mortality rate | 1.7 | 1.3 | 1.0 | 0.8 | 0.9 | 0.8 | 2.3 | 1.6 | 0.7 | 1.2 | <0.001 |
| Case fatality rate | 31.0% | 15.5% | 7.2% | 16.7% | 7.9% | 12.0% | 7.7% | 10.5% | 45.0% | 11.4% | <0.001 |
| Survival to discharge | 66.1% | 75.2% | 76.9% | 79.6% | 77.6% | 87.1% | 83.9% | 87.3% | 47.7% | 82.6% | <0.001 |
Adjusted incidence rate and adjusted mortality rate reported per 100,000 population.
EMS-transported severe traumatic injury due to penetrating mechanisms is described in Table 8. The unadjusted incidence of severe trauma secondary to penetrating mechanism was 3.8 per 100,000 person years. The adjusted incidence per 100,000 census population ranged from 1.3 to 16.8 (median = 2.6, IQR = 1.5–10.4). The adjusted mortality rate per 100,000 census population ranged from 0.3 to 5.3 (median = 1.0, IQR = 0.4 –3.4). The known case fatality rate ranged from 9.3% to 46.9% (median = 28.7%, IQR = 22.0%–38.0%). The known survival to discharge ranged from 37.5% to 84.7% (median = 67.5%, IQR = 54.1%–75.9%). The proportion of patients with vital status missing ranged from 0% to 20.5% (median = 4.7%, IQR = 1.3%–14.0%). All P values for differences across sites were <0.001. Further subgroup analysis was performed for stab wounds and gun shot wounds individually. Similar ranges in incidence, mortality, and case fatality as well as survival to discharge were noted.
TABLE 8.
Incidence and Outcome of Transported Penetrating Injury
| Site Identity
|
P | ||||||||||
|---|---|---|---|---|---|---|---|---|---|---|---|
| Alabama | Dallas | Iowa | Ottawa-OPALS | Pittsburgh | Portland | Seattle–King County | Toronto | Vancouver | ROC Total | ||
| All patients, N | 89 | 156 | 26 | 67 | 82 | 26 | 202 | 75 | 58 | 781 | |
| Adjusted incidence rate | 16.8 | 7.4 | 2.6 | 1.6 | 9.5 | 1.4 | 11.2 | 1.3 | 1.9 | 3.7 | <0.001 |
| Adjusted mortality rate | 5.3 | 3.5 | 1.1 | 0.3 | 3.3 | 0.4 | 1.0 | 0.3 | 0.5 | 1.0 | <0.001 |
| Case fatality rate | 31.4% | 46.9% | 40.9% | 18.4% | 35.0% | 28.7% | 9.3% | 25.6% | 26.6% | 27.5% | <0.001 |
| Survival to discharge | 67.5% | 37.5% | 59.1% | 80.0% | 52.6% | 67.8% | 84.7% | 71.8% | 55.5% | 64.7% | <0.001 |
| Vital status missing | 1.1% | 15.1% | 0.0% | 1.5% | 12.9% | 4.7% | 7.1% | 3.0% | 20.5% | 8.4% | <0.001 |
| Stab wounds, N | 20 | 35 | 13 | 59 | 13 | 13 | 99 | 53 | 29 | 334 | |
| Adjusted incidence rate | 3.8 | 1.8 | 1.3 | 1.4 | 1.5 | 0.7 | 5.5 | 0.9 | 0.9 | 1.6 | <0.001 |
| Adjusted mortality rate | 0.6 | 0.3 | 0.2 | 0.2 | 0.1 | 0.1 | 0.1 | 0.2 | 0.2 | 0.2 | <0.001 |
| Case fatality rate | 15.1% | 14.4% | 17.2% | 15.8% | 6.8% | 9.3% | 1.8% | 17.4% | 25.8% | 12.0% | <0.001 |
| Survival to discharge | 83.4% | 68.9% | 65.4% | 82.3% | 77.0% | 90.7% | 98.2% | 82.0% | 66.5% | 83.2% | <0.001 |
| Gunshot wounds, N | 65 | 113 | 9 | 3 | 58 | 11 | 82 | 24 | 22 | 387 | |
| Adjusted incidence rate | 12.2 | 5.2 | 0.8 | 0.1 | 6.7 | 0.6 | 4.5 | 0.4 | 0.7 | 1.8 | <0.001 |
| Adjusted mortality rate | 4.5 | 3.1 | 0.8 | 0.1 | 3.2 | 0.3 | 0.7 | 0.2 | 0.2 | 0.8 | <0.001 |
| Case fatality rate | 36.8% | 59.8% | 100.0% | 93.7% | 47.5% | 44.4% | 16.2% | 30.7% | 30.3% | 43.3% | <0.001 |
| Survival to discharge | 61.3% | 30.4% | 0.0% | 0.0% | 32.8% | 55.6% | 63.2% | 69.3% | 38.5% | 47.6% | <0.001 |
Adjusted incidence rate and adjusted mortality rate reported per 100,000 population.
DISCUSSION
In a large prospective multicenter observational study of severe traumatic injury in regions dispersed throughout North America, 69.3% of patients sustaining severe traumatic injury survived to discharge. Incidence, mortality, case fatality rate, and survival to discharge of EMS-assessed severe traumatic injury patients differed significantly across geographic regions. Part of the regional differences in incidence could be attributable to differences in the completeness of case ascertainment and potential for undetected cases. However, each site had or implemented approaches to ascertain cases of severe trauma from all EMS agencies within their geographic area. This prospective approach in conjunction with statistical methods to account for missing cases provides a robust resource for evaluating the public health magnitude of severe trauma. Approximately 4% of the entire cohort was alive and not transported. This suggests the potential for over classification of minimally injured patients as severe trauma. These cases were not equally distributed across sites with Seattle and Dallas accounting for approximately 55% and 15%, respectively (data not shown). Further, the proportion of patients with systolic blood pressure less than 90 (as a measure of severity, Table 2) at these sites is higher than the majority of other sites studied. This suggests that over triage is an unlikely cause of the variation in outcome observed. Additionally, Dallas had one of the lowest survival rates reported (Table 5). Further, the variation in outcome persists after analyzing only those transported (Table 6–8). Thus, the observed differences in incidences and outcomes likely reflect differences in the underlying risk of severe trauma as well as the local approach to organized emergency response and postresuscitation care in hospital.
Previous EMS-based data that report on the incidence of severe trauma are lacking. The CDC provides generalized injury incidence data through the National Health Interview Survey (available at: www.cdc.gov/nchs/nhis.htm). However, there is no prospective assessment of the variation in incidence of severe trauma across large geographic regions. Studies on the incidence of trauma have been generally limited to a single trauma center/system’s experience with a single organ system (eg, traumatic brain injury).8 Thus, we believe this is one of the first reports to describe the variation of severe trauma incidence across geographic regions.
Data from the CDC National Vital Statistics Report for 2005 shows that age adjusted mortality rate was dependent on mechanism of injury and race/ethnicity with non-Hispanic blacks having more than twice the firearm related mortality rate than non-Hispanic whites (37.7 vs. 15.5 per 100,000 census population).9 It is plausible that part of the variation in mortality rates across geographic regions seen in this study, particularly in severe penetrating trauma, may be in part due to differences in relative injured population proportions of whites, blacks, and Hispanics. Such data were not collected in this study. The results from this study do suggest differences in injury mechanism may partly explain differences in outcomes. The Dallas site had the highest proportion of patients sustaining penetrating injury mechanisms; particularly gun shot wounds (Tables 2–4). The Dallas site also had one of the highest case fatality/lowest survival to discharge rates (Tables 5–8). However, this link between mechanism of injury and outcome does not completely explain the results of this study. The Vancouver site had the highest case fatality/lowest survival to discharge rates, yet had a balanced proportion of injury mechanisms compared with other sites. Additionally, the Vancouver site had a high case fatality rate from falls, a mechanism with typically lower energy transfers than motor vehicle trauma. Thus, while the demographics of injury mechanism appear to play a role in the variation in outcomes across study sites and warrants further investigation, it does not completely explain the findings of this study.
The level of urbanization has a direct effect on mortality with motor vehicle related mortality rates increased in rural areas and mortality rates from intentional injury increased in urban areas.1 While Table 1 describes the service area population and average population density for each site, it does not reveal the range of population densities within a site. It is also plausible that differences in relative population densities within sites differs across regions and may in part also explain differences in incidence of severe injury. These potential explanations would suggest that variations in injury incidence across regions are inherent to population demographics and environmental conditions and may be responsive to injury prevention programs that target specific race/ethnic groups or injury characteristics inherent in rural versus urban trauma injury patterns.
Approximately half of all the patients who died did so at the scene and the remaining half who died did so after reaching the hospital. For those pronounced dead at the scene, it is possible that many sustained injuries not survivable by modern trauma management. The site variability in the proportion of those pronounced dead at the scene (Table 2) may reflect differences in EMS transport policy or may reflect a difference in injury severity. This study cannot further delineate the underlying causes of this difference and warrants further investigation. This proportion of mortality at the scene due to severe injury has not changed since first described by Baker and Trunkey and colleagues nearly 30 years ago.10 At the present time, these injuries are best prevented rather than treated. Organized injury prevention programs are more common in some regions compared with others. Expertly-conducted injury prevention programs that are targeted at specific injury mechanisms have shown promise at reducing the burden of injury.11,12 Organized injury prevention programs aimed at reducing the incidence of injury may have variable efficacy, penetrance, and resources across regions. The role that organized injury prevention programs plays in altering the incidence of injury across geographic areas of this study warrants further investigation. However, it is unlikely that differences in injury prevention program success fully explain our findings.
The formation of regional trauma systems that have a coordinated approach to managing all injuries has been associated with improved outcomes over the last 3 decades.13–15 These systems focus on prehospital triage and response times, hospital resources and training and finally risk-adjusted hospital outcomes. Prehospital personnel level of training has been shown to have little effect on trauma patient outcome.16–18 Further, the effect of out-of-hospital times, while controversial, has not been associated with mortality outcome differences in mature trauma systems.19 Recent analysis within the ROC epistry-trauma cohort has showed no mortality differences with increasing out-of hospital times.20 We saw no difference in time from dispatch to ALS provider scene arrival between those pronounced dead at the scene and those transported to hospital. Nor did we see a difference in level of training of scene provider (data not shown). Thus it is likely that neither the level of training of scene provider nor the time to arrival from dispatch explain the differences in outcomes across regions.
Prehospital treatment protocols vary across regions.21 Airway management in the prehospital setting is just 1 example of controversy with many authors questioning the use of advanced airways in the prehospital setting.22–25 In this study, there was significant differences in the use of advanced airways in the prehospital setting (Tables 2–4). This study had conflicting results with respect to the use of advanced airways. The Vancouver site had the highest proportion of advanced airway use (Table 2), yet had the lowest survival to discharge; whereas, the Seattle site had the second highest proportion of patients receiving an advanced airway and had 1 of the highest survival to discharge rates. Additionally, the Toronto site had the lowest use of advanced airways, yet had the highest survival to discharge rate. It is plausible that differences in prehospital management protocols across geographic regions may be a significant contributor to the differences in outcomes found in this study. The number and magnitude of prehospital care process variation across sites in this study warrants further investigation.
Once those dead at the scene are excluded from further analysis, incidence, mortality, case fatality rate and survival to discharge of EMS-transported severe traumatic injury patients still differed significantly across geographic regions. This difference persisted in both the blunt and penetrating subgroups. Regionalized trauma care has focused predominantly on available tiered resources of designated trauma centers. Regionalization has led to a concentration of trained personnel, experience and patient volume that has been associated with improved outcomes even at the cost of increased transport times.13,26–29 However, even among level 1 trauma centers there is wide variation in risk-adjusted outcomes.30–32 Approximately half of the deaths in this study occurred after arrival to hospital and were not immediately lethal. Thus variation in hospital volume, resources, operating room availability, resuscitation techniques and intensive care and postinjury management protocols are likely a major contributor to the variation in outcomes found in this study. Unfortunately, we were unable to assess the effect of hospital-based postresuscitation care on outcomes after severe trauma due to our lack of patient specific data about processes of care delivered in hospital.
Severe trauma is a leading cause of death in the United States.9 The Institute of Medicine has identified the need to improve funding for EMS operations.33 Extrapolation of the age-adjusted incidence rate observed in the study regions to the total population of the United States suggests that there are 114,379 (quasi confidence intervals 75,232–212,854) EMS-assessed severe trauma patients annually in the United States (37.4 per 100,000 × 305,825,042 US population, available at: www.census.gov, accessed Feb 15, 2009). Extrapolation of this study to the total population of Canada suggests that there are 11,604 (quasi confidence intervals 8226–23,275) EMS-assessed severe trauma patients annually in Canada (37.4 per 100,000 × 33,441,277 Canadian population, available at: www.statcan.gc.ca/start-debut-eng.html, accessed Feb 15, 2009). Collectively these estimates of burden imply that allocation of increased resources to trauma systems is necessary to achieve an important impact on major trauma in either country.
If survival after severe trauma treated by trauma systems could be increased from the study average of 69.3% to the maximum of 80.8% throughout North America, then the premature deaths of 13,500 individuals would be prevented each year (37.4 per 100,000 × (305,825,042 + 33,441,277) × (80.8% – 69.3%)).Ongoing funding for fundamental, translational, and clinical research related to trauma care is necessary to ensure we are able to achieve such improvements in public health.
The strengths as well as limitations of this type of epidemiological population study, statistical analysis and imputation techniques have been well described in a similar study on regional variation of incidence and outcome associated with out-of-hospital cardiac arrest by Nichol and the Resuscitation Outcomes Consortium.34 A further limitation of this study is its dependence on prehospital personnel to identify the inclusion criteria for severe trauma. Previous studies have shown that the ACSCOT criteria used in this study predict severe trauma with a high rate of reliability,35 and that prehospital personnel have high sensitivity (>97%) at identifying major trauma patients.36 It is unlikely that the accuracy of prehospital personnel recognition of severe trauma accounts for the variability in incidence or outcome after trauma across geographic regions.
These findings have implications for trauma systems. The 2-fold variation in survival after severe trauma demonstrates that severe trauma is a treatable condition. Nearly half of all deaths occurred at the scene and were probably secondary to severe nonsurvivable injuries. Prevention efforts aimed at improving environmental factors (roadways, safer cars, etc.) may ultimately impact these deaths. The remainder of deaths appears related to variations in trauma system performance. As the factors that separate high performing trauma systems from low performing trauma systems are identified (prehospital and ED resuscitation protocols, timeliness of surgery, ICU protocols, etc.) and disseminated, strategies can be implemented to improve care for all severe trauma victims.
CONCLUSION
Severe traumatic injury is common and lethal. There are significant and important regional variations in the incidence and outcome of severe injury. Additional investigation is necessary to understand the causes of this variation in an effort to allocate resources to trauma systems/trauma centers, and translational research directed at reducing the magnitude of this public health burden.
Acknowledgments
The Resuscitation Outcome Consortium (ROC) is supported by a series of cooperative agreements to 10 regional clinical centers and 1 data coordinating center (5U01 HL077863; HL077881; HL077871; HL077872; HL077866; HL077867; HL077885; HL077887; HL077873; HL077908; HL077865) from the National Heart, Lung and Blood Institute in partnership with the National Institute of Neurological Disorders and Stroke, US Army Medical Research & Material Command, the Canadian Institutes of Health Research (CIHR)—Institute of Circulatory and Respiratory Health, Defense Research and Development Canada, the American Heart Association and the Heart and Stroke Foundation of Canada.
Dr. Minei had full access to all the data in the study and takes full responsibility for the integrity of the data and accuracy of the data analyses.
Reviewed and approved by a representative of the National Institutes of Health.
The Resuscitation Outcomes Consortium formed this author group to write this paper. All authors listed had substantial input in the design, analysis, writing, editing, and final manuscript development. All authors approved this final submitted version.
The funding organization had no role in the design, collection, management, analysis, and interpretation of the data or the preparation of the manuscript.
References
- 1.Bergen G, Chen LH, Warner M, et al. Injury in the United States: 2007 Chartbook. Hyattsville, MD: National Center for Health Statistics; 2008. [Google Scholar]
- 2.Newgard CD, Sears GK, Rea TD, et al. The Resuscitation Outcomes Consortium Epistry-Trauma: design, development, and implementation of a North American epidemiologic prehospital trauma registry. Resuscitation. 2008;78:170–178. doi: 10.1016/j.resuscitation.2008.01.029. [DOI] [PMC free article] [PubMed] [Google Scholar]
- 3.American College of Surgeons. Resources for Optimal Care of the Injured Patient 2006. Chicago, IL: American College of Surgeons; 2006. Prehospital trauma care; pp. 21–25. [Google Scholar]
- 4.Graham JW, Schafer JL. On the performance of multiple imputation for multivariate data with small sample size. In: Hoyle RH, editor. Statistical Stategies for Small Sample Research. London, United Kingdom: SAGE Publications; 1999. pp. 1–32. [Google Scholar]
- 5.Little RJA, Rubin DB. Statistical Analysis With Missing Data. New York, NY: John Wiley and Sons; 1987. [Google Scholar]
- 6.Rubin DB. Multiple Imputation for Nonresponse in Surveys. New York, NY: John Wiley and Sons; 1987. [Google Scholar]
- 7.Rubin DB, Schenker N. Multiple imputation in health-care databases: an overview and some applications. Stat Med. 1991;10:585–598. doi: 10.1002/sim.4780100410. [DOI] [PubMed] [Google Scholar]
- 8.Maegele M, Engel D, Bouillon B, et al. Incidence and outcome of traumatic brain injury in an urban area in Western Europe over 10 years. Eur Surg Res. 2007;39:372–379. doi: 10.1159/000107097. [DOI] [PubMed] [Google Scholar]
- 9.Kung HC, Hoyert DL, Xu J, et al. Deaths: Final data for 2005. National Vital Statisitics Reports. 2008;56:10. [PubMed] [Google Scholar]
- 10.Baker CC, Oppenheimer L, Stephens B, et al. Epidemiology of trauma deaths. Am J Surg. 1980;140:144–150. doi: 10.1016/0002-9610(80)90431-6. [DOI] [PubMed] [Google Scholar]
- 11.Gentilello LM, Rivara FP, Donovan DM, et al. Alcohol interventions in a trauma center as a means of reducing the risk of injury recurrence. Ann Surg. 1999;230:473–480. doi: 10.1097/00000658-199910000-00003. [DOI] [PMC free article] [PubMed] [Google Scholar]
- 12.Istre GR, McCoy MA, Womack KN, et al. Increasing the use of child restraints in motor vehicles in a Hispanic neighborhood. Am J Public Health. 2002;92:1096–1099. doi: 10.2105/ajph.92.7.1096. [DOI] [PMC free article] [PubMed] [Google Scholar]
- 13.Härtl R, Gerber LM, Iacono L, et al. Direct transport within an organized state trauma system reduces mortality in patients with severe traumatic brain injury. J Trauma. 2006;60:1250–1256. doi: 10.1097/01.ta.0000203717.57821.8d. [DOI] [PubMed] [Google Scholar]
- 14.Liberman M, Mulder DS, Jurkovich GJ, et al. The association between trauma system and trauma center components and outcome in a mature regionalized trauma system. Surgery. 2005;137:647–658. doi: 10.1016/j.surg.2005.03.011. [DOI] [PubMed] [Google Scholar]
- 15.Mann NC, Mullins RJ, MacKenzie EJ, et al. Systematic review of published evidence regarding trauma system effectiveness. J Trauma. 1999;47:S25–S33. doi: 10.1097/00005373-199909001-00007. [DOI] [PubMed] [Google Scholar]
- 16.Eckstein M, Chan L, Schneir A, et al. Effect of prehospital advanced life support on outcomes of major trauma patients. J Trauma. 2000;48:643–648. doi: 10.1097/00005373-200004000-00010. [DOI] [PubMed] [Google Scholar]
- 17.Stiell IG, Nesbitt LP, Pickett W, et al. The OPALS Major Trauma Study: impact of advanced life-support on survival and morbidity. Can Med Assoc J. 2008;178:1141–1152. doi: 10.1503/cmaj.071154. [DOI] [PMC free article] [PubMed] [Google Scholar]
- 18.Liberman M, Mulder DS, Sampalis JS. Advanced or basic life support for trauma: meta-analysis and critical review of the literature. J Trauma. 2000;49:584–599. doi: 10.1097/00005373-200010000-00003. [DOI] [PubMed] [Google Scholar]
- 19.Báez AA, Lane PL, Sorondo B, et al. Predictive effect of out-of-hospital time in outcomes of severely injured young adults and elderly patients. Prehosp Disaster Med. 2006;21:427–430. doi: 10.1017/s1049023x00004143. [DOI] [PubMed] [Google Scholar]
- 20.Newgard CD, Schmicker RH, Hedges JR, et al. Emergency medical services intervals and survival in trauma: assessment of the “golden hour” in a North American prospective cohort. Ann Emerg Med. 2010;55:235–246. doi: 10.1016/j.annemergmed.2009.07.024. [DOI] [PMC free article] [PubMed] [Google Scholar]
- 21.Bulger EM, Nathens AB, Rivara FP, et al. National variability in out-of-hospital treatment after traumatic injury. Ann Emerg Med. 2007;49:293–301. doi: 10.1016/j.annemergmed.2006.06.038. [DOI] [PubMed] [Google Scholar]
- 22.Bochicchio GV, Ilahi O, Joshi M, et al. Endotracheal intubation in the field does not improve outcome in trauma patients who present without an acutely lethal traumatic brain injury. J Trauma. 2003;54:307–311. doi: 10.1097/01.TA.0000046252.97590.BE. [DOI] [PubMed] [Google Scholar]
- 23.Davis DP, Peay J, Sise MJ, et al. The impact of prehospital endotracheal intubation on outcome in moderate to severe traumatic brain injury. J Trauma. 2005;58:933–939. doi: 10.1097/01.ta.0000162731.53812.58. [DOI] [PubMed] [Google Scholar]
- 24.Davis DP, Vadenboncoeur TF, Ochs M, et al. The association between field Glasgow Coma Scale score and outcome in patients undergoing paramedic rapid sequence intubation. J Emerg Med. 2005;29:391–397. doi: 10.1016/j.jemermed.2005.04.012. [DOI] [PubMed] [Google Scholar]
- 25.Warner KJ, Cuschieri J, Copass M, et al. The impact of prehospital ventilation on outcome after severe traumatic brain injury. J Trauma. 2007;62:1330–1338. doi: 10.1097/TA.0b013e31804a8032. [DOI] [PubMed] [Google Scholar]
- 26.Chiara O, Cimbanassi S. Organized trauma care: does volume matter and do trauma centers save lives. Curr Opin Crit Care. 2003;9:510–514. doi: 10.1097/00075198-200312000-00008. [DOI] [PubMed] [Google Scholar]
- 27.MacKenzie EJ, Rivara FP, Jurkovich GJ, et al. A national evaluation of the effect of trauma center care on mortality. N Engl J Med. 2006;354:366–378. doi: 10.1056/NEJMsa052049. [DOI] [PubMed] [Google Scholar]
- 28.Utter GH, Maier RV, Rivara FP, et al. Inclusive trauma systems: do they improve triage or outcomes. J Trauma. 2006;60:529–535. doi: 10.1097/01.ta.0000204022.36214.9e. [DOI] [PubMed] [Google Scholar]
- 29.Nathens AB, Jurkovich GJ, Maier RV, et al. The relationship between trauma center volume and outcome. JAMA. 2001;285:1164–1171. doi: 10.1001/jama.285.9.1164. [DOI] [PubMed] [Google Scholar]
- 30.Nathens AB, Xiong W, Shafi S. Ranking of trauma center performance: the bare essentials. J Trauma. 2008;65:628–635. doi: 10.1097/TA.0b013e3181837994. [DOI] [PubMed] [Google Scholar]
- 31.Shafi S, Nathens AB, Parks J, et al. Trauma quality improvement using risk-adjusted outcomes. J Trauma. 2008;65:599–604. doi: 10.1097/TA.0b013e31816533f9. discussion 604-606. [DOI] [PubMed] [Google Scholar]
- 32.Shafi S, Stewart RM, Nathens AB, et al. Significant variation in mortality occurs at similarly designated trauma centers. Arch Surg. 2009;144:64–68. doi: 10.1001/archsurg.2008.509. [DOI] [PubMed] [Google Scholar]
- 33.Institute of Medicine. Emergency Medical Sevices at the Crossroads. Washington, DC: National Academy Press; 2006. [Google Scholar]
- 34.Nichol G, Thomas E, Callaway CW, et al. Resuscitation Outcomes Consortium Investigators. Regional variation in out-of-hospital cardiac arrest incidence and outcome. JAMA. 2008;300:1423–1431. doi: 10.1001/jama.300.12.1423. [erratum appears in JAMA. 2008; 300; 1763] [DOI] [PMC free article] [PubMed] [Google Scholar]
- 35.Esposito TJ, Offner PJ, Jurkovich GJ, et al. Do prehospital trauma center triage criteria identify major trauma victims? Arch Surg. 1995;130:171–176. doi: 10.1001/archsurg.1995.01430020061010. [DOI] [PubMed] [Google Scholar]
- 36.Mulholland SA, Cameron PA, Gabbe BJ, et al. Prehospital prediction of the severity of blunt anatomic injury. J Trauma. 2008;64:754–760. doi: 10.1097/01.ta.0000244384.85267.c5. [DOI] [PubMed] [Google Scholar]