

Chronic kidney disease (CKD) is thought to be a complex disorder, a result of the interplay between many known and unknown environmental and genetic factors. CKD exhibits familial aggregation and clustering by race (1, 2), which probably reflects both shared environmental exposures and genetic contribution to the susceptibility to CKD (3). In this issue of the American Journal of Kidney Diseases, MacCluer and colleagues present their results from the Genetics of Kidney Disease in Zuni Indians (GKDZI) study that was initiated to identify genes, environmental factors and genetic-environmental interactions that modulate susceptibility to CKD and intermediate phenotypes. In their well designed and conducted study they present heritability estimates and genetic correlations for CKD, diabetes, and cardiovascular disease (CVD) phenotypes (4).
The Zuni Indians are an American Indian tribe in New Mexico with a disproportionately high rate of CKD attributable to both diabetic and non-diabetic kidney disease (5, 6). Their age- and gender-adjusted prevalence of end-stage renal disease (ESRD) (17,400 per million population) (7) is 18.5-, 4.1-, and 5.3-fold higher than that among European Americans, African Americans, and other American Indians respectively (2). In 1989, the Indian Health Service established the Indian Health Service Kidney Disease Program (8) and in 2002, Stidley and colleagues reported a population based cross sectional survey of kidney disease in the Zuni Indians that formed the basis of The Zuni Kidney Project (7). The Zuni Kidney Project is a community-based, collaborative research program that was established to reduce the burden of kidney disease in this population (6).
Generally speaking, phenotypic variation in a population arises from two sources – from genotypic differences (nature) and environmental factors (nurture). Heritability metrics try to quantify the relative contributions of these two sources: they express the proportion of phenotypic variance that can be ascribed to genetic influences. Therefore, heritability metrics range between 0 and 1, with larger values implying greater contribution of genetic factors. There are many heritability metrics because there are several ways to define genetic influences. Broad sense heritability (Figure 1, H2 metric) refers to the total genetic contribution. Strict (narrow) sense heritability (Figure 1, h2 metric) specifically focuses on additive genetic variance, which drives the resemblance between relatives and is what can be most readily quantified.
Figure 1.
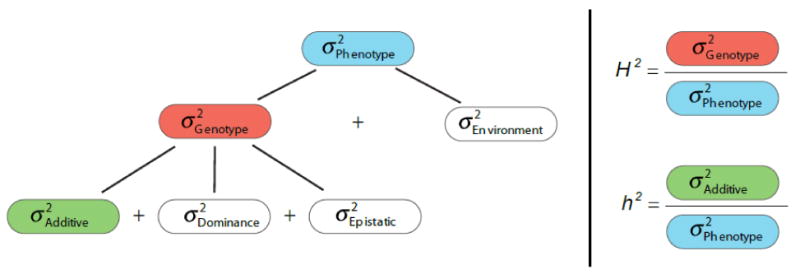
Heritability metrics Heritability is a concept that summarizes how much of the variation in a trait is due to variation in genetic factors. Resemblance between parents and offspring or within siblings is an intuitive illustration of the concept of heritability. Heritability should be distinguished from familiality that only implies sharing of traits within a family for any reason (e.g., obesity as result of high energy diet, or lung cancer as result of smoking). Traits are heritable only if the similarity arises from shared genotypes.
We refer to the “narrow sense heritability” or h2, as the ratio of the additive genetic variance to the total phenotypic variance. Resemblance between relatives is mostly driven by additive genetic variance, so narrow sense heritability tells us how well a parent's phenotypic value will predict the offspring value (9). When all genetic influences are taken into account, including additive and non-additive (dominance and interactive or epistatic) effects, their ratio with total phenotypic variance yields the “broad sense heritability” or H2 (10, 11). This parameter tells us what proportion of the phenotypic variation is due to the genotypes of the individuals of the population. It does not address how similar the phenotype of a child will be to its parent.
The following may help to provide a better understanding of how h2 is calculated. Analysis of heritability is typically based upon phenotypic similarity between relative pairs. While the phenotype is directly observed, the shared genetic influence is not measured directly but it is inferred from relatedness. This is actually a very valid “shortcut”, as long as information on relatedness is accurate. In empirical explorations using genome wide marker data, the amount of genetic information that is actually shared by relatives is consistent with theory (12). Traditionally, narrow sense heritability was determined from simple balanced designs such as the correlation of phenotypes between parents and offspring, or full or half siblings, or the difference in the correlation seen in monozygotic and dizygotic twin pairs (11). The expected resemblance is based on a “coefficient of relatedness” (13), which depends on the familial relationship. For example, the coefficient of relatedness between parent and offspring would be 0.5, reflecting that half of the offspring's genome comes from that parent. If the observed phenotypic correlation between parent and offspring values of a trait were, for example, 0.4 and we expect on purely genetic grounds a correlation of 0.5, then an estimate of heritability would be 0.4/0.5 = 0.8. When phenotypic measures are available for individuals with varying relationships and there are varying available members in each family, more complex methods are needed to estimate genetic variance components (11).
How do we interpret a heritability estimate? The value of 0.8 in the aforementioned example tells us that 80% of the variability in the offspring phenotype is accounted for by genetic factors, ie, 80% of the inter-individual differences in the phenotype. It does not tell us that 80% of the phenotype is genetic, nor does it allude in any way to the absolute value of the trait. Heritability estimates reflect the amount of variation in genotypic effects compared to variation in environmental effects and are not absolute measurements of the contribution of genetic and environmental factors to a phenotype. Heritability is a population parameter and describes the population, not individuals within that population. Estimates are therefore relative to population-specific factors such as allele frequencies, the measurable effects of gene variants and the influence of environmental factors. Increasing genetic variance, as with outbreeding populations, or decreasing environmental variance, as with controlled experimental conditions, can increase heritability estimates and conversely, inbreeding or increased diversity of the environment can decrease them. For these reasons, a low heritability estimate does not necessarily imply lack of genetic influence on a trait of interest. Heritability must be interpreted in context of population and environment and predictions can only be made if these conditions are kept constant. Nevertheless, in practice, heritabilities of similar traits are often remarkably similar across populations (11).
In their study, MacCluer and colleagues enrolled 821 participants, 805 of whom belonged to a single family, since Zuni Indians are an endogamous tribe (4). The prevalence of kidney disease and cardiovascular risk factors was considerable in this population; kidney disease was identified in 23%, diabetes in 17%, hypertension in 35% and overweight or obesity in over 60%. The 821 participants correspond to 7,702 relative pairs that were used to estimate additive genetic variance. The authors first adjusted for a set of covariates to correct the total phenotypic variance for known fixed effects, so as not to underestimate heritability. Heritabilities for estimated GFR (eGFR), urine albumin creatinine ratio (ACR), serum creatinine, BUN, uric acid, cystatin C, weight, body mass index (BMI), glycosylated hemoglobin (HbA1c), systolic and diastolic blood pressure (SBP, DBP), hypertension status, HDL and LDL cholesterol (HDL-C, LDL-C), triglycerides, and total cholesterol were all significantly different from zero and ranged between 0.22 to 0.32 for renal related phenotypes. Weight-related phenotypes and hypertension had the largest estimates, more than 0.5.
What do we learn from these results? The calculated heritability estimates are comparable to those reported in previous family-based studies of renal phenotypes in populations with and without diabetes (14-19), and support the notion that chronic kidney disease and intermediate phenotypes are complex traits. At the same time, their magnitude suggests a substantial environmental component of phenotypic variation. Several opposing forces could have affected the estimation of additive genetic variances in this population. Factors that reduce environmental variability (and therefore the overall phenotypic variance) can result in increased h2 estimates. For example, use of angiotensin converting enzyme inhibitors and angiotensin receptor blockers may have reduced the overall phenotypic variance of traits such as eGFR, urine ACR, SBP and DBP. In general, it is likely that a closed community such as the Zuni experiences more similar environmental influences compared to other populations. On the other hand the practice of endogamy and inbreeding would reduce genetic variance within families, thereby diminishing the calculated h2.
Even in the era of agnostic interrogations of the whole genome with genome-wide association studies, studying the heritability of a complex trait has scientific value. The effects of inbreeding on recessive Mendelian disorders is well known (20). The indigenous Native American population underwent a drastic reduction in population size between the 15th and 19th centuries laying the conditions for a genetic bottleneck and the expression of “founder effects” (21). This demographic occurrence in concert with the practice of endogamy in small isolated communities such as the Zuni Indians has also led to a high rate of recessive disorders such as cystic fibrosis (22). There is also the growing recognition that isolated populations practicing endogamy may demonstrate deleterious effects on a wide range of complex traits that may manifest values at the extremes of the phenotypic distribution. In such a setting therefore, the high prevalence of kidney disease with statistically significant heritability estimates reflects the importance of a genetic contribution and is all the more noteworthy. Traglia and colleagues studied the isolated population of Val Borbera in Italy. Apart from demonstrating substantial heritability in several metabolic syndrome-related phenotypes, they noted that individuals presenting extreme values for these traits presented a higher kinship coefficient – a measure of inbreeding - compared to individuals in other percentile groups (23). Similarly Rudan et al. showed a large effect of inbreeding on blood pressure and other late onset conditions in offspring of first cousin marriages in three isolated Dalmatian Islands in Croatia (24). It is conceivable that in such populations, clustering of extreme phenotypes in large multigenerational families would present potential opportunities to uncover rare variants with larger impact on disease phenotypes.
MacCluer et al also extend their analyses to bivariate genetic correlations between phenotypes (4). Traits distinct from each other can co-vary within individuals and their genetic correlation is used as a measure of how much the additive genetic influences on one trait impact the other. The biological basis of such phenotypic covariation is pleiotropy, where a subset of the genes that influence one trait may also influence another trait (25). While there are many examples of genetic pleiotropy associated with rare diseases (e.g., phenylketonuria and Marfan syndrome), little is known about pleiotropic genes associated with common conditions. In this study, there was no pleiotropy among kidney-related phenotypes, indicating no detectable shared genetic effects. A lack of genetic correlation between eGFR and UACR was also noted by Placha in individuals with type 2 diabetes and their non-diabetic relatives, suggesting that the genetic factors that determine the variation in urine ACR do not overlap the genetic factors that determine the variation in eGFR (26). Interestingly MacCluer et al (4) report genetic correlations between urine ACR and SBP, DBP and hypertension status and between HbA1c and BUN suggesting that pleiotropic effects may exist among genes contributing to the metabolic syndrome or CVD. The phenotypic effects that single genes impose in multiple tissues may give an insight into pathogenesis of complex traits ultimately directing the search for genetic determinants toward shared mechanisms such as common gene products or signaling pathways.
Quantitative genetic analyses of family-based studies are an important first step in profiling the genetic landscape of a complex trait, even in the era of genome-wide association studies and mega-meta-analyses. The availability of genome-wide markers can ultimately help translate population-based heritability estimates to gene mapping approaches in order to identify variants accounting for individual and population risk. So far, the reliance on the ‘common disease common variant hypothesis’ has only explained a small portion of heritability. In an attempt to find what is referred to as “missing heritability” (27) efforts are underway to uncover the contributions of rare or structural genomic variation or exploit novel family based designs or patterns of linkage disequilibrium. In this post-genomic era, high risk isolated populations such as the Zuni will hold special promise for gene discovery.
Footnotes
Financial Disclosure: The authors declare that they have no relevant financial interests.
Publisher's Disclaimer: This is a PDF file of an unedited manuscript that has been accepted for publication. As a service to our customers we are providing this early version of the manuscript. The manuscript will undergo copyediting, typesetting, and review of the resulting proof before it is published in its final citable form. Please note that during the production process errors may be discovered which could affect the content, and all legal disclaimers that apply to the journal pertain.
Contributor Information
Madhumathi Rao, Tufts Medical Center, Boston, Massachusetts.
Inga Peter, Mount Sinai School of Medicine, New York, New York.
Thomas A. Trikalinos, Tufts Medical Center, Boston MA.
References
- 1.Satko SG, Freedman BI, Moossavi S. Genetic factors in end-stage renal disease. Kidney Int Suppl. 2005:S46–49. doi: 10.1111/j.1523-1755.2005.09411.x. [DOI] [PubMed] [Google Scholar]
- 2.USRDS 2000 Annual Data Report: Atlas of End-Stage Renal Disease in the United States. Bethesda, MD: National Institutes of Health, National Institute of Diabetes and Digestive and Kidney Diseases; 2000. [Google Scholar]
- 3.Bowden DW. Genetics of kidney disease. Kidney Int Suppl. 2003:S8–12. doi: 10.1046/j.1523-1755.63.s83.3.x. [DOI] [PubMed] [Google Scholar]
- 4.MacCluer JW, Scavini M, Shah VO, et al. Heritability of Measures of Kidney Disease among Zuni Indians: The Zuni Kidney Project. Am J Kidney Dis. 2010 doi: 10.1053/j.ajkd.2010.03.012. [DOI] [PMC free article] [PubMed] [Google Scholar]
- 5.Shah VO, Scavini M, Stidley CA, et al. Epidemic of diabetic and nondiabetic renal disease among the Zuni Indians: the Zuni Kidney Project. J Am Soc Nephrol. 2003;14:1320–1329. doi: 10.1097/01.asn.0000059920.00228.a0. [DOI] [PubMed] [Google Scholar]
- 6.Scavini M, Stidley CA, Paine SS, et al. The burden of chronic kidney disease among the Zuni Indians: the Zuni Kidney Project. Clin J Am Soc Nephrol. 2007;2:509–516. doi: 10.2215/CJN.02780806. [DOI] [PubMed] [Google Scholar]
- 7.Stidley CA, Shah VO, Narva AS, et al. A population-based, cross-sectional survey of the Zuni Pueblo: a collaborative approach to an epidemic of kidney disease. Am J Kidney Dis. 2002;39:358–368. doi: 10.1053/ajkd.2002.30557. [DOI] [PubMed] [Google Scholar]
- 8.Narva AS. Reducing the burden of chronic kidney disease among American Indians. Adv Chronic Kidney Dis. 2008;15:168–173. doi: 10.1053/j.ackd.2008.01.011. [DOI] [PubMed] [Google Scholar]
- 9.Hill WG, Goddard ME, Visscher PM. Data and theory point to mainly additive genetic variance for complex traits. PLoS Genet. 2008;4:e1000008. doi: 10.1371/journal.pgen.1000008. [DOI] [PMC free article] [PubMed] [Google Scholar]
- 10.Rice TK. Familial resemblance and heritability. Adv Genet. 2008;60:35–49. doi: 10.1016/S0065-2660(07)00402-6. [DOI] [PubMed] [Google Scholar]
- 11.Visscher PM, Hill WG, Wray NR. Heritability in the genomics era--concepts and misconceptions. Nat Rev Genet. 2008;9:255–266. doi: 10.1038/nrg2322. [DOI] [PubMed] [Google Scholar]
- 12.Visscher PM, Medland SE, Ferreira MA, et al. Assumption-free estimation of heritability from genome-wide identity-by-descent sharing between full siblings. PLoS Genet. 2006;2:e41. doi: 10.1371/journal.pgen.0020041. [DOI] [PMC free article] [PubMed] [Google Scholar]
- 13.Wright S. Coefficients of inbreeding and relationship. Am Nat. 1922;56:330–338. [Google Scholar]
- 14.Langefeld CD, Beck SR, Bowden DW, Rich SS, Wagenknecht LE, Freedman BI. Heritability of GFR and albuminuria in Caucasians with type 2 diabetes mellitus. Am J Kidney Dis. 2004;43:796–800. doi: 10.1053/j.ajkd.2003.12.043. [DOI] [PubMed] [Google Scholar]
- 15.Krolewski AS, Poznik GD, Placha G, et al. A genome-wide linkage scan for genes controlling variation in urinary albumin excretion in type II diabetes. Kidney Int. 2006;69:129–136. doi: 10.1038/sj.ki.5000023. [DOI] [PubMed] [Google Scholar]
- 16.Fox CS, Yang Q, Guo CY, et al. Genome-wide linkage analysis to urinary microalbuminuria in a community-based sample: the Framingham Heart Study. Kidney Int. 2005;67:70–74. doi: 10.1111/j.1523-1755.2005.00056.x. [DOI] [PubMed] [Google Scholar]
- 17.Fox CS, Yang Q, Cupples LA, et al. Genomewide linkage analysis to serum creatinine, GFR, and creatinine clearance in a community-based population: the Framingham Heart Study. J Am Soc Nephrol. 2004;15:2457–2461. doi: 10.1097/01.ASN.0000135972.13396.6F. [DOI] [PubMed] [Google Scholar]
- 18.Fogarty DG, Rich SS, Hanna L, Warram JH, Krolewski AS. Urinary albumin excretion in families with type 2 diabetes is heritable and genetically correlated to blood pressure. Kidney Int. 2000;57:250–257. doi: 10.1046/j.1523-1755.2000.00833.x. [DOI] [PubMed] [Google Scholar]
- 19.Bochud M, Elston RC, Maillard M, et al. Heritability of renal function in hypertensive families of African descent in the Seychelles (Indian Ocean) Kidney Int. 2005;67:61–69. doi: 10.1111/j.1523-1755.2005.00055.x. [DOI] [PubMed] [Google Scholar]
- 20.Bittles A. Consanguinity and its relevance to clinical genetics. Clin Genet. 2001;60:89–98. doi: 10.1034/j.1399-0004.2001.600201.x. [DOI] [PubMed] [Google Scholar]
- 21.Holve S, Hu D, McCandless SE. Metachromatic leukodystrophy in the Navajo: fallout of the American-Indian wars of the nineteenth century. Am J Med Genet. 2001;101:203–208. doi: 10.1002/ajmg.1362. [DOI] [PubMed] [Google Scholar]
- 22.Kessler D, Moehlenkamp C, Kaplan G. Determination of cystic fibrosis carrier frequency for Zuni native Americans of New Mexico. Clin Genet. 1996;49:95–97. doi: 10.1111/j.1399-0004.1996.tb04336.x. [DOI] [PubMed] [Google Scholar]
- 23.Traglia M, Sala C, Masciullo C, et al. Heritability and demographic analyses in the large isolated population of Val Borbera suggest advantages in mapping complex traits genes. PloS One. 2009;4:e7554. doi: 10.1371/journal.pone.0007554. [DOI] [PMC free article] [PubMed] [Google Scholar]
- 24.Rudan I, Rudan D, Campbell H, et al. Inbreeding and risk of late onset complex disease. J Med Genet. 2003;40:925–932. doi: 10.1136/jmg.40.12.925. [DOI] [PMC free article] [PubMed] [Google Scholar]
- 25.Plomin R, DeFries JC. Multivariate behavioral genetic analysis of twin data on scholastic abilities. Behav Genet. 1979;9:505–517. doi: 10.1007/BF01067347. [DOI] [PubMed] [Google Scholar]
- 26.Placha G, Canani LH, Warram JH, Krolewski AS. Evidence for different susceptibility genes for proteinuria and ESRD in type 2 diabetes. Adv Chronic Kidney Dis. 2005;12:155–169. doi: 10.1053/j.ackd.2005.02.002. [DOI] [PubMed] [Google Scholar]
- 27.Manolio TA, Collins FS, Cox NJ, et al. Finding the missing heritability of complex diseases. Nature. 2009;461:747–753. doi: 10.1038/nature08494. [DOI] [PMC free article] [PubMed] [Google Scholar]