

Abstract
Purpose
To investigate the expressional changes of Na+/K+-ATPase subunits in the lacrimal glands (LG) of term pregnant rabbits.
Methods
LG were obtained from term pregnant rabbits and age-matched female control rabbits for laser capture microdissection (LCM), real time RT-PCR, western blot, and immunofluorescence. The mRNA and proteins of α1, α2, β1, β2, and β3 subunits of Na+/K+-ATPase were detected and quantified.
Results
Although only the mRNA for β3 from whole LG of pregnant rabbits was significantly different from that of normal controls, many mRNA levels for α1, α2, β1, β2, and β3 from acini and epithelial cells from various duct segments that were collected by LCM were significantly different from those of normal control rabbits. Western blots demonstrated that the expressions of all three β subunits were significantly higher in pregnant rabbits, while both α subunits remained unchanged during pregnancy. Interestingly, immunofluorescence results showed that the distribution patterns of all Na+/K+-ATPase subunits during pregnancy were similar to those of the control rabbits.
Conclusions
Changes were found in mRNA and protein expressions of Na+/K+-ATPase subunits in LG from term pregnant rabbits and these changes suggest a role in the pregnancy-related LG secretion changes and dry eye symptoms observed in these animals.
Keywords: Dry eye, Lacrimal gland, Na+/K+-ATPase, Pregnancy
INTRODUCTION
The lacrimal gland (LG) contributes most of the water and electrolytes in tears through an osmotic process that is, like other exocrine gland secretions, mediated by aquaporins and ion transporters such as Na+/K+-ATPase.1–8 Deficiency of tears could lead to dry eye, the most frequently encountered problems for eye clinicians.
LG fluid secretion is produced in two stages: (1) secretion of primary fluid in the acini, and (2) modification into the final fluid during its transit through the duct system before reaching the ocular surface. Most LG studies have focused on the acinar cells; however, recent studies have shown that ductal cells, just like acinar cells, also have substantial amounts of aquaporins and ion transporters and may play critical roles in LG secretion and dysfunction.1–3,7,9
Because dry eye is closely related to changes in sex hormone milieu in the body10 and there are substantial variations of hormonal profiles during the course of pregnancy, it presents an interesting physiological environment to study dry eye. Indeed, many clinicians have an impression that pregnant women more frequently report symptoms of dry eye than non-pregnant women (personal communications), which is supported by our epidemiological study suggesting that a subpopulation of pregnant women experience increased symptoms of dry eye during the third trimester of their pregnancies (review article).11 Recent reports including an ARVO (Association for Research in Vision and Ophthalmology) abstract also indicate that women with one or more pregnancies have an increased risk of having Sjögren’s syndrome,12,13 an autoimmune disease which involves pathologies in salivary glands and LG that result in dry mouth and dry eye. Other studies have shown that the vast majority of dry eye patients are women, especially those after menopause.14 Our recent study demonstrated that basal LG fluid production decreased from 0.35 ± 0.04 in control rabbits to 0.21 ± 0.05 μL/min in pregnant rabbits, while pilocarpine stimulated secretion increased from 5.23 ± 0.4 in control rabbits to 11.4 ± 0.56 μL/min in pregnant rabbits.15 This was consistent with our clinical evaluations of ocular surface changes in pregnant rabbits that demonstrated the presence of dry eye symptoms (#16 is an ARVO abstract).16,17 Therefore, pregnancy, as a natural physiological condition, appears to be a risk factor for dry eye and can be used as a model for LG deficiency and dry eye studies.11,15,17
Na+/K+-ATPase is a plasma membrane enzyme that uses energy released from ATP hydrolysis to move three Na+ out of and two K+ into the cells.18 Na+/K+-ATPase is a heterotetramer comprised of two α subunits and two β subunits. Two α subunit isoforms (α1 and α2) and three β subunit isoforms (β1, β2, and β3) have been identified so far with only the β subunit being essential for its normal function.18 Na+/K+-ATPase has been detected in the LG of rabbits1,3,8,19–26 and rats,7,20,27–30 and has been shown to play a critical role in LG function.3,8 Therefore, the aim of the present study was to investigate the expressional changes of Na+/K+-ATPase subunits in the LG from pregnant rabbits with particular emphasis on the duct system.
METHODS
Animals and Tissue Preparation
Two groups of adult female New Zealand White rabbits (Irish Farms, Norco, CA) were used. One group consisted of six term pregnant rabbits, and the other consisted of six age- and sex-matched normal controls. Pregnant rabbits were time dated with day zero corresponding to the date of coitus. Normal gestation in the rabbit is 31 days. Term pregnant rabbits were sacrificed on the 29th day of pregnancy. The rabbits were narcotized with a mixture of ketamine (40 mg/mL) and xylazine (10 mg/mL) and given an overdose of Nembutal (80 mg/kg) for euthanasia. Inferior LG were removed and embedded in OCT, frozen in liquid nitrogen, and stored at −80°C until use. This study conformed to the standards and procedures for the proper care and use of animals by the US Public Health Service Policy on Humane Care and Use of Laboratory Animals.
Laser Capture Microdissection
Frozen sections collected with PEN membrane-coated slides (Leica Microsystems) were stained with cresyl violet with an LCM Staining Kit under RNase-free conditions (Applied Biosystems, Foster City, CA). A PixCell II LCM System (Arcturus Bioscience, Mountain View, CA) was then used to laser capture acinar cells and ductal cells from specific duct segments. Six replicate samples of approximately 100 cells each corresponding to acinar cells or a duct segment were collected for isolation of total mRNA.1
RNA Extraction and Reverse Transcription
Total cellular RNA was isolated from RNAlater-treated samples with an RNeasy® Midi Kit plus on-column DNase digestion (Qiagen, Valencia, CA). Detailed procedures were described in our previous report.1
Real-time RT-PCR Analysis and Pre-amplification
The sequences of primers and probes used in this study were listed in our previous publication.1 For LCM samples, pre-amplification was performed using a TaqMan® PreAmp Master Mix Kit (Applied Biosystems). For real-time RT-PCR, TaqMan® Gene Expression Master Mix (Applied Biosystems) containing the internal dye ROX as a passive reference was used and amplification was carried out on an ABI PRISM® 7900HT Sequence Detection System (Applied Biosystems). Detailed procedures were described in our previous report.1 Each sample was measured in triplicate and the difference between the CT values of each target mRNA and GAPDH, an internal housekeeping gene, was used to determine the level of target mRNA relative to the level of GAPDH mRNA in the same sample.
Immunofluorescence and Microscopy
The primary antibodies used were all purchased from Santa Cruz Biotechnology, Santa Cruz, CA. The dilution for α1 (mouse monoclonal, sc-71638) was 1:400; for α2 (goat polyclonal, sc-31391), 1:400; for β1 (mouse monoclonal, sc-21713), 1:100; for β2 (mouse monoclonal, sc-135997), 1:100; and for β3 (goat polyclonal, sc-66343), 1:250. Fluorescein isothiocyanate (FITC)-conjugated AffiniPure donkey anti-goat and anti-mouse IgG (Jackson ImmunoResearch Laboratories, West Grove, PA) at a dilution of 1:200 were used as secondary antibodies. Rhodamine conjugated phalloidin (Invitrogen, Carlsbad, CA), at a dilution of 1:200, was also used to stain F-actin in order to discern morphological profiles of the LG. At least three control rabbits and three pregnant rabbits were stained and repeated at least three times for each subunit tested.
The immunofluorescence technique was described in detail previously.1 Slides were observed with a Leica epi-fluorescence microscope (Leica Microsystems, Buffalo Grove, IL) and a Zeiss LSM 710 confocal laser scanning microscope (Carl Zeiss MicroImaging, Thornwood, NY). FITC-conjugated secondary antibodies were visualized by excitation with an argon laser at 488 nm. Images were analyzed with LSM image browser (Carl Zeiss MicroImaging) and PhotoShop (Adobe Systems, Mountain View, CA).
Western Blot
LGs were homogenized in RIPA buffer (50 mM Tris-HCl pH 7.4, 150 mM NaCl, 1 mM EDTA, 1% Triton X 100, 1% Na deoxycholate, 0.1% SDS, 1 mM PMSF, 1 μg/mL aprotinin, 1 μg/mL leupeptin) and centrifuged at 2000×g for 20 min. The supernatant was then denatured in SDS-PAGE sample buffer at 60°C for 20 min, resolved on a 7.5% or 4–20% gradient SDS-PAGE gel (Bio-Rad, Hercules, CA), and transferred onto Immobilon-P PVDF membrane (Millipore, Billerica, CA). A constant quantity of proteins from each sample was analyzed to accurately assess transporter proteins. Membrane blots were probed with α1 at a dilution of 1:1,000, α2 at 1:500, β1 at 1:2,000, and β2 and β3 at 1:500. Blots were incubated with either Alexa 680-labeled donkey anti-goat or goat anti-mouse secondary antibody (Invitrogen) and detected with an Odyssey Infrared Imaging System (Li-Cor, Lincoln, NE). Three replicates from at least 3 different animals each were used for each subunit. Densitometry analysis of the resulting gel was performed with the manufacturer’s software.
Statistics
Data were presented as mean ± standard error of the mean (SEM). Student’s t-test and ANOVA were used to evaluate the significance of the differences; p < 0.05 was considered significant.
RESULTS
Expressions of mRNA
α1
mRNA level for α1 from whole LG of pregnant rabbits was 0.876 ± 0.022, which is not significantly different from that of control rabbits (0.89 ± 0.064, p > 0.05), as we reported earlier.26 Data from LCM samples indicated that mRNA for α1 from pregnant rabbits was least abundant in acini (Figure 1), and its level was significantly lower in acini and intralobular duct (p < 0.05), while its abundance was increased in intralobar and interlobar ducts (p < 0.05), as compared to results from normal control rabbits.1
FIGURE 1.

Real-time RT-PCR of Na+/K+-ATPase subunits from LG epithelial cells of pregnant rabbits collected by LCM. Data from control rabbits is from our previous publication (used with permission).1 α1, mRNA level for α1 was predominantly localized in the ducts, and during pregnancy, its level was significantly decreased in acini and intralobular duct (p < 0.05), while its level was significantly increased in intralobar and interlobar ducts (p < 0.05). α2, mRNA level for α2 was extremely low and we were unable to detect any α2 in epithelial cells collected by LCM. β1, mRNA level for β1 from pregnant rabbits was most abundant in acini and its level was significantly decreased in intralobular and interlobar ducts (p < 0.05). β2, During pregnancy, mRNA level for β2 was most abundant in intralobular duct while least abundant in interlobar duct and its level was significantly decreased in interlobular and interlobar ducts as compared to normal controls (p < 0.05). β3, mRNA level for β3 was most abundant in intralobar and interlobar ducts, while its level was significantly reduced in acini and intralobular duct during pregnancy (p < 0.05). D4, intralobular duct; D3, interlobular duct; D2:, intralobar duct; D1, interlobar duct. Data were presented as mean ± SEM.
α2
The expression of mRNA for α2 was very low in LG from pregnant rabbits (0.00144 ± 0.00032); in fact, it was the least abundant of all subunits. Compared to the value (0.00136 ± 0.00013) from normal control rabbits,26 no significant difference was detected (p > 0.05). Furthermore, we were unable to detect the presence of α2 mRNA in epithelial cells collected by LCM.
β1
mRNA level for β1 from whole LG from pregnant rabbits was 2.721 ± 0.112, and no significant difference (p > 0.05) was detected as compared to the value (2.411 ± 0.125) from normal controls that we reported.26 However, data from LCM samples showed that mRNA for β1 was more abundant in acini than ducts (Figure 1) and was significantly lower than control animals1 in intralobular and interlobar ducts (p < 0.05).
β2
mRNA level for β2 from whole LG of pregnant rabbits was 0.018 ± 0.002 and was not significantly different (p > 0.05) from the value (0.02 ± 0.003) of control rabbits.26 mRNA from epithelial cells collected by LCM was most abundant in intralobular duct while least abundant in interlobar duct (Figure 1) and its levels were significantly lower than control animals1 in interlobular and interlobar ducts (p < 0.05).
β3
mRNA for β3 from whole LG of pregnant rabbits was 0.051 ± 0.003, a significant decrease of 18.4% (p < 0.05), as compared to the value (0.062 ± 0.003) from normal control rabbits.26 Data from LCM samples showed that mRNA for β3 was least abundant in intralobular duct (Figure 1), and its abundance was significantly lower in acini and intralobular duct (p < 0.05), as compared to control animals.1
Western Blot and Densitometry
By using immunoblotting of whole LG homogenates, we studied the expressions of α and β subunits. Densitometry analysis showed that expression of neither α1 nor α2 from pregnant rabbits was significantly different from those of normal control rabbits (Figure 2).
FIGURE 2.
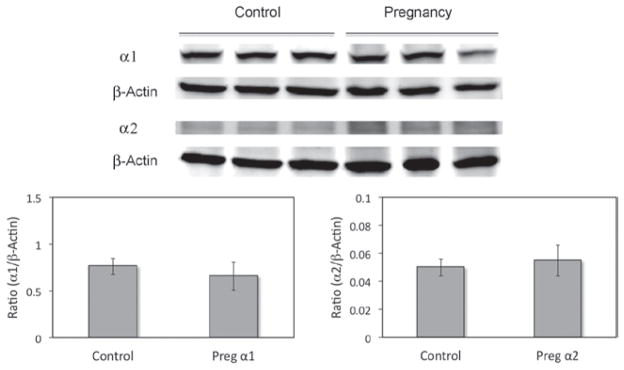
Western blots of α subunits from whole LG homogenates. No significant difference was detected in either α1 or α2 subunits between normal control and pregnant rabbits (p > 0.05). β-actin was used as loading control. Data are representative images of at least three replicates from at least 3 different animals each. Preg, pregnant.
For the three β subunits, their expressions were all significantly increased in pregnant rabbits (p < 0.05) with the increase for β1 being 26.8, 34.8% for β2, and 22.3% for β3 (Figure 3).
FIGURE 3.

Western blots of β subunits from whole LG homogenates. All β subunits were significantly increased in LG from pregnant rabbits (p < 0.05). β-actin was used as loading control. Data are representative images of at least three replicates from at least three different animals each. Preg, pregnant.
Immunofluorescence
α1
Consistent with what we reported recently,26 α1 immunoreactivity (IR) was detected in all acinar cells, although it demonstrated a “mosaic” pattern among the acini, i.e., some acini/acinar cells showed stronger α1-IR, while the intensity in other acini was weaker (Figure 4). α1-IR was found on the basolateral membranes and absent from the apical membranes. Ducts were all stained as intensely as the acinar cells showing the most intense α1-IR. In LG from pregnant rabbits, the distribution pattern of α1-IR was similar to those in the controls, and no apparent difference was detected.
FIGURE 4.
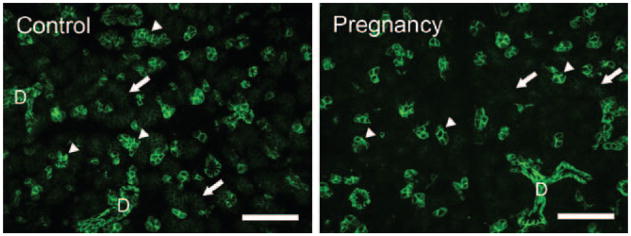
Immunofluorescence of α1-IR. Control: α1-IR (green) was present in every acinar cell, most prominently in the basolateral membranes but not on the apical membranes. The α1-IR was much stronger in some acinar cells (arrowheads) while much weaker in other acini (arrows), giving the gland a “mosaic” pattern. Ducts (D) were all stained as strong as those acinar cells showed the most intense α1-IR. Pregnancy: the distribution pattern of α1-IR in LG from pregnant rabbits was similar to that of control rabbits and no significant difference was detected. At least three control rabbits and three pregnant rabbits were stained and repeated at least three times. Scale bar = 50 μm.
α2
The distribution of α2-IR in LG from pregnant rabbits was very similar to that of control animals, i.e., minimal α2-IR was detected in acinar cells, while strong α2-IR was detected in the ducts that appeared as intense clustered punctate staining (Figure 5), results consistent with our previous report from normal control rabbits and rabbits with induced autoimmune dacryoadenitis (IAD), a model of Sjögren’s syndrome.26
FIGURE 5.
Immunofluorescence of α2-IR. Control: Intense staining of α2-IR was detected in duct cells as clustered punctate staining (arrowheads) while minimal staining was found in acinar cells (arrows). Pregnancy: In pregnant rabbits, the staining pattern of α2-IR was similar to that of control animals, i.e., α2-IR was mostly found in duct cells as clusters of punctate staining (arrowheads), while minimal staining was found in acini (arrows). No significant difference of α2-IR was observed between control and pregnant rabbits. At least three control rabbits and three pregnant rabbits were stained and repeated at least three times. Scale bar = 25 μm.
β1
For β1-IR, we found LG from pregnant rabbits showed similar results to that of normal control animals (Figure 6). Consistent with our previous reports,1,26 β1-IR was detected in the basolateral membranes of all acinar and ductal cells, but not on the apical membranes, and the level of β1-IR demonstrated a “mosaic” pattern, i.e., higher in some acinar cells and/or acini than in other acini, a pattern similar to that of α1. β1-IR in the ductal cells was much stronger, while numerous punctate staining was also present within the cytoplasm.
FIGURE 6.
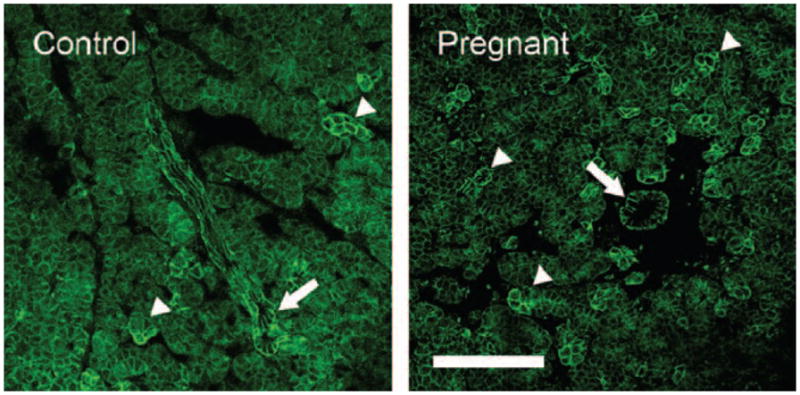
Immunofluorescence of β1-IR. Control: β1-IR was present in basolateral membranes of all acinar and ductal cells as well as numerous punctate staining within the cytoplasm. However, levels of β1-IR differed in a “mosaic” pattern, higher in some acinar cells and/or acini (arrowheads) than others. β1-IR in ductal cells was uniformly higher (arrow). Pregnant: like in control animals, β1-IR was also present in all acinar cells and demonstrated a similar “mosaic” pattern (arrowheads). Ducts also showed a much higher β1-IR (arrow). However, no significant difference of β1-IR was observed between control and pregnant animals. At least three control rabbits and three pregnant rabbits were stained and repeated at least three times. Scale bar = 50 μm.
β2
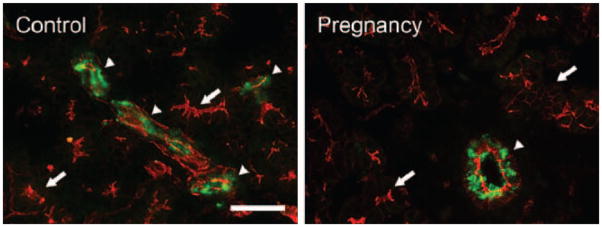
In LG from pregnant rabbits, β2-IR was detected in all acinar cells as numerous punctate staining that aggregated toward the apical cytoplasm, with much higher intensity observed in the ducts (Figure 7), a distribution pattern that was similar to that of control rabbits and consistent with our previous report.26
FIGURE 7.
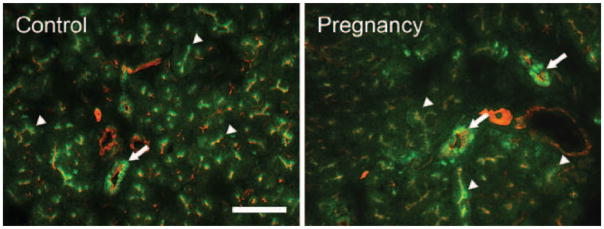
Immunofluorescence of β2-IR. Control: β2-IR (green) was present in every acinar cell as numerous punctate staining that aggregate towards the apical cytoplasm (arrowheads). The intensity of β2-IR was much higher in ducts (arrow). Pregnant: the distribution pattern of β2-IR in LG from pregnant rabbits was similar to that of control rabbits, i.e., numerous punctate β2-IR was detected in the cytoplasm of all acinar cells (arrowheads) and β2-IR was much stronger in duct cells (arrow). Red: F-actin that has been stained with rhodamine. At least three control rabbits and three pregnant rabbits were stained and repeated at least three times. Scale bar = 50 μm.
β3
For β3-IR, we found its distribution pattern was not different from that of the control rabbits, i.e., β3-IR was detected in all acinar cells in a diffuse pattern as numerous punctate staining within the cytoplasm, while minimal β3-IR was detected in the ducts (Figure 8).
FIGURE 8.
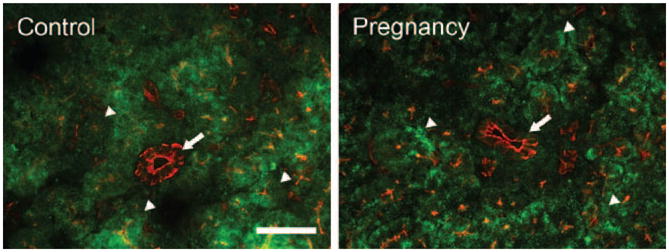
Immunofluorescence of β3-IR. Control: β 3-IR (green) was present in every acinar cell as numerous punctate staining within the cytoplasm (arrowheads) in a diffuse pattern. However, minimal β3-IR was detected in the duct cells (arrow). Pregnant: the distribution pattern of β3-IR in LG from pregnant rabbits was similar to that of control rabbits, i.e., numerous punctate β3-IR was detected in the cytoplasm of every acinar cell (arrowheads) while minimal β3-IR was present in the duct cells (arrow). Red: F-actin that has been stained with rhodamine. At least three control rabbits and three pregnant rabbits were stained and repeated at least three times. Scale bar = 50 μm.
DISCUSSION
Na+/K+-ATPase is an enzyme located in the plasma membrane of all animals. It plays an important role in maintaining resting potential, regulating cell volume, and functioning as a signal transducer to regulate MAPK pathway as well as intracellular calcium.31 The resulting Na+ gradient provides the driving force for secondary active transporters and carrier processes, e.g., intestine, kidney tubules, and exocrine glands, which power either absorption or secretion. Therefore changes of Na+/K+-ATPase have been implicated in the pathogenesis of many diseases.31
Our recent report indicated that in rabbits with IAD, a model of Sjögren’s syndrome, Na+/K+-ATPase showed changes at both gene and protein levels in the LG.26 A recent study from patients with primary Sjögren’s syndrome also showed that Na+/K+-ATPase was one of the main targets of anti-M3 IgG in salivary glands, resulting in compromised Na+/K+-ATPase activity that lead to Sjögren’s syndrome-related dry mouth.32
In accordance with our previous reports in normal control rabbits1 and rabbits with IAD,26 we demonstrated the presence of all five subunits of Na+/K+-ATPase in the LG of pregnant rabbits, with α1 being the dominant α subunit and β1 being the dominant β subunit. Ductal cells also demonstrated intense staining with both α1 and β1. These results were generally in agreement with earlier studies that documented the presence and importance of Na+/K+-ATPase in LG of rats7,20,27–30 and rabbits.1,3,8,19–25,33
Recent reports indicate that women with one or more pregnancies have an increased risk of having Sjögren’s syndrome.12,13 Our own epidemiological study also indicated that some pregnant women experience increased symptoms of dry eye during the third trimester of their pregnancies.11 We have also found that many pregnant rabbits demonstrated typical clinical symptoms of dry eye,16,17 e.g., decreased Schirmer’s test score and tear break-up time as well as increased Rose Bengal staining. Basal LG fluid production was also found reduced in pregnant rabbits, while pilocarpine stimulated secretion rate increased and protein concentration decreased.15 Therefore, pregnancy, as a normal physiological state, appears to be a natural model for LG deficiency and dry eye studies.
In the pregnant rabbit model we presented here, real time RT-PCR results demonstrated changes of mRNA for Na+/K+-ATPase subunits in both acini and ducts as compared to control rabbits.1 Western blot also indicated that the expressions of all three β subunits were increased during pregnancy. The substantial presence of Na+/K+-ATPase in ductal cells and their changes during pregnancy suggest active Na+ and K+ transport in the ductal cells and their potential contribution to pregnancy-related LG secretion changes and dry eye symptoms. It should be noted that although up to 15% of all LG epithelial cells are ductal cells,34–36 most LG studies have focused on acinar cells which represent ~80% of all epithelial cells and only a few have paid sufficient attention to the duct system.1,3,7,9,37,38
Our whole LG mRNA results showed only β3 subunit decrease in pregnant rabbits while LCM data displayed decreases among all the beta subunits in various duct segments. This differential expression of the β subunits demonstrates the variability of each duct segment’s contribution towards the final tear fluid. The apparent discrepancy between our whole LG western blot which demonstrated increases in all beta subunits as opposed to the decreases we saw in our whole LG mRNA and LCM results, a phenomenon common in many organ systems, could be the result of a number of mechanisms such as disruption in protein translation and post-translational modification.39,40 Protein and mRNA expression often only have a low to moderate correlation, and higher protein expression also does not necessarily correlate with increased function. Therefore more studies of the functional aspect of Na+/K+-ATPase in the LG are needed to identify the exact effect of its varying expression during dry eye.
The profound changes of hormone levels experienced during the course of pregnancy likely play a role in the substantial changes of Na+/K+-ATPase and subsequent LG functional status that contribute to the alterations of LG fluid secretion and dry eye symptoms.11,15,17 Sex hormones changes, e.g., androgens, have been well documented to play a role in dry eye.10,30,41,42 In pregnant rabbits, LG undergoes an immunophysiological transformation similar to that of the mammary gland as it prepares to deliver milk-prolactin immunoreactivity in the ductal cell increases and redistributes from the apical to basolateral cytoplasm.43,44 Other reports also showed that lymphocytes in the rabbit LG redistribute from their normal periductal foci to the interacinar space during pregnancy.15,43
In addition to LG, pregnancy-related Na+/K+-ATPase changes have also been documented in other tissues and organs.45 In women with pregnancy-induced hypertension, Na+/K+-ATPase activity in red blood cells was increased and may be linked to the increased numbers of Na+/K+-ATPase or its active subunits.46 Defects in Na+/K+-ATPase expression and activity were also reported in women with pregnancy and preeclampsia.47
In addition to pregnancy, the endocrine and neural systems also have great influence on Na+/K+-ATPase expression in LG. In female rat with hypophysectomy, LG showed rapid atrophy with total Na+/K+-ATPase activity reduced by half while dihydrotestosterone and prolactin treatment partially restored its activity.30 In rabbits with ovariectomy, however, dihydrotestosterone treatment increased Na+/K+-ATPase activity by 29%, while the synthetic estrogen diethylstilbestrol decreased total Na+/K+-ATPase by 12%.24 Cholinergic stimulation in rat caused translocation of Na+/K+-ATPase from intracellular pools to basolateral membranes20 while in rabbit acinar cells it caused a decrease of total content of Na+/K+-ATPase25 and its redistribution from cytoplasmic reserves to basolateral membranes.19–21
In summary, our findings revealed changes within the LGs of pregnant rabbits in mRNA and protein expressions of Na+/K+-ATPase in both acinar and ductal cells that suggest functional changes of this protein may contribute to changes of LG secretion and dry eye symptoms. More functional studies are certainly required to identify how the changes in each duct segment as well as in the acini during pregnancy contribute towards dry eye.
Acknowledgments
The authors thank Austin Mircheff, Joel Schechter, Yanru Wang, Leili Parsa, and Tamako Nakamura for their expert comments and excellent technical support.
Footnotes
Declaration of interest: This work was supported by NIH grants EY017731 (CD) and EY03040.
References
- 1.Ding C, Parsa L, Nandoskar P, Zhao P, Wu K, Wang Y. Duct system of the rabbit lacrimal gland: structural characteristics and role in lacrimal secretion. Invest Ophthalmol Vis Sci. 2010;51:2960–2967. doi: 10.1167/iovs.09-4687. [DOI] [PMC free article] [PubMed] [Google Scholar]
- 2.Mircheff AK. Lacrimal fluid and electrolyte secretion: a review. Curr Eye Res. 1989;8:607–617. doi: 10.3109/02713688908995761. [DOI] [PubMed] [Google Scholar]
- 3.Dartt DA, Møller M, Poulsen JH. Lacrimal gland electrolyte and water secretion in the rabbit: localization and role of (Na+ +K+)-activated ATPase. J Physiol (Lond) 1981;321:557–569. doi: 10.1113/jphysiol.1981.sp014002. [DOI] [PMC free article] [PubMed] [Google Scholar]
- 4.Herok GH, Millar TJ, Anderton PJ, Martin DK. Characterization of an inwardly rectifying potassium channel in the rabbit superior lacrimal gland. Invest Ophthalmol Vis Sci. 1998;39:308–314. [PubMed] [Google Scholar]
- 5.Herok GH, Millar TJ, Anderton PJ, Martin DK. Role of chloride channels in regulating the volume of acinar cells of the rabbit superior lacrimal gland. Invest Ophthalmol Vis Sci. 2008;49:5517–5525. doi: 10.1167/iovs.07-0435. [DOI] [PubMed] [Google Scholar]
- 6.Walcott B, Birzgalis A, Moore LC, Brink PR. Fluid secretion and the Na+-K+-2Cl− cotransporter in mouse exorbital lacrimal gland. Am J Physiol, Cell Physiol. 2005;289:C860–C867. doi: 10.1152/ajpcell.00526.2004. [DOI] [PubMed] [Google Scholar]
- 7.Ubels JL, Hoffman HM, Srikanth S, Resau JH, Webb CP. Gene expression in rat lacrimal gland duct cells collected using laser capture microdissection: evidence for K+ secretion by duct cells. Invest Ophthalmol Vis Sci. 2006;47:1876–1885. doi: 10.1167/iovs.05-0363. [DOI] [PubMed] [Google Scholar]
- 8.Selvam S, Thomas PB, Gukasyan HJ, Yu AS, Stevenson D, Trousdale MD, et al. Transepithelial bioelectrical properties of rabbit acinar cell monolayers on polyester membrane scaffolds. Am J Physiol, Cell Physiol. 2007;293:C1412–C1419. doi: 10.1152/ajpcell.00200.2007. [DOI] [PubMed] [Google Scholar]
- 9.Tóth-Molnár E, Venglovecz V, Ozsvári B, Rakonczay Z, Jr, Varró A, Papp JG, et al. New experimental method to study acid/base transporters and their regulation in lacrimal gland ductal epithelia. Invest Ophthalmol Vis Sci. 2007;48:3746–3755. doi: 10.1167/iovs.06-1291. [DOI] [PubMed] [Google Scholar]
- 10.Sullivan DA. Tearful relationships? Sex, hormones, the lacrimal gland, and aqueous-deficient dry eye. Ocul Surf. 2004;2:92–123. doi: 10.1016/s1542-0124(12)70147-7. [DOI] [PubMed] [Google Scholar]
- 11.Wong J, Ding C, Yiu S, Smith R, Goodwin T, Schechter JE. An epidemiological study of pregnancy and dry eye. Ocul Surf. 2004;3:S127. [Google Scholar]
- 12.Priori R, Medda E, Conti F. Risk factors for Sjogren’s syndrome: an Italian case-control study. IX International Symposium on Sjogren’s Syndrome; Washington, DC. April 27–29, 2006; p. 64. [Google Scholar]
- 13.Priori R, Medda E, Conti F, Cassarà EA, Sabbadini MG, Antonioli CM, et al. Risk factors for Sjögren’s syndrome: a case-control study. Clin Exp Rheumatol. 2007;25:378–384. [PubMed] [Google Scholar]
- 14.Pflugfelder SC, Tseng SC, Sanabria O, Kell H, Garcia CG, Felix C, et al. Evaluation of subjective assessments and objective diagnostic tests for diagnosing tear-film disorders known to cause ocular irritation. Cornea. 1998;17:38–56. doi: 10.1097/00003226-199801000-00007. [DOI] [PubMed] [Google Scholar]
- 15.Ding C, Chang N, Fong YC, Wang Y, Trousdale MD, Mircheff AK, et al. Interacting influences of pregnancy and corneal injury on rabbit lacrimal gland immunoarchitecture and function. Invest Ophthalmol Vis Sci. 2006;47:1368–1375. doi: 10.1167/iovs.05-1034. [DOI] [PubMed] [Google Scholar]
- 16.Ding C, Wang Y, Zhu Z, Wong J, Yiu SC, Mircheff AK, Schechter JE. Pregnancy and the lacrimal gland: where have all the hormones gone? Invest Ophthalmol Vis Sci. 2005;46(Suppl) ARVO abstract. [Google Scholar]
- 17.Ding C, Lu M, Huang J. Changes of the ocular surface and aquaporins in the lacrimal glands of rabbits during pregnancy. Mol Vis. 2011;17:2847–2855. [PMC free article] [PubMed] [Google Scholar]
- 18.Kaplan JH. Biochemistry of Na, K-ATPase. Annu Rev Biochem. 2002;71:511–535. doi: 10.1146/annurev.biochem.71.102201.141218. [DOI] [PubMed] [Google Scholar]
- 19.Yiu SC, Lambert RW, Bradley ME, Ingham CE, Hales KL, Wood RL, et al. Stimulation-associated redistribution of Na, K-ATPase in rat lacrimal gland. J Membr Biol. 1988;102:185–194. doi: 10.1007/BF01925712. [DOI] [PubMed] [Google Scholar]
- 20.Yiu SC, Lambert RW, Tortoriello PJ, Mircheff AK. Secretagogue-induced redistributions of Na, K-ATPase in rat lacrimal acini. Invest Ophthalmol Vis Sci. 1991;32:2976–2984. [PubMed] [Google Scholar]
- 21.Lambert RW, Maves CA, Mircheff AK. Carbachol-induced increase of Na+/H+ antiport and recruitment of Na+, K(+)-ATPase in rabbit lacrimal acini. Curr Eye Res. 1993;12:539–551. doi: 10.3109/02713689309001832. [DOI] [PubMed] [Google Scholar]
- 22.Bradley ME, Azuma KK, McDonough AA, Mircheff AK, Wood RL. Surface and intracellular pools of Na, K-ATPase catalytic and immuno-activities in rat exorbital lacrimal gland. Exp Eye Res. 1993;57:403–413. doi: 10.1006/exer.1993.1141. [DOI] [PubMed] [Google Scholar]
- 23.Gierow JP, Yang T, Bekmezian A, Liu N, Norian JM, Kim SA, et al. Na-K-ATPase in lacrimal gland acinar cell endosomal system: correcting a case of mistaken identity. Am J Physiol. 1996;271:C1685–C1698. doi: 10.1152/ajpcell.1996.271.5.C1685. [DOI] [PubMed] [Google Scholar]
- 24.Azzarolo AM, Mircheff AK, Kaswan RL, Stanczyk FZ, Gentschein E, Becker L, et al. Androgen support of lacrimal gland function. Endocrine. 1997;6:39–45. doi: 10.1007/BF02738800. [DOI] [PubMed] [Google Scholar]
- 25.Yang T, Zeng H, Zhang J, Okamoto CT, Warren DW, Wood RL, et al. Stimulation with carbachol alters endomembrane distribution and plasma membrane expression of intracellular proteins in lacrimal acinar cells. Exp Eye Res. 1999;69:651–661. doi: 10.1006/exer.1999.0742. [DOI] [PubMed] [Google Scholar]
- 26.Ding C, Lu M, Huang J. Na(+)/K(+)-ATPase in the lacrimal glands of rabbits and its changes during induced autoimmune dacryoadenitis. Mol Vis. 2011;17:2368–2379. [PMC free article] [PubMed] [Google Scholar]
- 27.Wood RL, Mircheff AK. Apical and basal-lateral Na/K-ATPase in rat lacrimal gland acinar cells. Invest Ophthalmol Vis Sci. 1986;27:1293–1296. [PubMed] [Google Scholar]
- 28.Dipolo R, Marty A. Measurement of Na-K pump current in acinar cells of rat lacrimal glands. Biophys J. 1989;55:571–574. doi: 10.1016/S0006-3495(89)82850-4. [DOI] [PMC free article] [PubMed] [Google Scholar]
- 29.Okami T, Yamamoto A, Takada T, Omori K, Uyama M, Tashiro Y. Ultrastructural localization of Na+, K(+)-ATPase in the exorbital lacrimal gland of rat. Invest Ophthalmol Vis Sci. 1992;33:196–204. [PubMed] [Google Scholar]
- 30.Azzarolo AM, Bjerrum K, Maves CA, Becker L, Wood RL, Mircheff AK, et al. Hypophysectomy-induced regression of female rat lacrimal glands: partial restoration and maintenance by dihydrotestosterone and prolactin. Invest Ophthalmol Vis Sci. 1995;36:216–226. [PubMed] [Google Scholar]
- 31.Roberts Michael, Reiss Michael, Monger Grace. Advanced Biology. Cheltenham, United Kingdom: Nelson Thornes; 2000. [Google Scholar]
- 32.Passafaro D, Reina S, Sterin-Borda L, Borda E. Cholinergic autoantibodies from primary Sjögren’s syndrome modulate submandibular gland Na+/K+-ATPase activity via prostaglandin E2 and cyclic AMP. Eur J Oral Sci. 2010;118:131–138. doi: 10.1111/j.1600-0722.2010.00716.x. [DOI] [PubMed] [Google Scholar]
- 33.Botelho SY, Fuenmayor N. Lacrimal gland flow and potentials during dinitrophenol, ouabain, and ethacrynic acid perfusion. Invest Ophthalmol Vis Sci. 1981;20:515–521. [PubMed] [Google Scholar]
- 34.Hisada M, Botelho SY. Membrane potentials of in situ lacrimal gland in the cat. Am J Physiol. 1968;214:1262–1267. doi: 10.1152/ajplegacy.1968.214.6.1262. [DOI] [PubMed] [Google Scholar]
- 35.Herzog V, Sies H, Miller F. Exocytosis in secretory cells of rat lacrimal gland. Peroxidase release from lobules and isolated cells upon cholinergic stimulation. J Cell Biol. 1976;70:692–706. doi: 10.1083/jcb.70.3.692. [DOI] [PMC free article] [PubMed] [Google Scholar]
- 36.Parod RJ, Putney JW., Jr An alpha-adrenergic receptor mechanism controlling potassium permeability in the rat lacrimal gland acinar cell. J Physiol (Lond) 1978;281:359–369. doi: 10.1113/jphysiol.1978.sp012427. [DOI] [PMC free article] [PubMed] [Google Scholar]
- 37.Ding C, Huang J, Macveigh-Aloni M, Lu M. Not all lacrimal epithelial cells are created equal-heterogeneity of the rabbit lacrimal gland and differential secretion. Curr Eye Res. 2011;36:971–978. doi: 10.3109/02713683.2011.602814. [DOI] [PMC free article] [PubMed] [Google Scholar]
- 38.Mircheff AK. Water and electrolyte secretion and fluid modification. In: Albert DM, Jakobiec FA, editors. Chapter 29 - Principles and practice of ophthalmology. Philadelphia: W.B. Saunders; 1994. pp. 466–472. [Google Scholar]
- 39.Ebrahimi M, Roudkenar MH, Imani Fooladi AA, Halabian R, Ghanei M, Kondo H, et al. Discrepancy between mRNA and Protein Expression of Neutrophil Gelatinase-Associated Lipocalin in Bronchial Epithelium Induced by Sulfur Mustard. J Biomed Biotechnol. 2010;2010:823131. doi: 10.1155/2010/823131. [DOI] [PMC free article] [PubMed] [Google Scholar]
- 40.Fu N, Drinnenberg I, Kelso J, Su J-R, Pääbo S, Zeng R, et al. Comparison of protein and mRNA expression evolution in humans and chimpanzees. PLoS ONE. 2007;2:e216. doi: 10.1371/journal.pone.0000216. [DOI] [PMC free article] [PubMed] [Google Scholar]
- 41.Sullivan DA. Hormonal influence on the secretory immune system of the eye. In: Freir S, editor. The Neuroendocrine-Immune Network. Boca Raton, FL: CRC Press Inc; 1990. [Google Scholar]
- 42.Azzarolo AM, Wood RL, Mircheff AK, Richters A, Olsen E, Berkowitz M, et al. Androgen influence on lacrimal gland apoptosis, necrosis, and lymphocytic infiltration. Invest Ophthalmol Vis Sci. 1999;40:592–602. [PubMed] [Google Scholar]
- 43.Schechter J, Carey J, Wallace M, Wood R. Distribution of growth factors and immune cells are altered in the lacrimal gland during pregnancy and lactation. Exp Eye Res. 2000;71:129–142. doi: 10.1006/exer.2000.0859. [DOI] [PubMed] [Google Scholar]
- 44.Schechter JE, Pidgeon M, Chang D, Fong YC, Trousdale MD, Chang N. Potential role of disrupted lacrimal acinar cells in dry eye during pregnancy. Adv Exp Med Biol. 2002;506:153–157. doi: 10.1007/978-1-4615-0717-8_20. [DOI] [PubMed] [Google Scholar]
- 45.Johansson M, Karlsson L, Wennergren M, Jansson T, Powell TL. Activity and protein expression of Na+/K+ ATPase are reduced in microvillous syncytiotrophoblast plasma membranes isolated from pregnancies complicated by intrauterine growth restriction. J Clin Endocrinol Metab. 2003;88:2831–2837. doi: 10.1210/jc.2002-021926. [DOI] [PubMed] [Google Scholar]
- 46.Kaur G, Kapoor N, Mohan P, Sri Nageswari K, Singh MJ, Prasad R. Alteration in ouabain-sensitive sodium potassium pump of erythrocytes during pregnancy induced hypertension: a kinetic study. J Biochem Mol Biol Biophys. 2002;6:163–166. doi: 10.1080/1025814021000000899. [DOI] [PubMed] [Google Scholar]
- 47.Graves SW. Sodium regulation, sodium pump function and sodium pump inhibitors in uncomplicated pregnancy and preeclampsia. Front Biosci. 2007;12:2438–2446. doi: 10.2741/2245. [DOI] [PubMed] [Google Scholar]