

Abstract
To examine the role of intracellular labile iron pool (LIP), ferritin (Ft), and antioxidant defence in cellular resistance to oxidative stress on chronic adaptation, a new H2O2-resistant Jurkat T cell line “HJ16” was developed by gradual adaptation of parental “J16” cells to high concentrations of H2O2. Compared to J16 cells, HJ16 cells exhibited much higher resistance to H2O2-induced oxidative damage and necrotic cell death (up to 3 mM) and had enhanced antioxidant defence in the form of significantly higher intracellular glutathione and mitochondrial ferritin (FtMt) levels as well as higher glutathione-peroxidase (GPx) activity. In contrast, the level of the Ft H-subunit (FtH) in the H2O2-adapted cell line was found to be 7-fold lower than in the parental J16 cell line. While H2O2 concentrations higher than 0.1 mM fully depleted the glutathione content of J16 cells, in HJ16 cells the same treatments decreased the cellular glutathione content to only half of the original value. In HJ16 cells, H2O2 concentrations higher than 0.1 mM increased the level of FtMt up to 4-fold of their control values but had no effect on the FtMt levels in J16 cells. Furthermore, while the basal cytosolic level of LIP was similar in both cell lines, H2O2 treatment substantially increased the cytosolic LIP levels in J16 but not in HJ16 cells. H2O2 treatment also substantially decreased the FtH levels in J16 cells (up to 70% of the control value). In contrast in HJ16 cells, FtH levels were not affected by H2O2 treatment. These results indicate that chronic adaptation of J16 cells to high concentrations of H2O2 has provoked a series of novel and specific cellular adaptive responses that contribute to higher resistance of HJ16 cells to oxidative damage and cell death. These include increased cellular antioxidant defence in the form of higher glutathione and FtMt levels, higher GPx activity, and lower FtH levels. Further adaptive responses include the significantly reduced cellular response to oxidant-mediated glutathione depletion, FtH modulation, and labile iron release and a significant increase in FtMt levels following H2O2 treatment.
Abbreviations: Apaf-1, apoptosis protease activating factor-1; BSA, bovine serum albumin; BSO, buthionine-[S,R]sulfoximine; CA-AM, calcein-acetoxymethyl ester; CA-Fe, CA-bound iron; CM, conditioned media; DFO, desferrioxamine mesylate; DMSO, dimethyl sulfoxide; DPBS, Dulbecco’s phosphate-buffered saline; DTNB, 5,5'-dithiobis(2-nitrobenzoic acid); EDTA, ethylenediaminetetraacetic acid; ELISA, enzyme-linked immunosorbent assay; FBS, fetal bovine serum; Ft, ferritin; FtH, ferritin heavy chain; FtL, ferritin light chain; FtMt, mitochondrial ferritin; GPx, glutathione peroxidase; GR, glutathione reductase; GSH, reduced glutathione; h, hour(s); H2O2, hydrogen peroxide; IR, ionizing radiation; IRP, iron regulatory protein; Kd, dissociation constant; LIP, labile iron pool; LL, lower left quadrant; min, minute(s); NADPH, reduced nicotinamide adenine dinucleotide phosphate; NR, neutral red; ·OH, hydroxyl radical; PI, propidium iodide; PNG, glucose-free EMEM media containing pyruvate; RA, rheumatoid arthritis; ROS, reactive oxygen species; SD, standard deviation; SFM, serum-free media; SIH, salicylaldehyde isonicotinoyl hydrazone; TBHP, tert-butyl-hydroperoxide; TfR, transferrin receptor; UVA, ultraviolet A
Keywords: Oxidative stress, Labile iron, Ferritin, Mitochondrial ferritin, Necrosis, Hydrogen peroxide, Desferrioxamine, Lysosomes, Mitochondria, ATP, T cell
Highlights
-
•
We developed a new H2O2-resistant Jurkat T cell line by chronic adaptation to H2O2.
-
•
Cells displayed higher glutathione and mitochondrial ferritin levels but lower ferritin.
-
•
Cells possessed higher glutathione peroxidase but not higher catalase activity.
-
•
Cells had reduced response to H2O2-mediated glutathione depletion and iron release.
-
•
Cells acquired higher mitochondrial ferritin levels following H2O2 treatment.
Introduction
The response of cells to either an acute (single high dose) or chronic (repeated low/moderate doses) exposure to oxidising agents is quite different. Depending on the degree of the oxidising insult, acute exposure could trigger a series of intracellular antioxidant defence mechanisms that counteract the damage caused but if these are not sufficient, cells will die by apoptosis or necrosis, again depending on the extent of the oxidative insult [1,2]. In chronically exposed cells, it is anticipated that the antioxidant defence mechanism will be altered as repeated exposure of cells to oxidants usually provokes the development of a series of adaptive responses that are distinct from those following acute exposure. Because of such adaptive responses, cells may withstand high toxic doses of the oxidising agent that would otherwise be lethal. Excess production of reactive oxygen species (ROS) has been implicated in progression of cardiovascular, neurodegenerative, and chronic inflammatory diseases as well as cancer and aging [2–7]. The study of the mechanisms underlying the adaptive responses of cells to oxidising agents should provide clues to understanding the promotion and progression of such disorders.
The involvement of hydrogen peroxide (H2O2) in numerous types of cell and tissue injury is well-documented [8–12]. Although H2O2 itself has low reactivity toward cell constituents, it is capable of forming potent ROS in the presence of trace amounts of catalytic labile iron via Fenton chemistry. The potentially toxic labile iron exists in cells as a transit pool of catalytically active iron complexes which is distinct from intracellular iron associated with proteins and is known as the labile iron pool (LIP). Iron belonging to this pool is considered to be in steady-state equilibrium, loosely bound to low-molecular-weight compounds, accessible to permeant chelators, and metabolically and catalytically reactive [13]. Under physiological conditions, cells protect themselves either by the H2O2-degrading enzymes catalase and glutathione peroxidase (GPx) [14] or by minimising the intracellular level of potentially harmful redox-active LIP via the cytosolic iron regulatory proteins 1 and 2 (i.e., IRP-1 and IRP-2) which function as posttranscriptional regulators of both iron uptake via transferrin receptor (TfR) and iron sequestration by the iron-storage protein, ferritin (Ft) [15,16]. However under pathological conditions including acute oxidative stress, these conventional cellular defences are often insufficient, because the system is overwhelmed either by an increase in H2O2 formation [10,17,18] and/or by an excess presence of labile iron [16,19]. The increase in intracellular LIP in oxidative stress conditions such as short exposure to H2O2 and the damaging effect of iron-catalysed oxidative damage has been shown in numerous cellular and animal studies [19–27].
Under physiological conditions, most of the iron that is not metabolised is stored in Ft. Ft is an ubiquitously expressed cytosolic iron-storage protein that forms a hetero-oligomeric protein shell composed of two different subunits, ferritin heavy chain (FtH) with ferroxidase activity and ferritin light chain (FtL) that promotes iron nucleation [28,29]. Ft plays a dual role in LIP homeostasis, acting on the one hand as an iron-sequestering protein and on the other hand as a potential source of labile iron [8,30]. The characterisation of cellular models in which Ft expression is modulated has shown that the ferroxidase catalytic site of the FtH has a central role in regulating iron availability. In turn, this has secondary effects on a number of cellular activities, which include proliferation and resistance to oxidative damage [28,29]. Iron is also liberated from Ft as a consequence of normal turnover in lysosomal compartments, where it is thought to be recycled for synthesis of new iron-containing proteins [31,32]. This source of LIP has been shown to be active in the cell-damaging processes caused by oxidative stress in the form of H2O2 or ultraviolet A (UVA, 320–400 nm) radiation, promoting lysosomal rupture and release of potent hydrolytic enzymes to the cytosol [20,33,34] which in turn leads to both proteolytic degradation of cytosolic proteins notably Ft and secondary secondary harm to various cellular constituents notably mitochondrial injury leading to apoptotic or necrotic cell death (depending on the extent of insult) [21,35].
The existence of a storage protein inside mitochondria, called mitochondrial ferritin (FtMt), has been shown to protect the mitochondria of cells from iron-dependent oxidative damage [29,36]. It has been suggested that the primary function of FtMt is the control of ROS formation through the regulation of mitochondrial iron availability, which results in a cytoprotective effect [29]. In HeLa cells, FtMt overexpression has been shown to protect the cells against H2O2-induced cytochrome c release from mitochondria and reduction of the activity of the mitochondrial Fe/S enzymes [37]. The cytoprotective function of FtMt has also been linked to its iron-sequestering activity capable of reducing the size of cytosolic and mitochondrial LIP, both of which catalyse oxidative damage under oxidative stress conditions [8,37–40].
In this study, we used a cell model composed of two human Jurkat T cell lines (parental, J16; H2O2-resistant, HJ16) to assess the mechanisms underlying the increased cellular resistance that occurs after chronic adaptation to oxidative stress. The possible role of LIP, Ft, and FtMt in increasing the resistance of cells to H2O2 was also investigated.
Materials and methods
Materials
Cell culture materials were obtained from Gibco (Germany) except for fetal bovine serum (FBS) (PAA Laboratories, Austria) and RPMI-1640 medium (Promocell, Germany). All chemicals were from Sigma-Aldrich Chemical (Poole, UK) except protease inhibitor cocktail tablets, Annexin-V-FLUOS, bovine serum albumin (BSA) that was supplied from Roche (Mannheim, Germany), glutathione reductase (GR), H2O2 solution, and Mowiol 4-88 from Calbiochem (CN Biosciences LTD, Nottingham), dimethyl sulfoxide (DMSO) from VWR International Ltd (Leicestershire, England), DPBS (Dulbecco’s phosphate-buffered saline with Ca2+ and Mg2+) from Cambrex (Belgium), cathepsin B antibody from Santa Cruz Biotechnology, Inc. (Santa Cruz, California), calcein-acetoxymethyl ester (CA-AM) and LysoSensor Green DND-153 from Molecular Probes (Leiden, Netherlands), and an ApoGlow assay kit from Lumitech (UK). Salicylaldehyde isonicotinoyl hydrazone (SIH) was a kind gift from Dr James Dowden (Department of Pharmacy and Pharmacology, Bath University, Bath, UK).
Cell culture
The Jurkat J16 cells are a human T-cell leukemia cell line. The polyclonal H2O2-resistant cell line “HJ16” was derived from the J16 cell line after gradual adaptation to 3 mM H2O2. For this purpose, the J16 cell culture was diluted in serum-free RPMI at a density of 1×10⁶ cells/ml. Cells were then treated with H2O2 at a concentration determined by their tolerance (generally a concentration of H2O2 causing over 60% cell death), and incubated at 37 °C for 2 h. After this time, cells were harvested by centrifugation (350 g, 5 min) and resuspended in an equal volume of 10% FBS RPMI. After 18 h incubation, cell numbers and survival were determined using trypan blue exclusion on a hematocytometer. This protocol was repeated every 2–3 weeks, depending on recovered cell numbers, with increasing concentrations of H2O2 over a period of 6 months. An H2O2-tolerant cell line (up to a dose of 3 mM) was designated HJ16. Stocks of HJ16 cells were stored in liquid nitrogen and defrosted when needed. Both cell lines were cultured routinely in RPMI-1640 medium supplemented with 10% v/v heat inactivated FBS, 2.7% w/v sodium bicarbonate, 2 mM L-glutamine, and 50 IU/ml of penicillin and streptomycin.
We also attempted to isolate highly resistant clones for comparison. However our attempts failed to identify clones that had higher resistance to a H2O2 concentration of 3 mM than the polyclonal HJ16 cell line (data not shown). For this reason and the time-consuming nature of the clonal expansion, in the present study, we concentrated our efforts to perform an in-depth characterization of the polyclonal HJ16 cell line.
Treatments
H2O2 treatments (0.05–3 mM) were performed in serum-free media (SFM) for 30 min at 37 °C. Following the treatment, cells were resuspended and incubated in the conditioned media (CM) for 4 or 24 h at 37 °C prior to experimentation. Buthionine-[S,R]sulfoximine (BSO) treatments (2–250 µM) were carried out in CM for 18 h at 37 °C prior to experimentation. Desferrioxamine mesylate (DFO) treatment (100 µM) was carried in CM for 18 h at 37 °C prior to experimentation.
Flow cytometry
The percentages of apoptotic and necrotic cells from a minimum of 10,000 cells (events) were scored after dual staining of cells with propidium iodide (PI) and Annexin-V-FLUOS staining by flow cytometry using the FACS vantage (Becton Dickinson) as described previously [21].
ATP measurement
The ATP concentrations in cells were determined luminometrically using an ApoGlow assay kit (Lumitech, UK) as described previously [21]. Briefly prior to experiments, cells were resuspended in serum- and glucose-free EMEM media containing 2 mM pyruvate (PNG medium) to allow oxidative phosphorylation. After adaptation to this medium (45 min), cells were resuspended in serum-free RPMI and exposed to various H2O2 doses and ATP concentrations in cells were determined in a Streptech (UK) luminometer at 4 or 24 h following H2O2 treatments.
Lysosensor immunofluorescence and cathepsin B immunocytochemistry
For Lysosensor immunofluorescence, cells were treated with LysoSensor Green DND-153 (1 µM) for 2 h at 37 °C as described previously [20]. Cathepsin B immunocytochemistry was performed using cathepsin B antibody (dilution 1:100) and the secondary FITC-conjugated goat anti-rabbit IgG antibody (Sigma, F9887; dilution 1:100 ) as described previously [41]. After either Lysosensor treatment or cathepsin B immunocytometry, cells were analysed by confocal laser scanning microscope LSM 510 with a Plan-Apochromat 63 x /1.40 oil DIC objective (Carl Zeiss, Germany) (excitation at 488 nm; emission at 505 nm).
Neutral red uptake assay
For neutral red (NR) assay, cells were first washed with PBS and then incubated for 1.5 h at 37 °C with 2 ml of the NR dye (0.4% W/V) in 10% FBS-RPMI medium. Following centrifugation, cells were fixed with the fixing solution (40% v/v formaldehyde + 10% w/v CaCl2) for 1 min and then lysed with lysis buffer (1% v/v acetic acid + 50% v/v ethanol). The absorbance was measured at 540 nm by VERSAmax plate reader (Molecular devices, California).
LIP determination by fluorescence calcein assay (CA assay)
The determination of the absolute level of cytosolic “LIP,” that is operationally defined as the sum of the cytosolic level of CA-bound iron (i.e., [CA-Fe]) and free iron (i.e., [Fe] unbound to CA), the cell-dependent dissociation constant (Kd) for CA-Fe was determined as described previously [13,21].
Ft/FtMt ELISA
The cytosolic Ft and FtMt were determined by means of elisa (enzyme-linked immunosorbent assay) as described by Santambrogio et al. [36,42]. The antibodies used were monoclonal-specific FtH (i.e., rH02), FtL (i.e., LF03), or mouse polyclonal FtMt-specific MoαHuFtMt and their HRP-labeled equivalents (LF03-HRP 1:3000, rH02-HRP 1:15000, MoαHuFtMt-HRP 1:6000). The peroxidase activity was developed with o-phenylenediamine dihydrochloride. Protein measurements were determined by the Bradford assay [43]. The results were expressed as nanogram Ft (FtH or FtL) or FtMt per milligram protein.
Glutathione measurement
Total intracellular glutathione after various treatments was measured according to the spectrophotometric method developed by Tietze [44] as described previously [14]. This method is an enzymatic recycling procedure which offers a high sensitivity rate. Glutathione is assayed by a system in which it is readily oxidised by DTNB [5,5'-dithiobis(2-nitrobenzoic acid)] and reduced by NADPH (i.e., reduced form of nicotinamide adenine dinucleotide phosphate) in the presence of GR. The rate of 2-nitro-5-thiobenzoic acid formation is monitored and the level of intracellular glutathione equivalents in cells is determined by the comparison of the result with a standard curve with the known amounts of glutathione. The total intracellular glutathione was normalised by total cellular protein using the Bradford assay.
Catalase activity measurement
Catalase activity in both normal and H2O2-resistant cells was quantified by the direct measurement of H2O2 consumption as described by Moysan et al. [45] and Pourzand et al. [14]. Catalase activity was normalised to sample protein content by the Bradford assay and expressed as Unit per milligram (U/mg) protein. One unit (U) is defined as 1 µmol H2O2 consumed per minute.
GPx activity measurement
The GPx activity in both normal and H2O2-resistant cells was measured according to the method developed by Flohe and Günzler [46], with a few modifications. Briefly, 1×10⁶ cells were lysed in 500 µl of lysis buffer (100 mM Tris-HCl, 300 mM KCl, 0.1% v/v peroxide-free Triton X-100, pH 7.6) by sonication. The cells were then pelleted by centrifugation and the clear supernatant was collected. A test mix containing 100 mM Tris-HCl (pH 7.6), 5 mM EDTA, 3 mM reduced glutathione (GSH), 0.2 mM NADPH, 0.1% v/v Triton X-100, and 600 mU/ml GR was prepared and preincubated at 37 °C for 10 min. The reaction was started by the addition of 10 µl tert-butyl hydroperoxide (TBHP, 50 µM final concentration) and the NADPH consumption rate was spectrophotometrically measured at 340 nm for 5 min. GPx activity was normalised to sample protein content by the Bradford assay (expressed as U/mg protein). One unit was defined as 1 µmol NADPH oxidised per minute.
Statistical analysis
Results were expressed as the mean ± standard deviation (SD). Significant differences (P < 0.05) were determined by either paired or unpaired t test after one-way analysis of variance.
Results
Determination of the level of H2O2resistance
To evaluate the levels of resistance of J16 and HJ16 cells to H2O2, the levels of apoptotic and necrotic cell death were scored by flow cytometry using the dual Annexin-V/PI staining method. For this purpose, cells were first treated with H2O2 up to a final concentration of 3 mM and then incubated for 4 or 24 h at 37 °C prior to analysis by flow cytometry. An example of such analysis is illustrated in Fig. 1A. In this example J16 and HJ16 cell lines were either untreated or treated with H2O2 concentrations of 0.5 and 3 mM. As displayed in Fig. 1A, the parental J16 cells were much more sensitive to H2O2 treatment than the H2O2-adapted HJ16 cells. Indeed while a moderate H2O2 dose of 0.5 mM decreased dramatically the percentage of live cells (i.e., lower left quadrant, LL) in J16 cells, the same treatment only marginally affected the percentage of live cells in HJ16 cells when compared to their respective untreated controls. Similarly at a high concentration of 3 mM H2O2, while over 70% live HJ16 cells were still present in the LL quadrant, in J16 cells almost no live J16 cells were detectable (i.e., 0.37% live cells).
Fig. 1.

(A) An example of the evaluation of flow cytometry analysis 24 h following H2O2 treatment. Cells were treated with 0, 0.5, and 3 mM H2O2. The analysis was performed 24 h after H2O2 treatment following dual Annexin-V/PI staining. Live cells are situated in the lower left quadrant (LL), apoptotic cells are situated in the lower right quadrant (LR), and primary and secondary necrotic cells are situated in the upper left (UL) and upper right (UR) quadrants, respectively. (B) The effect of H2O2 on the percentage of apoptosis and necrosis in J16 and HJ16 cell lines. Cells were treated with H2O2 at final concentrations of 0, 0.5, 1, and 3 mM. The percentages of live, necrotic, and apoptotic cells were scored 24 h following the H2O2 treatment by flow cytometry. The results are expressed as mean ± SD (n=3). + P < 0.05, significant difference between treated and corresponding controls (Live cells). * P < 0.05, significantly different from HJ16 cell line (Live cells).
We also performed further comparative flow cytometry analyses of both cell lines at 4 (data not shown) or 24 h (see Fig. 1B) following treatment with H2O2 concentrations of 0, 0.1, 0.5, 1, and 3 mM. These results revealed that both cell lines were fairly resistant to H2O2-mediated apoptotic cell death and that necrosis was the primary mode of cell death in these cell lines. A comparison of the percentage of necrotic cell death in both cell lines following H2O2 treatment in Fig. 1B confirmed the initial observations made in Fig. 1A, since the HJ16 cell line was significantly more resistant than the J16 cell line to H2O2 doses higher than 0.5 mM.
Intracellular ATP depletion as a hallmark of necrotic cell death.
Progression of death stimuli to necrosis and apoptosis depends on the mitochondrial-mediated damage and on ATP levels [20,47–49]. To assess the correlation between the percentage of H2O2-mediated necrosis in cells (as measured by flow cytometry) and the extent of intracellular ATP depletion, an Apoglow kit was used to monitor the modulation of the intracellular levels of ATP, 4 and 24 h following treatment of both cell lines with H2O2. The results (Fig. 2) revealed that although H2O2 promotes ATP depletion in both parental J16 and H2O2-resistant HJ16 cells in a dose-dependent manner, in HJ16 cells the decrease in ATP occurs to a lesser extent than the J16 cells. As the presence of ATP is essential for the activation of apoptosis protease activating factor-1 (Apaf-1) and subsequent activation of caspases that induce apoptosis [1], it appears that the H2O2-induced depletion of ATP in these cells provides a rational explanation for the predominance of necrotic cell death induced by H2O2 as illustrated in Fig. 1. Furthermore as ATP depletion is a consequence of oxidative damage to mitochondrial membranes [2,21], the results of Fig. 2 further demonstrate that compared to J16 cells, the HJ16 cells are more resistant to H2O2-induced mitochondrial membrane damage.
Fig. 2.

Effect of H2O2 and DFO on the intracellular level of ATP in J16 and HJ16 cells. Cells were first treated or not with 100 µM DFO for 18 h at 37 °C. Cells were then incubated for 45 min in PNG prior to treatment with H2O2 at final concentrations of 0, 0.05, 0.1, 0.5, and 1 mM. The intracellular level of ATP was measured 4 and 24 h following H2O2 treatment with the Apoglow kit. Data are expressed as mean ± SD (n=3–5). A and B are plotted as fold change in ATP when compared to the corresponding untreated control. C–F are plotted as percentage change in ATP when compared to the corresponding untreated control. *P < 0.05, significant difference between J16 and HJ16 cells at 4 or 24 h time points. + P < 0.05, significant difference between DFO-treated and the corresponding untreated cell lines at 4 or 24 h time points. (A) 4h, (B) 24h, (C) J16 4h, (D) HJ16 4h, (E) J16 24h and (F) HJ16 24h.
Evaluation of H2O2-mediated lysosomal membrane damage
Three independent assays (NR uptake, Lysosensor DND-153, and cathepsin B immunocytochemistry) were used to assess the level of lysosomal membrane damage in cells 24 h following H2O2 treatments. Fig. 3A shows the distribution of the fluorescent dye within the intact lysosomes of living J16 and HJ16 cells. As can be seen, following H2O2 treatment, the intensity of fluorescent dye in the lysosomal compartments decreased in a dose-dependent manner in J16 cells, reflecting the leakage of lysosomal membranes and consequently the release of fluorescent dye into the cytosol. At a high H2O2 dose of 1 mM, almost no fluorescent vesicles were observed in the J16 cells. In contrast, the lysosomes in HJ16 cells were quite resistant to H2O2-mediated membrane damage (see Fig. 3A). The treatment of J16 cells with H2O2 also provoked a dose-dependent delocalisation of cathepsin B from the lysosomal compartments to cytosol (see Fig. 3B). At high concentrations of 0.5 and 1 mM H2O2, only very few localised bright dots were detectable in J16 cells. In contrast in HJ16 cells, the cathepsin B delocalisation remained very marginal, indicating that HJ16 lysosomes are highly resistant to H2O2-induced oxidative damage. The quantification of lysosomal membrane damage with the NR uptake assay further confirmed the results obtained with Lysososensor and cathepsin B assays. As shown in Fig. 3C, the level of retention of the acidotrophic NR dye was decreased in a dose-dependent manner in H2O2-treated J16 cells, reflecting the loss of lysosomal membrane integrity. At H2O2 concentrations of 0.5 mM and higher, J16 cells lost over 90% of the lysosomal dye. In contrast, in H2O2-treated HJ16 cells, the dye leakage from acidic organelles was low even when cells were treated with high concentrations of 1 and 3 mM H2O2.
Fig. 3.

Evaluation of H2O2-mediated damage to lysosomes in J16 and HJ16 cells. Cells were first treated (or not) with 100 µM DFO for 18 h and then exposed to H2O2 at final concentrations of 0, 0.1, 0.5, 1, and 3 mM. The Lysosensor green (A), cathepsin B immunostaining (B), and NR assays (C–E) were performed 24 h following H2O2 treatment as detailed under Materials and methods. For A and B, the photographs are representative of three independent experiments. In B–D, results are expressed as mean ± SD (n=3–5). *P < 0.05, significantly different from the corresponding control. + P < 0.05, significantly different from the corresponding J16 cells.
Evaluation of the relationship between oxidant-induced increase in cytosolic LIP and resistance of cells to H2O2
Evaluation of cytosolic LIP level
The evaluation of cytosolic LIP in both cell types following various treatments was performed with the CA-fluorescence assay. In order to compare the absolute levels of cytosolic LIP in these cell lines, the dissociation constants (Kd) of CA-bound iron (CA-Fe) were first determined in CA-loaded cells of both types using the CA-fluorescent assay. We then determined the cell volume of each cell line so that the LIP concentrations could be further calibrated. The results were then expressed as cytosolic “LIP” which is operationally defined as the sum of concentrations of free CA-unbound iron [Fe] and CA-bound iron [CA-Fe] (see Materials and methods and [15]). The Kd value of J16 cells (28.82±5.06 µM) was 1.4-fold higher than that of the HJ16 cells (20.06±2.51 µM). In contrast, the cell volume of HJ16 cells (1.6±0.19) was 2-fold higher than that of parental cells (0.85±0.06).
Table 1 summarises the absolute cytosolic LIP levels of both cell lines in the absence or presence of DFO and/or H2O2 treatment. The basal level concentrations of LIP were similar in both cell lines, indicating that the adaptation of J16 cells to high concentrations of H2O2 does not alter the basal cytosolic LIP level in HJ16 cells. H2O2 treatment with a concentration of 0.5 mM provoked an increase in the level of cytosolic LIP in both cell lines, although the absolute measurable level of cytosolic LIP in H2O2-treated HJ16 cells was found to be significantly lower than in H2O2-treated J16 cells. Furthermore a comparison of the basal and H2O2-induced cytosolic LIP levels in both cell lines revealed that the fold-increase in LIP levels in H2O2-treated J16 cells was much higher than that in the HJ16 cells (i.e., 3-fold in J16 and 1.7-fold in HJ16 cells) when compared to their corresponding untreated control cells. The latter result suggested that the higher increase in cytosolic LIP following H2O2 treatment of J16 cells may contribute to the higher susceptibility of J16 cells to H2O2-induced oxidative damage, since labile iron is a strong catalyst of biological oxidation. The LIP measurements were also performed in cells pretreated with the iron chelator DFO. The pretreatment with DFO was carried out for 18 h since it has been shown that DFO can only enter the cells via the slow process of endocytosis that takes several hours. It is then transported into the lysosomal compartment where it remains intact (i.e., undegraded) and acts as a sink for iron, decreasing rapidly the size of lysosomal and cytosolic LIP [32,50–52]. The results of Table 1 also revealed that the DFO treatment was not only able to deplete the basal level concentrations of LIP in both cell lines but also to suppress the H2O2-inducible increase in LIP. The suppression of basal and H2O2-induced LIP was also further confirmed in both cell lines pretreated with the highly lipophilic strong iron chelator SIH for 18 h prior to H2O2 treatment (data not shown).
Table 1.
Evaluation of cytosolic LIP in J16 and HJ16 cells.
| Condition_Cell line | LIP (µM) |
|---|---|
| Control (basal)_J16 | 3.08±0.59 |
| Control (basal)_HJ16 | 3.34±0.87 |
| 9.86±0.15* | |
| 0. 5 mM H2O2_HJ16 | 5.27±1.12*,† |
| 100 µM DFO_J16 | 0* |
| 100 µM DFO_HJ16 | 0* |
| 100 µM DFO+ 0.5 mM H2O2_J16 | 0* |
| 100 µM DFO+0.5 mM | 0* |
LIP measurements were performed with CA assay. Control samples provide the basal cytosolic LIP levels in the absence of treatments. The LIP measurements of H2O2-treated cells were carried out immediately after 0.5 mM H2O2 treatment of cells pretreated or not with 100 µM DFO for 18 h. The results are expressed as mean ± SD (n=3–8).
P < 0.05, significant difference between the treated and the corresponding control.
P < 0.05, significantly different from the corresponding J16 cell line.
Using the CA assay, the cytosolic LIP levels were also measured immediately after H2O2 treatment of both parental and H2O2-resistant cells with additional H2O2 concentrations (i.e., 0.05, 0.1, 0.5, 1, and 3 mM). The results (Fig. 4) revealed that following H2O2 treatment with a range of concentrations of H2O2 (i.e., 0.05–1 mM), the levels of cytosolic LIP were increased in both cell lines. However a comparison of H2O2-mediated LIP increase in both parental and H2O2-resistant cell lines revealed that the extent of LIP release in parental J16 cells was up to 3.5-fold higher than that in the H2O2-resistant HJ16 cells. The latter difference in LIP increase was more significant for the first three concentrations of H2O2 (i.e., 0.05, 0.1, and 0.5 mM) used. Interestingly, when J16 cells were exposed to H2O2 concentrations of 1 and 3 mM, the cytosolic LIP levels began to decrease substantially. (Fig. 4). In contrast only a small decrease in cytosolic LIP was detectable in HJ16 cells treated with a high concentration of 3 mM H2O2.
Fig. 4.

LIP measurements in J16 and HJ16 cells with or without H2O2 treatments. LIP determination was performed immediately after H2O2 treatment. The results are expressed as mean ± SD (n=3–8). *P < 0.05, significantly different from the corresponding HJ16 cells. + P < 0.05, significantly different from the corresponding untreated control.
The decrease in cytosolic LIP values in J16 cells that were treated with high concentrations of 1 and 3 mM H2O2 is almost certainly due to higher toxicity of the concentrations applied and leakage of the dye from the damaged cells. Indeed during the LIP measurement, there was no detectable CA leakage in the supernatant of J16 cells treated with H2O2 concentrations of 0.05–0.5 mM. However at higher H2O2 concentrations of 1 and 3 mM, substantial CA leakage was detected in the J16 cells (i.e., up to 40% of the total CA fluorescence measured in CA-loaded control cells). However in HJ16 cells the CA leakage was only detectable in the supernatant of cells treated with H2O2 concentrations of 1 and 3 mM (i.e., up to 8% of the total CA fluorescence measured in CA-loaded control cells).
Effect of DFO on lysosomal membrane damage induced by H2O2
Three independent assays (NR uptake, Lysosensor DND-153, and cathepsin B immunocytochemistry) were used to assess the level of lysosomal membrane damage in cells 24 h following H2O2 treatments of cells pretreated with DFO. As illustrated in Fig. 3A–E, overnight treatment of cells with DFO significantly protected the J16 cells against H2O2-induced lysosomal damage. However in HJ16 cells that were already fairly resistant to H2O2-induced lysosomal damage, DFO pretreatment did not provide any additional protective effect.
Effect of DFO on mitochondrial membrane damage induced by H2O2
The levels of resistance of cells to H2O2-induced ATP depletion were also monitored with an Apoglow kit 4 and 24 h after H2O2 treatment of cells pretreated with DFO. As displayed in Fig. 2C–F, DFO treatment significantly protected both the J16 and the HJ16 cells against H2O2-induced ATP depletion at both 4 and 24 h time points after H2O2 treatment. Similarly, overnight treatment of cells with SIH (100 µM) also significantly protected both cell lines against H2O2-induced ATP depletion (data not shown). As ATP depletion is the direct consequence of oxidative damage to mitochondrial membranes and is a hallmark of necrotic cell death, our results strongly suggest that H2O2-mediated mitochondrial damage and necrotic cell death are iron dependent.
Effect of DFO on necrotic cell death induced by H2O2
The levels of resistance of cells to H2O2-induced necrotic cell death were also monitored by flow cytometry 24 h after H2O2 treatment of cells pretreated with DFO. As displayed in Fig. 5, overnight DFO treatment fully protected both J16 and HJ16 cells against H2O2-induced necrotic cell death. Overnight treatment of cells with SIH (100 µM) also significantly protected both cell lines against H2O2-induced necrotic cell death (data not shown).
Fig. 5.

Effect of H2O2 ± DFO treatment on the level of necrotic cell death in J16 and HJ16 cells. Both cell lines were treated with 100 μM DFO for 18 h before H2O2 treatment. Flow cytometry assay was performed 24 h following H2O2 treatment. The results are expressed mean ± SD (n=3). *P < 0.05, significantly different from cells treated with H2O2 alone.
Taken together the results described in the sections above strongly suggest a direct correlation between the level of H2O2-induced increase in cytosolic LIP and the extent of H2O2-induced lysosomal and mitochondrial damage and necrotic cell death in both cell types.
Role of Ft in differential sensitivity of cells to oxidative stress
The role of Ft in differential sensitivity of our cell models to H2O2 was assessed by measuring the levels of FtH and FtL subunits in the presence or absence of H2O2 and/or DFO. Since in Western blot analysis, Ft subunit levels of both cell types were not detectable, we performed our measurements with the highly sensitive ELISA method. Fig. 6 summarises the ELISA results in J16 and HJ16 cells following various treatments.
Fig. 6.

FtH and FtL measurements in J16 and HJ16 cell lines ± H2O2 and/or DFO. FtH and FtL measurements were performed by ELISA. For DFO treatment, cells were first treated for 18 h with 100 µM DFO and then the ELISA was performed either immediately (0 h) or following 24 h incubation in conditioned media without DFO. For H2O2 treatments, cells pretreated or not with DFO were analyzed by ELISA either immediately, i.e., H2O2 (0 h) or 24 h after H2O2 treatment, i.e., H2O2 (24 h). The results are expressed as mean ± SD (n=3). *P < 0.05, significantly different from the corresponding untreated control.
Comparison of basal level concentrations of Ft subunits in J16 and HJ16 cells
As can be seen in Fig. 6, the “basal” levels of FtH in the J16 cell line (381±54 ng/mg) were found to be more than 7-fold higher than those in the HJ16 cell line (52±2 ng/mg). The lower FtH levels in HJ16 cells might be part of the adaptive response developed during gradual adaptation of these cells to H2O2. However, when FtL levels were measured, J16 and HJ16 cells had similar basal levels of 10.2±3 ng/mg and 9.2±1 ng/mg in J16 and HJ16 cells, respectively.
Effect of H2O2on Ft subunit levels in J16 and HJ16 cells
The FtH ELISA carried out immediately (i.e., 0 h in Fig. 6A) after the treatment of cells with 0.5 mM H2O2 showed already significant decreases in the FtH levels in J16 cells (i.e., to 70% of the control value). The FtH levels continued to gradually decrease to 34% of the control value until 6 h after H2O2 treatment and then remained low and unchanged up to 24 h after H2O2 treatment (see Figs. 6C and 7). In contrast, in HJ16 cells, the FtH levels did not significantly change over the period of 0 to 24 h after H2O2 treatment (see Figs. 6B, D, and 7). The time course study also revealed no change in the FtL level in J16 cells up to 24 h after H2O2 treatment (Fig. 6A and C and data not shown). In contrast, in HJ16 cells there was a slight increase in FtL level following H2O2 treatment (i.e., up to 2.8-fold of control value) which was sustained up to 24 h after H2O2 treatment (Fig. 6B and D and data not shown).
Fig. 7.
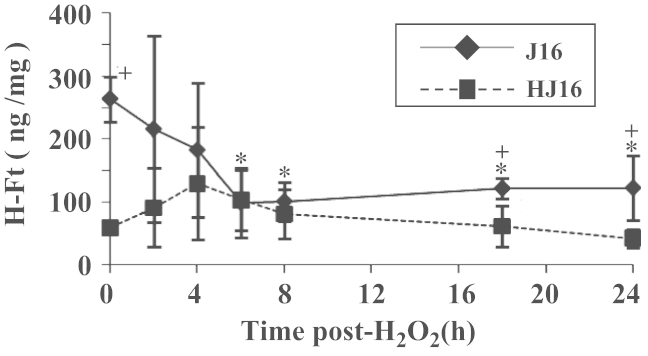
Modulation of FtH level following treatment of J16 and HJ16 cell lines with 0.5 mM H2O2. Whole cellular extracts from J16 and HJ16 cell lines were first prepared 0, 2, 4, 6, 8, 18, and 24 h after H2O2 treatment with an intermediate dose of 0.5 mM and then analyzed by ELISA. Data are expressed as mean ± SD (n=3). *P < 0.05, significantly different from the corresponding control. + P < 0.05, significantly different from the corresponding value of the other cell line.
Effect of DFO +/– H2O2on Ft subunit levels in J16 and HJ16 cells
The treatment of cells with 100 µM DFO for 18 h reduced the FtH levels in the J16 cell line to 8% of the control value (see Fig. 6A). The low level of FtH in J16 cells was sustained even when cells were incubated in CM without DFO for an additional 24 h (see Fig. 6C). In HJ16 cells, DFO treatment also decreased the FtH levels, although to a lesser extent than in J16 cells (i.e., to 38% of the control value; see Fig. 6B). The FtH levels of HJ16 cells further decreased to 15% of the control value following 24 h incubation in CM without DFO (see Fig. 6D). The FtL levels on the other hand were only significantly decreased in DFO-treated J16 cells but not in DFO-treated HJ16 cells (see Fig. 6A–D). The H2O2 treatment of cells that were pretreated with DFO did not further modulate the levels of FtH and FtL subunits in either cell line when compared to cells treated with DFO alone (see Fig. 6A–D).
Evaluation of the intracellular antioxidant defence
Evaluation of catalase and GPx activities
It is well established that most of the H2O2 in cells is eliminated by the intracellular antioxidant enzymes, catalase and GPx. To investigate whether higher resistance of HJ16 cells to H2O2 was related to their higher catalase activity, the basal level of catalase activity was determined spectrophotometrically by following the rate of H2O2 consumption in both cell lines as detailed under Materials and methods. The results (see Table 2) showed no significant difference in the level of catalase activity between parental and H2O2-resistant cells, suggesting that there is no correlation between this enzymatic activity and the resistance of cells to H2O2. In addition to catalase, the GPx activity was also measured in both parental and H2O2-resistant cells. The results (see Table 2) showed that the GPx activity was significantly different between the parental and the H2O2-resistant cells. Indeed the GPx activity in H2O2-resistant cells (124.69±24.59) was 1.5-fold higher compared to the parental cells (88.25±14.67). Taken together these data indicate that higher GPx activity in H2O2-resistant cells might play a role in the resistance of HJ16 cells to H2O2.
Table 2.
Evaluation of intracellular glutathione level and catalase and GPx activities in J16 and HJ16 cells
| Cell line | Catalase activity (n=4) (Unit / mg protein) | GPx activity (n=5) (Unit / mg protein) | Glutathione level (n=4) (µM glutathione / mg protein) |
|---|---|---|---|
| J16 | 0.35±0.12 | 88.25±14.6 | 0.47±0.07 |
| HJ16 | 0.29±0.11 | 124.69±24.59* | 1.61±0.67* |
The results are expressed as mean ± SD.
P < 0.05, significantly different from value of J16 cell line.
Evaluation of the intracellular glutathione levels
To determine whether the total intracellular levels of glutathione play a role in increased resistance of HJ16 cell line to H2O2, the basal glutathione levels of both parental (J16) and H2O2-resistant (HJ16) cell lines were monitored using the methodology established by Tietze (see Materials and methods). The results revealed that HJ16 cells possess significantly higher levels (3.4-fold) of intracellular glutathione than J16 cells (see Table 2). We also evaluated the levels of intracellular glutathione following H2O2 treatment in both J16 and H16 cell lines. The results (Fig. 8A and B) showed that H2O2 concentrations higher than 0.1 mM deplete the total intracellular glutathione content of the J16 cell line almost entirely. However in HJ16 cells, H2O2 treatment only decreased the glutathione content by half.
Fig. 8.

The effect of H2O2 (+/– BSO) on modulation of intracellular glutathione level and its impact on cell survival. A and B are the determination of total intracellular glutathione level by Tietze’s method 24 h after treatment of J16 (A) and HJ16 (B) cells with various concentrations of H2O2. The results are expressed as mean ± SD (n=3). *P < 0.05, significantly different from the corresponding untreated control. C and D represent the percentage survival of J16 and HJ16 cells as determined by flow cytometry 24 h following H2O2 treatment of cells pretreated (or not) with 25 µM BSO for 18 h. The results are expressed as mean ± SD (n=3). *P < 0.05, significantly different from the corresponding control of the same treatment. + P < 0.05, significantly different from BSO-treated cells.
To ascertain whether the lower depletion of the total intracellular glutathione levels of HJ16 cells plays a role in the higher resistance of these cells to H2O2, we decided to deplete the intracellular glutathione content of both cell lines with BSO and then measure the viability of cells after H2O2 treatment. BSO is known to be a relatively nontoxic compound whose effect is apparently restricted to the inhibition of γ-glutamylcysteine synthetase [53]. Indeed the evaluation of the toxicity of BSO toward the cells with the MTT assay in the present study also confirmed its lack of toxicity up to the highest concentration analysed (250 µM for 18 h, data not shown).
The evaluation of the intracellular glutathione level of cells that were exposed to increasing concentrations of BSO (i.e., 2, 5, 15, 25, 50, and 250 µM) for 18 h further revealed that a BSO dose of 25 µM was sufficient to deplete entirely the total intracellular glutathione content of both J16 and HJ16 cell lines (data not shown). Using this concentration of BSO, we investigated the susceptibility of both cell lines to H2O2 treatment following the depletion of their glutathione content. For this purpose, J16 and HJ16 cell lines were first incubated for 18 h with 25 µM BSO and then treated with H2O2 concentrations up to 1 mM, since the H2O2 dose of 3 mM was lethal to the J16 cell line. The flow cytometry performed 24 h following H2O2 treatment (Fig. 8C and D) revealed that in both cell lines, the susceptibility of cells to H2O2-mediated necrotic cell death substantially increased in BSO-treated cells.
Evaluation of FtMt levels in the J16 and HJ16 cell line
We also investigated whether adaptation of J16 cells to high concentrations of H2O2 modulates the level of FtMt in the H2O2-adapted HJ16 cells. For this purpose, we first measured the basal level concentrations of FtMt in both cell lines. The results revealed that in HJ16 cells, the basal FtMt levels were 3-fold higher than in J16 cell lines (i.e.,1.52±0.3 ng/mg in HJ16 cells and 0.53±0.2 ng/mg in J16 cells). The higher FtMt levels in HJ16 cells might be part of the adaptive response of cells to high doses of H2O2. We also measured the FtMt levels 24 h following treatment of both cell lines with 0.5 mM H2O2. The results showed that while the change in FtMt levels in H2O2-treated J16 cells was negligible, in the HJ16 cell line, FtMt levels were increased up to 4-fold after H2O2 treatment (i.e., 5.9±0.6 ng/mg in HJ16 cells and 0.48±0.4 ng/mg in J16 cells). The H2O2-mediated increase in FtMt may be in part responsible for higher resistance of HJ16 cells to H2O2. Furthermore the lower cytosolic labile iron release in H2O2-treated HJ16 cells compared to J16 cells may also be related in part to both higher FtMt basal and higher H2O2-induced levels of FtMt in H2O2-adapted HJ16 cells.
Discussion
The central observation to emerge from the present study is that the chronic adaptation of the Jurkat T J16 cells to high concentrations of H2O2 provokes a series of adaptive responses both at the basal and the “oxidant-induced” levels, allowing cells to withstand high doses of H2O2 that would otherwise be lethal to the cells. These adaptive responses include both alterations in antioxidant defence and iron homeostasis as summarised in Fig. 9A. The possible mechanisms underlying the resistance of HJ16 cells to H2O2 are discussed below.
Fig. 9.

Schematic diagram illustrating the main differences observed in the present study between J16 and HJ16 cells treated or not with H2O2 (A) and/or DFO (B). Abbreviations: GSH, glutathione; GPx, glutathione peroxidase; FtMt, mitochondrial ferritin; FtH, ferritin heavy chain; LIP, labile iron pool. In A after H2O2 treatment, the upward arrows in the boxes indicate increase and downward arrows indicate decrease.
Role of antioxidant defence
The higher GPx activity and the higher basal level concentrations of glutathione appear to act as the first line of defence against the H2O2-mediated ROS formation and oxidative damage in HJ16 cells. However catalase activity is quite similar between the parental J16 and the H2O2-adapted HJ16 cells, suggesting that catalase has a minor role in detoxifying H2O2. In a study by Spitz et al. (1988, [54]), gradual adaptation of Chinese hamster fibroblasts to an H2O2 concentration of 800 µM increased the catalase activity of a H2O2-tolerant cell line when compared to the H2O2-sensitive cell line. These results are in contrast to our study. Differences between the cell line used (i.e., fibroblasts versus T cells), the species, i.e., hamster versus human, and the differential antioxidant defense mechanisms may explain this discrepancy. Furthermore the GSH/GPx-mediated detoxifying system for H2O2 might be lower in the hamster fibroblast cell line used, compared to our system. The latter parameter has not been investigated in the Spitz et al.’s study [54]. One explanation for the relative importance of GPx and not of catalase in detoxifying H2O2 in HJ16 cells relates to the intracellular location of these enzymes. Catalase enzyme is located in peroxisomes and its access to cytosolic H2O2 is limited. However GPx, unlike catalase, is mainly present in the cytosol and requires reduced glutathione to complete the catalytic cycle. So it is likely that HJ16 cells have adopted the more convenient cytosolic GPx/reduced glutathione cycle for efficient removal of H2O2 because this is more accessible than the compartmentalised catalase.
The higher constitutive antioxidant defence mechanism involving glutathione appears to contribute to higher resistance of HJ16 cells to H2O2-mediated oxidative damage and necrotic cell death. The depletion of intracellular glutathione content with BSO renders the HJ16 cells highly vulnerable to H2O2-mediated oxidative damage and cell death. The reduced response of HJ16 cells to oxidant-induced glutathione depletion also appears to be an important factor contributing to the higher resistance of HJ16 cells to H2O2-mediated oxidative damage and cell death. While H2O2 concentrations higher than 0.1 mM provoked a concentration-dependent decrease in intracellular glutathione levels in J16 cells, in HJ16 cells the same concentrations decreased the intracellular glutathione content to only half of the original value. However despite the partial depletion of glutathione in H2O2-treated HJ16 cells, in quantitative terms the protection afforded by glutathione against H2O2-induced damage in HJ16 remained very effective since the overall glutathione content of H2O2-treated HJ16 cells still remained substantially higher than that of H2O2-treated or untreated J16 cells.
The increase in the basal level concentrations of FtMt that appears to compensate for the adaptive decrease in the basal FtH subunit levels following chronic exposure of J16 cells to H2O2 provides a second important line of constitutive defence against oxidative damage. FtMt overexpression has been shown to reduce cytosolic Ft level and iron availability by causing an influx of iron from cytosol to mitochondria [40,55]. Furthermore in Hela cells, FtMt overexpression has been shown to protect the mitochondrial functionality and to lower oxidative damage induced by H2O2 by regulating local iron availability, making these cells more resistant to iron-mediated oxidative damage [37]. Both higher basal and oxidant-induced levels of FtMt are important in buffering excess ROS formation though the regulation of mitochondrial and cytosolic LIP availability on oxidising insult. More specifically in our study, the lower level of oxidant-induced cytosolic labile iron release in HJ16 cells when compared to J16 cells may be in part related to the regulation of cytosolic LIP by higher basal and oxidant-induced levels of FtMt..
The comparison of the intracellular DCFH oxidation level in J16 cells and HJ16 cells treated with H2O2 also revealed that HJ16 cells exhibit lower DCFH oxidation than J16 cells, consistent with the notion that the antioxidant defense mechanisms in HJ16 are almost certainly higher than in J16 cells (data not shown).
Apart from the parameters studied here, autophagic activation as a cell repair mechanism [56] may also contribute to higher resistance of HJ16 cells to oxidative stress. The differences observed may also be related to the difference in H2O2 uptake between the two cell lines. Further studies are necessary to gain insight into the involvement of these latter parameters.
Role of cytosolic LIP
Previous work from this laboratory with skin cells has demonstrated that both UVA and H2O2 promote an immediate increase in cytosolic LIP, which in turn potentiates cell death [20,21,24]. To determine to what extent the intracellular LIP plays a role in the resistance of cells to H2O2, both cell lines were treated with DFO and then the levels of LIP and necrosis were measured following H2O2 treatment. The results summarised in Fig. 9B demonstrate that DFO treatment abolishes both the basal and the H2O2-induced LIP levels and necrotic cell death in both cell lines; consistent with the notion that the chelation of intracellular LIP by DFO protects the cells against H2O2-induced necrotic cell death. Furthermore in a parallel study, we have observed that iron loading of HJ16 cells with hemin abolishes the resistance of HJ16 cells to H2O2-induced necrotic death as a result of an increase in both basal and H2O2-induced levels of LIP (data not shown). These results confirm that cellular damage and the lethal effect of H2O2 treatment is tightly linked to the intracellular LIP levels. Interestingly human epidermal keratinocytes that are naturally resistant to UVA-induced damage possess lower intracellular LIP levels than the UVA-sensitive dermal fibroblasts. In quantitative terms, keratinocytes also release less cytosolic labile iron after UVA than the UVA-sensitive dermal fibroblasts and this has been correlated with their low propensity to undergo UVA-induced necrotic cell death [21].
Role of cytosolic Ft
A striking difference between J16 and HJ16 cells is the remarkably low basal level concentrations of FtH in HJ16 cells when compared to J16 cells. The lower FtH level in HJ16 appears to be part of the adaptive response developed during gradual adaptation of these cells to H2O2. As for FtL, they had the same basal level in both cell lines. However in the study carried out by Lipinski et al. [57], using mouse lymphoma cell lines with inverse cross-sensitivity to ionizing radiation (IR) and H2O2, it was found that both the FtH and the FtL levels were higher in the H2O2-resistant (and IR-sensitive) cells than in the H2O2-sensitive (and IR-resistant) cells. The latter result differs from our study, presumably due to the difference in cell type (i.e., murine versus human) and the mechanisms underlying the resistance of these cells to both IR and H2O2. Indeed while in our study the H2O2 resistance in HJ16 cells was developed following chronic adaptation of the parental J16 cells to high concentrations of H2O2, in Lipinski’s study the H2O2 resistance was a consequence of the spontaneous conversion of the parental cell line (IR-resistant) to a mutant cell line (IR-sensitive) which was accompanied by an unexpected increase in H2O2 resistance of the mutated cells [58]. In the latter study, Northern blotting analysis revealed that the level of TfR1 mRNA was also higher in H2O2-sensitive (and IR-resistant) than the H2O2-resistant (and IR-sensitive) sensitive cell line. Accordingly the basal level of LIP was also higher in H2O2-sensitive (and IR-resistant) cells. In contrast, in our study, Western blot analysis revealed no difference in TfR1 protein levels in both cell lines (data not shown) and this is consistent with the similar levels of basal LIP observed in our cell lines. In other words, while both J16 cells and HJ16 cells will manifest similar iron uptake by TfR1, the gradual adaptation of cells to H2O2 modulates specifically the FtH subunit of Ft. This modulation does not affect the overall labile iron levels in cells consistent with the notion that iron homeostasis in HJ16 cells is still effective in maintaining a low basal level of intracellular LIP.
The adaptive reduction in the basal level concentrations of FtH in HJ16 cells appears to be a way in which cells can lower their overall level of cytosolic Ft that may otherwise act as a pro-oxidant under oxidative stress conditions releasing its iron either reductively or proteolytically on oxidizing insult [19,20,29,34,59]. Studies from this laboratory have already demonstrated a link between lower Ft levels and higher resistance of skin keratinocytes to oxidizing agents such as UVA and H2O2 when compared to their matched oxidant-sensitive skin fibroblasts [2,8,21]. Within this context, Ft has been shown to act as a pro-oxidant, since its oxidant-mediated proteolytic degradation led to increased levels of potentially harmful LIP contributing to oxidative damage and cell death in skin cells [20,21].
Our results demonstrate that DFO treatment not only fully depletes the intracellular LIP in both cell lines but also substantially decreases the level of Ft in the cells. The DFO treatment also fully protects both cell lines against H2O2-induced necrotic cell death. The protection afforded by DFO against H2O2-mediated cell death may be related to its dual action (i) as a suppressor of Ft synthesis that is a potential source of LIP in H2O2-treated cells and (ii) as a direct chelator of potentially harmful LIP that contributes to oxidative damage and cell death in H2O2-treated cells.
The lower level of FtH in HJ16 cells may also be due to IRP1-mediated suppression of Ft synthesis as a result of chronic exposure to H2O2 as observed in studies involving murine cultured cells exposed to H2O2 [8,29,60]. This assumption is consistent with the observation that in J16 cells, acute exposure of cells to an H2O2 concentration of 0.5 mM also reduces substantially the level of FtH.
In our study, we found that the overall FtH subunit levels of both cell lines were significantly higher than the FtL subunit levels. Unlike FtH, FtL does not seem to have a major role in iron homeostasis since, for example, subjects with genetic hyperferritinemia-cataract syndrome have nearly 10-fold higher FtL than normal with no obvious abnormalities in iron metabolism [61,62]. Accordingly FtL knockdown did not have a significant impact on intracellular iron availability [63]. Within this context, the H2O2-mediated increase in FtL expression observed in HJ16 cells may also not be related to iron but rather to its other functions such as stabilising the Ft shell. Since FtH subunit levels are very low in HJ16 cells, H2O2 exposure may lead to an increase in FtL expression as a compensatory protective mechanism to consolidate the stability of the Ft shell under oxidative stress conditions. Further studies are necessary to understand the functional significance of FtL increase under certain oxidative stress conditions.
Mechanism underlying H2O2-induced necrotic cell death in J16 cells
Fig. 10 summarizes potential pathways by which H2O2 promotes an increase in cytosolic LIP leading to necrotic cell death in J16 cells. Clearly the presence of high levels of redox-active labile iron in lysosomes and mitochondria of J16 cells sensitises these organelles to H2O2-induced oxidative damage, and consequently exposure of J16 cells to H2O2 promotes concentration-dependent damage to these organelles. A recent biophysical study looking at the speciation and distribution of iron (i.e., ironome) in intact human Jurkat cells and their isolated mitochondria has also confirmed the presence of high levels of nonheme high-spin FeII species (a substantial portion of which is LIP) in the mitochondrial organelles [64]. The rapid release of labile iron from these organelles is likely to contribute to the measurable increase in cytosolic LIP which in turn exacerbates the oxidative damage to cell constituents. While the cytosolic LIP is physiologically kept low in cells by storage in Ft, the H2O2-induced decrease in Ft further contributes to the expansion of cytosolic LIP. The low level of the key iron-storage protein Ft within the critical first hours after H2O2 treatment is likely to further exacerbate the iron-catalyzed damage in H2O2-treated J16 cells, since a potentially harmful excess of cytosolic LIP cannot be safely sequestered. Indeed the increase in cytosolic LIP along with highly reactive ROS generated by iron-catalysed Fenton chemistry involving H2O2 is expected to promote further peroxidative damage in exposed cells notably in plasma membranes resulting in a loss of cell membrane integrity. The latter should predispose the cells to necrotic cell death as a result of the influx of extracellular media to the intracellular environment leading to swelling and rupture of subcellular compartments and cell lysis. Concomitant with destabilisation of the cell membrane, H2O2 also promotes an immediate depletion of mitochondrial ATP, which is a hallmark of necrotic cell death [21]. The H2O2-induced mitochondrial ATP depletion is thought to be triggered by several simultaneous events. First the presence of a high level of LIP in mitochondria may initiate the destabilisation of mitochondrial membranes on H2O2 treatment as a result of iron-induced oxidative damage. Second the H2O2-induced expansion of cytosolic LIP by lysosomal damage as well as the concomitant decrease in Ft level is likely to exacerbate the iron-catalysed oxidative damage that already occurs in the mitochondrial membrane. Finally the rapid release of lysosomal proteases after H2O2 treatment might further damage the mitochondrial membrane leading to additional permeabilisation of the mitochondrial organelles. All these events will almost certainly contribute to the observed H2O2-induced rapid depletion of mitochondrial ATP that leads to the demise of cells in the form of necrosis. Pretreatment of J16 cells with DFO dramatically decreased the levels of lysosomal and plasma membrane damage and necrotic cell death. The lack of an oxidative effect of H2O2 in the presence of DFO strongly suggests that H2O2 per se is not particularly toxic but rather must work in concert with labile iron in order to damage cells. The measurement of intracellular ROS level after H2O2 treatment in J16 cells that were pretreated with the iron chelator SIH also revealed that the level of ROS present in SIH-treated cells is substantially lower than in J16 cells treated with H2O2 alone (data not shown).
Fig. 10.

Schematic diagram illustrating the potential pathways involved in H2O2-induced cytosolic labile iron release and necrotic cell death in J16 cells. Exposure of J16 cells to H2O2 catalyses the formation of ROS (orange colour) that promotes oxidative damage in lysosomal (1) and mitochondrial (2) membranes. Damage to lysosomal membrane (1) leads to release of lysosomal proteases (1a) that may contribute to Ft degradation (1a.1) and release its iron in the labile form (LI) (hatched arrow). Although the decrease in Ft level in J16 cells may be due to H2O2-mediated suppression of Ft synthesis (3). In this scenario Ft iron does not contribute to the increase in cytosolic LIP. The release of lysosomal proteases (1a) may also contribute to mitochondrial membrane damage (1a.2). The H2O2-mediated damage to mitochondrial membrane (2) leads to interruption of electron chain transport in mitochondrial membrane causing the generation of ROS, loss of the electrochemical gradient across the inner membrane, and ATP depletion (2b). The release of potentially harmful labile iron (LI) in cytosol via routes 1 and 2, along with the preexisting pool of cytosolic LIP, contributes to a massive increase in cytosolic LIP that catalyses the formation of more harmful ROS (in red) that is thought to further exacerbate the peroxidative damage in the lysosomal (1b), mitochondrial (2a), and plasma (4) membranes leading to the loss of organelles’ and plasma membrane’s integrity. The loss of plasma membrane integrity (4b) together with the mitochondrial ATP depletion (2b) results in necrotic cell death.
Overall our results demonstrate that the levels of damage and cell death in both cell lines are relatively low and comparable, when cells are exposed to low H2O2 concentrations of 0.05 and 0.1 mM. J16 cells are not sensitive to low concentrations of H2O2 (i.e., 0.05 and 0.1 mM), presumably because their antioxidant defence mechanisms are sufficient to counteract the damaging effects of the low H2O2 concentrations applied. However at high H2O2 concentrations (i.e., 0.5–3 mM), the antioxidant defence mechanism in the J16 cell line appears to be insufficient to cope with such high acute oxidative insult, resulting in a high percentage of cell death. In contrast in HJ16 cells, the chronic adaptation of cells to high concentrations of H2O2 has provoked a series of novel and specific adaptive responses that contribute to higher resistance of HJ16 cells to high concentrations of H2O2 (i.e., 0.5–3 mM). These include increased cellular antioxidant defence in the form of higher glutathione and FtMt levels, higher GPx activity, and lower FtH levels. Further adaptive responses include the significantly reduced cellular response to oxidant-mediated glutathione depletion, FtH modulation, and labile iron release and a significant increase in FtMt levels following H2O2 treatment.
The findings of this study have direct relevance to understanding the interplay between iron and chronic exposure to ROS, notably H2O2 in promotion and progression of pathological conditions where there is a substantial local increase in the production of H2O2 beyond the physiological level produced in the cells. In such pathological conditions the existing antioxidant defence mechanism in cells will be insufficient to counteract the H2O2-mediated damage. As a result cells will die by apopotosis or necrosis or alternatively will develop novel and specific adaptive antioxidant mechanisms allowing cells to withstand high levels of ROS notably H2O2. For example in rheumatoid arthritis (RA), the rheumatoid synovium is relatively hypoxic, and is exposed to chronic cycles of hypoxia and reperfusion. This promotes the generation of substantial ROS, notably H2O2 within the rheumatoid synovium which has marked effects on many cell types, including enhanced production of proinflammatory cytokines by mononuclear cells. Furthermore several studies indicate that, during an inflammatory response, considerable amounts of ROS, notably H2O2, are generated that participate in the etiology and/or the progression of the condition. For example, in an inflammatory environment, lymphocytes are exposed repeatedly to high concentrations of H2O2 produced by macrophages and neutrophils as a result of the inflammatory response. Recent data from this laboratory have also revealed that rheumatoid synovial fibroblasts are highly resistant to oxidative damage caused by high concentrations of H2O2, presumably as a result of adaptation to chronic exposure to H2O2 that is produced locally in the inflammatory arthritic synovium (data not shown). Therefore, understanding the mechanism underlying the adaptation of cells to chronic exposure to high concentrations of H2O2 in this study is directly relevant to pathological conditions such as RA. This study may provide clues for the development of novel therapeutic strategies targeting ROS, iron and iron-related proteins, notably Ft, in chronic inflammatory disorders.
Acknowledgments
This research was supported by a Wellcome Trust Showcase Award (Contract No. 067653/Z/02/Z) and core grants from the Association for International Cancer Research (UK), Bath Institute for Rheumatic Diseases (Bath, UK) and Royal National Hospital for Rheumatic Diseases (Bath, UK). A.Y. was a recipient of a Ph.D. scholarship from the Department of Pharmacy and Pharmacology, University of Bath.
References
- 1.Pourzand C., Tyrrell R.M. Apoptosis, the role of oxidative stress and the example of solar ultraviolet A radiation. Photochem. Photobiol. 1999;70:380–390. [PubMed] [Google Scholar]
- 2.Reelfs O., Eggleston I.M., Pourzand C. Skin protection against UVA-induced iron damage by multiantioxidants and iron chelating drugs/prodrug. Curr. Drug Metab. 2010;11:242–249. doi: 10.2174/138920010791196265. [DOI] [PubMed] [Google Scholar]
- 3.Sayre L.M., Perry G., Smith M.A. Oxidative stress and neurotoxicity. Chem. Res. Toxicol. 2008;21:172–188. doi: 10.1021/tx700210j. [DOI] [PubMed] [Google Scholar]
- 4.Dröge W. Oxidative stress and aging. Adv. Exp. Med. Biol. 2003;543:191–200. doi: 10.1007/978-1-4419-8997-0_14. [DOI] [PubMed] [Google Scholar]
- 5.Paravicini T.M., Touyz R.M. Redox signaling in hypertension. Cardiovasc. Res. 2006;71:247–258. doi: 10.1016/j.cardiores.2006.05.001. [DOI] [PubMed] [Google Scholar]
- 6.Li L., Ishdorj G., Gibson S.B. Reactive oxygen species regulation of autophagy in cancer: implications for cancer treatment. Free Radic. Biol. Med. 2012;53:1399–1410. doi: 10.1016/j.freeradbiomed.2012.07.011. [DOI] [PubMed] [Google Scholar]
- 7.Chiurchiù V., Maccarrone M. Chronic inflammatory disorders and their redox control: from molecular mechanisms to therapeutic opportunities. Antioxid. Redox Signal. 2011;15:2605–2641. doi: 10.1089/ars.2010.3547. [DOI] [PubMed] [Google Scholar]
- 8.Aroun A., Zhong J.L., Tyrrell R.M., Pourzand C. Iron, oxidative stress and the example of solar ultraviolet A radiation. Photochem. Photobiol. Sci. 2012;11:118–134. doi: 10.1039/c1pp05204g. [DOI] [PubMed] [Google Scholar]
- 9.Halliwell B., Gutteridge J.M.C. Clarendon; Oxford: 1999. Free radicals in biology and medicine. [Google Scholar]
- 10.De Groot H. Reactive oxygen species in tissue injury. Hepatogastroenterology. 1994;41:328–332. [PubMed] [Google Scholar]
- 11.Stohs S.J., Bagchi D. Oxidative mechanisms in the toxicity of metal ions. Free Radic. Biol. Med. 1995;18:321–336. doi: 10.1016/0891-5849(94)00159-h. [DOI] [PubMed] [Google Scholar]
- 12.Tenopoulou M., Doulis P.T., Barbouti A., Brunk U., Galaris D. Role of compartmentalized redox active iron in hydrogen peroxide-induced DNA damage and apoptosis. Biochem. J. 2005;387:703–710. doi: 10.1042/BJ20041650. [DOI] [PMC free article] [PubMed] [Google Scholar]
- 13.Epsztejn S., Kakhlon O., Glickstein H., Breuer W., Cabantchik Z.I. Fluorescence analysis of the labile iron pool of mammalian cells. Anal. Biochem. 1997;248:31–40. doi: 10.1006/abio.1997.2126. [DOI] [PubMed] [Google Scholar]
- 14.Pourzand C., Reelfs O., Tyrrell R.M. Approaches to define the involvement of reactive oxygen species and iron in ultraviolet A inducible gene expression. Methods Mol. Biol. 2000;99:257–276. doi: 10.1385/1-59259-054-3:257. [DOI] [PubMed] [Google Scholar]
- 15.Hentze M.W., Kuhn L.C. Molecular control of vertebrate iron metabolism: mRNA-based regulatory circuits operated by iron, nitric oxide, and oxidative stress. Proc. Natl. Acad. Sci. USA. 1996;93:8175–8182. doi: 10.1073/pnas.93.16.8175. [DOI] [PMC free article] [PubMed] [Google Scholar]
- 16.Cairo G., Pietrangelo A. Iron regulatory proteins in pathobiology. Biochem. J. 2000;352:241–250. [PMC free article] [PubMed] [Google Scholar]
- 17.Sussman M.S., Bulkley G.B. Oxygen-derived free radicals in reperfusion injury. Methods Enzymol. 1990;186:711–722. doi: 10.1016/0076-6879(90)86170-z. [DOI] [PubMed] [Google Scholar]
- 18.De Groot H., Brecht M. Reoxygenation injury in rat hepatocytes: mediation by O2-/H2O2 liberated by sources other than xanthine oxidase. Biol. Chem. Hoppe Seyler. 1991;372:35–41. doi: 10.1515/bchm3.1991.372.1.35. [DOI] [PubMed] [Google Scholar]
- 19.Tacchini L., Recalcati S., Bernelli-Zazzera A., Cairo G. Induction of ferritin synthesis in ischemic-reperfused rat liver: analysis of the molecular mechanisms. Gastroenterology. 1997;113:946–953. doi: 10.1016/s0016-5085(97)70191-4. [DOI] [PubMed] [Google Scholar]
- 20.Pourzand C., Watkin R.D., Brown J.E., Tyrrell R.M. Ultraviolet A radiation induces immediate release of iron in human primary skin fibroblasts: the role of ferritin. Proc. Natl. Acad. Sci. USA. 1999;96:6751–6756. doi: 10.1073/pnas.96.12.6751. [DOI] [PMC free article] [PubMed] [Google Scholar]
- 21.Zhong J.L., Yiakouvaki A., Holley P., Tyrrell R.M., Pourzand C. Susceptibility of skin cells to UVA-induced necrotic cell death reflects the intracellular level of labile iron. J. Invest. Dermatol. 2004;123:771–780. doi: 10.1111/j.0022-202X.2004.23419.x. [DOI] [PubMed] [Google Scholar]
- 22.Breuer W., Greenberg E., Cabantchik Z.I. Newly delivered transferrin iron and oxidative cell injury. FEBS Lett. 1997;403:213–219. doi: 10.1016/s0014-5793(97)00056-2. [DOI] [PubMed] [Google Scholar]
- 23.Cairo G., Tacchini L., Pogliaghi G., Anzon E., Tomasi A., Bernelli-Zazzera A. Induction of ferritin synthesis by oxidative stress. Transcriptional and post-transcriptional regulation by expansion of the ‘free’ iron pool. J. Biol. Chem. 1995;270:700–703. doi: 10.1074/jbc.270.2.700. [DOI] [PubMed] [Google Scholar]
- 24.Yiakouvaki A., Savovic J., Al-Qenaei A., Dowden J., Pourzand C. Caged-iron chelators a novel approach towards protecting skin cells against UVA-induced necrotic cell death. J. Invest. Dermatol. 2006;126:2287–2295. doi: 10.1038/sj.jid.5700373. [DOI] [PubMed] [Google Scholar]
- 25.Halliwell B., Gutteridge J.M.C. Biologically relevant metal ion-dependent hydroxyl radical generation: an update. FEBS Lett. 1992;307:108–112. doi: 10.1016/0014-5793(92)80911-y. [DOI] [PubMed] [Google Scholar]
- 26.Chevion M. A site-specific mechanism for free radical induced biological damage: the essential role of redox-active transition metals. Free Radic. Biol. Med. 1988;5:27–37. doi: 10.1016/0891-5849(88)90059-7. [DOI] [PubMed] [Google Scholar]
- 27.Fakih S., Podinovskaia M., Kong X., Collins H.L., Schaible U.E., Hider R.C. Targeting the lysosome: fluorescent iron (III) chelators to selectively monitor endosomal/lysosomal labile iron pools. J. Med. Chem. 2008;51:4539–4552. doi: 10.1021/jm8001247. [DOI] [PubMed] [Google Scholar]
- 28.Arosio P., Levi S. Ferritin, iron homeostasis, and oxidative damage. Free Radic. Biol. Med. 2002;33:457–463. doi: 10.1016/s0891-5849(02)00842-0. [DOI] [PubMed] [Google Scholar]
- 29.Arosio P., Levi S. Cytosolic and mitochondrial ferritins in the regulation of cellular iron homeostasis and oxidative damage. Biochim. Biophys. Acta. 2010;1800:783–792. doi: 10.1016/j.bbagen.2010.02.005. [DOI] [PubMed] [Google Scholar]
- 30.Kruszewski M. Labile iron pool: the main determinant of cellular response to oxidative stress. Mutat. Res. 2003;29:81–92. doi: 10.1016/j.mrfmmm.2003.08.004. [DOI] [PubMed] [Google Scholar]
- 31.Vaisman B., Fibach E., Konijn A.M. Utilization of intracellular ferritin iron for hemoglobin synthesis in developing human erythroid precursors. Blood. 1997;90:831–838. [PubMed] [Google Scholar]
- 32.Kurz T., Terman A., Gustafsson B., Brunk U.T. Lysosomes and oxidative stress in aging and apoptosis. Biochim. Biophys. Acta. 2008;1780:1291–1303. doi: 10.1016/j.bbagen.2008.01.009. [DOI] [PubMed] [Google Scholar]
- 33.Yu Z., Persson H.L., Eaton J.W., Brunk U.T. Intralysosomal iron: a major determinant of oxidant-induced cell death. Free Radic. Biol. Med. 2003;34:1243–1252. doi: 10.1016/s0891-5849(03)00109-6. [DOI] [PubMed] [Google Scholar]
- 34.Breuer W., Shvartsman M., Cabantchik Z.I. Intracellular labile iron. Int. J. Biochem. Cell Biol. 2008;40:350–354. doi: 10.1016/j.biocel.2007.03.010. [DOI] [PubMed] [Google Scholar]
- 35.Zhao M., Antunes F., Eaton J.W., Brunk U.T. Lysosomal enzymes promote mitochondrial oxidant production, cytochrome c release and apoptosis. Eur. J. Biochem. 2003;270:3778–3786. doi: 10.1046/j.1432-1033.2003.03765.x. [DOI] [PubMed] [Google Scholar]
- 36.Santambrogio P., Biasiotto G., Sanvito F., Olivieri S., Arosio P., Levi S. Mitochondrial ferritin expression in adult mouse tissues. J. Histochem. Cytochem. 2007;55:1129–1137. doi: 10.1369/jhc.7A7273.2007. [DOI] [PMC free article] [PubMed] [Google Scholar]
- 37.Campanella A., Rovelli E., Santambrogio P., Cozzi A., Taroni F., Levi S. Mitochondrial ferritin limits oxidative damage regulating mitochondrial iron availability: hypothesis for a protective role in Friedreich ataxia. Hum. Mol. Genet. 2009;18:1–11. doi: 10.1093/hmg/ddn308. [DOI] [PMC free article] [PubMed] [Google Scholar]
- 38.Drysdale J., Arosio P., Invernizzi R., Cazzola M., Volz A., Corsi B., Biasiotto G., Levi S. Mitochondrial ferritin: a new player in iron metabolism. Blood Cells Mol. Dis. 2002;29:376–383. doi: 10.1006/bcmd.2002.0577. [DOI] [PubMed] [Google Scholar]
- 39.Nie G., Sheftel A.D., Kim S.F., Ponka P. Overexpression of mitochondrial ferritin causes cytosolic iron depletion and changes cellular iron homeostasis. Blood. 2005;105:2161–2167. doi: 10.1182/blood-2004-07-2722. [DOI] [PubMed] [Google Scholar]
- 40.Campanella A., Isaya G., O'Neill H.A., Santambrogio P., Cozzi A., Arosio P., Levi S. The expression of human mitochondrial ferritin rescues respiratory function in frataxin-deficient yeast. Hum. Mol. Genet. 2004;13:2279–2288. doi: 10.1093/hmg/ddh232. [DOI] [PubMed] [Google Scholar]
- 41.Basu-Modak S., Ali D., Gordon M., Polte T., Yiakouvaki A., Pourzand C., Rice-Evans C., Tyrrell R.M. Suppression of UVA-mediated release of labile iron by epicatechin—a link to lysosomal protection. Free Radic. Biol. Med. 2006;41:1197–1204. doi: 10.1016/j.freeradbiomed.2006.06.008. [DOI] [PubMed] [Google Scholar]
- 42.Santambrogio P., Cozzi A., Levi S., Rovida E., Magni F., Albertini A., Arosio P. Functional and immunological analysis of recombinant mouse H- and L-ferritins from Escherichia coli. Protein Expression Purif. 2000;19:212–218. doi: 10.1006/prep.2000.1212. [DOI] [PubMed] [Google Scholar]
- 43.Bradford M.M. Rapid and sensitive method for quantitation of microgram quantities of protein utilizing principle of protein-dye binding. Anal. Biochem. 1976;72:248–254. doi: 10.1016/0003-2697(76)90527-3. [DOI] [PubMed] [Google Scholar]
- 44.Tietze F. Enzymic method for quantitative determination of nanogram amounts of total and oxidized glutathione: applications to mammalian blood and other tissues. Anal. Biochem. 1969;27:502–522. doi: 10.1016/0003-2697(69)90064-5. [DOI] [PubMed] [Google Scholar]
- 45.Moysan A., Marquis I., Gaboriou F., Santus R., Dubertret L., Morliere P. Ultraviolet A-induced lipid peroxidation and antioxidant defense systems in cultured human skin fibroblasts. J. Invest. Dermatol. 1993;100:692–698. doi: 10.1111/1523-1747.ep12472352. [DOI] [PubMed] [Google Scholar]
- 46.Flohé L., Günzler W.A. Assays of glutathione peroxidase. Methods Enzymol. 1984;105:1114–1121. doi: 10.1016/s0076-6879(84)05015-1. [DOI] [PubMed] [Google Scholar]
- 47.Egushi Y., Shimizu S., Tsujimoto Y. Intracellular ATP levels determine cell death fate by apoptosis or necrosis. Cancer Res. 1997;57:1835–1840. [PubMed] [Google Scholar]
- 48.Leist M., Single B., Castoldi A.F., Kuhnle S., Nicotera P. Intracellular adenosine triphosphate (ATP) concentration: a switch in the description between apoptosis and necrosis. J. Exp. Med. 1997;185:1481–1486. doi: 10.1084/jem.185.8.1481. [DOI] [PMC free article] [PubMed] [Google Scholar]
- 49.Ha H.C., Snyder S.H. Poly(ADP-ribose) polymerase is a mediator of necrotic cell death by ATP depletion. Proc. Natl. Acad. Sci. USA. 1999;96:13978–13982. doi: 10.1073/pnas.96.24.13978. [DOI] [PMC free article] [PubMed] [Google Scholar]
- 50.Kurz T., Gustafsson B., Brunk U.T. Intralysosomal iron chelation protects against oxidative stress-induced cellular damage. FEBS J. 2006;273:3106–3117. doi: 10.1111/j.1742-4658.2006.05321.x. [DOI] [PubMed] [Google Scholar]
- 51.Lloyd J.B., Cable H., Rice-Evans C. Evidence that desferrioxamine cannot enter cells by passive diffusion. Biochem. Pharmacol. 1991;41:1361–1363. doi: 10.1016/0006-2952(91)90109-i. [DOI] [PubMed] [Google Scholar]
- 52.Glickstein H., El R.B., Shvartsman M., Cabantchik Z.I. Intracellular labile iron pools as direct targets of iron chelators: a fluorescence study of chelator action in living cells. Blood. 2005;106:3242–3250. doi: 10.1182/blood-2005-02-0460. [DOI] [PubMed] [Google Scholar]
- 53.Dethmers J.K., Meister A. Glutathione export by human lymphoid cells: depletion of glutathione by inhibition of its synthesis decreases export and increases sensitivity to irradiation. Proc. Natl. Acad. Sci. USA. 1981;78:7492–7496. doi: 10.1073/pnas.78.12.7492. [DOI] [PMC free article] [PubMed] [Google Scholar]
- 54.Spitz D.R., Li G.C., McCormick M.L., Sun Y., Oberley L.W. Stable H2O2-resistant variants of Chinese hamster fibroblasts demonstrate increases in catalase activity. Radiat. Res. 1988;114:114–124. [PubMed] [Google Scholar]
- 55.Corsi B., Cozzi A., Arosio P., Drysdale J., Santambrogio P., Campanella A., Biasiotto G., Albertini A., Levi S. Human mitochondrial ferritin expressed in HeLa cells incorporates iron and affects cellular iron metabolism. J. Biol. Chem. 2002;277:22430–22437. doi: 10.1074/jbc.M105372200. [DOI] [PubMed] [Google Scholar]
- 56.Kaushik S., Cuervo A.M. Autophagy as a cell-repair mechanism: activation of chaperone-mediated autophagy during oxidative stress. Mol. Aspects Med. 2006;27:444–454. doi: 10.1016/j.mam.2006.08.007. [DOI] [PMC free article] [PubMed] [Google Scholar]
- 57.Lipinski P., Drapier J.C., Oliveira L., Retmanska H., Sochanowicz B., Kruszewski M. Intracellular iron status as a hallmark of mammalian cell susceptibility to oxidative stress: a study of L5178Y mouse lymphoma cell lines differentially sensitive to H2O2. Blood. 2000;95:2960–2966. [PubMed] [Google Scholar]
- 58.Beer J.Z., Budzicka E., Niepokojczycka E., Rosiek O., Szumiel I., Walicka M. Loss of tumorigenicity with simultaneous changes in radiosensitivity and photosensitivity during in vitro growth of L5178Y murine lymphoma cells. Cancer Res. 1983;43:4736–4742. [PubMed] [Google Scholar]
- 59.Breuer W., Epsztejn S., Cabantchik Z.I. Dynamics of the cytosolic chelatable iron pool of K562 cells. FEBS Lett. 1996;382:304–308. doi: 10.1016/0014-5793(96)00190-1. [DOI] [PubMed] [Google Scholar]
- 60.Pantopoulos K., Hentze M.W. Rapid responses to oxidative stress mediated by iron regulatory protein. EMBO J. 1995;14:2917–2924. doi: 10.1002/j.1460-2075.1995.tb07291.x. [DOI] [PMC free article] [PubMed] [Google Scholar]
- 61.Beaumont C., Leneuve P., Devaux I., Scoazec J.Y., Berthier M., Loiseau M.N., Grandchamp B., Bonneau D. Mutation in the iron responsive element of the L-ferritin mRNA in a family with dominant hyperferritinaemia and cataract. Nat. Genet. 1995;11:444–446. doi: 10.1038/ng1295-444. [DOI] [PubMed] [Google Scholar]
- 62.Girelli D., Corrocher R., Bisceglia L., Olivieri O., De Franceschi L., Zelante L., Gasparini P. Molecular basis for the recently described hereditary hyperferritinemia-cataract syndrome: a mutation in the iron-responsive element of ferritin L-subunit gene (the "Verona mutation") Blood. 1995;86:4050–4053. [PubMed] [Google Scholar]
- 63.Cozzi A., Corsi B., Levi S., Santambrogio P., Biasiotto G., Arosio P. Analysis of the biologic functions of H- and L-ferritins in HeLa cells by transfection with siRNAs and cDNAs: evidence for a proliferative role of L-ferritin. Blood. 2004;103:2377–2383. doi: 10.1182/blood-2003-06-1842. [DOI] [PubMed] [Google Scholar]
- 64.Jhurry N.D., Chakrabarti M., McCornick S.P., Holmes-Hampton G.P., Lindhal P.A. Biophysical investigation of the ironome of human Jurkat cells and mitochondria. Biochemistry. 2012;51:5276–5284. doi: 10.1021/bi300382d. [DOI] [PMC free article] [PubMed] [Google Scholar]