

Abstract
Activating KRAS mutations drive colorectal cancer tumorigenesis and influence response to anti‐EGFR‐targeted therapy. Despite recent advances in understanding Ras signaling biology and the revolution in therapies for melanoma using BRAF inhibitors, no targeted agents have been effective in KRAS‐mutant cancers, mainly due to activation of compensatory pathways. Here, by leveraging the largest synthetic lethal genetic interactome in yeast, we identify that KRAS‐mutated colorectal cancer cells have augmented homologous recombination repair (HRR) signaling. We found that KRAS mutation resulted in slowing and stalling of the replication fork and accumulation of DNA damage. Moreover, we found that KRAS‐mutant HCT116 cells have an increase in MYC‐mediated RAD51 expression with a corresponding increase in RAD51 recruitment to irradiation‐induced DNA double‐strand breaks (DSBs) compared to genetically complemented isogenic cells. MYC depletion using RNA interference significantly reduced IR‐induced RAD51 foci formation and HRR. On the contrary, overexpression of either HA‐tagged wild‐type (WT) MYC or phospho‐mutant S62A increased RAD51 protein levels and hence IR‐induced RAD51 foci. Likewise, depletion of RAD51 selectively induced apoptosis in HCT116‐mutant cells by increasing DSBs. Pharmacological inhibition targeting HRR signaling combined with PARP inhibition selectivity killed KRAS‐mutant cells. Interestingly, these differences were not seen in a second isogenic pair of KRAS WT and mutant cells (DLD‐1), likely due to their nondependency on the KRAS mutation for survival. Our data thus highlight a possible mechanism by which KRAS‐mutant‐dependent cells drive HRR in vitro by upregulating MYC‐RAD51 expression. These data may offer a promising therapeutic vulnerability in colorectal cancer cells harboring otherwise nondruggable KRAS mutations, which warrants further investigation in vivo.
Keywords: colorectal cancer, DNA damage response, homologous recombination repair, KRAS, RAD51, therapeutic vulnerability
Abbreviations
- Alt‐NHEJ
alternative NHEJ
- DDR
DNA damage response
- DSBs
DNA double‐strand breaks
- HRR
homologous recombination repair
- MT
mutant
- NHEJ
nonhomologous end joining
- PI
propidium iodide
- WT
wild‐type
1. Introduction
Activating Ras mutations are major contributors in cellular transformation and among the most frequently mutated drivers across multiple tumors including colorectal cancer (Schubbert et al., 2007). Ras proteins are small GTPases that shuttle between the plasma membrane and cytoplasm (McCormick, 1993a,b), depending on external and internal stimuli, to activate various effector proteins resulting in multiple cellular signaling responses including growth, proliferation, survival, differentiation, and morphogenesis (Bos et al., 2007; Cherfils and Zeghouf, 2013). The Ras superfamily members, HRAS, KRAS, and NRAS, are frequently mutated in codons 12 and 13 in exon 1 and less frequently in codon 61 which enable perturbation of the intrinsic GTPase activity of Ras proteins resulting in reductions in GTP hydrolysis capacity, and hence a constitutively active protein (Scheffzek et al., 1997).
Approximately 40–45% of colorectal cancers harbor KRAS mutations (De Roock et al., 2011), and mutation status is predictive of resistance to anti‐EGFR‐based targeted therapy in patients with metastatic colorectal cancer receiving cetuximab or panitumumab (Misale et al., 2014). Because of its high prevalence in human tumors, targeting mutant Ras itself has stimulated an intense research effort over the years, but to date, mutant Ras has not been a druggable target. Alternately, agents that block downstream effectors of Ras proteins through their canonical mitogen‐activated protein kinases (MAPKs) such as BRAF and MEK1/2 as well as phosphoinositide 3 kinases (PI3K) such as PI3K, AKT, or mTOR inhibitors have rapidly entered clinical trials (Knickelbein and Zhang, 2015). The efficacy of these inhibitors has been poor due to the activation of alternative oncogenic Ras‐mediated pathways, suggesting that inhibition of multiple downstream targets is required. Despite this, in recent years through genomic profiling of Ras‐mutant tumors and RNAi‐mediated gene silencing, many investigators have highlighted Ras‐dependent signaling in mutant tumors which could be targeted for therapeutic intervention by taking advantage of the synthetic lethality concept, whereby simultaneous loss of two genes results in cell death, but deletion of either individually does not impact cell viability. As such, TBK1 (Barbie et al., 2009), STK33 (Scholl et al., 2009), PLK1 (Luo et al., 2009), GATA2 (Kumar et al., 2012), TAK1 (Singh et al., 2012), CDK4 (Puyol et al., 2010), BCL‐XL (Corcoran et al., 2013), STAT3‐cMET (Van Schaeybroeck et al., 2014) as well as APC proteosome complex (Luo et al., 2009) could be viable targets for clinical development in KRAS‐mutant tumors.
The yeast Saccharomyces cerevisiae is a lower eukaryotic model with a simple compact genome, providing a powerful genetic system to understand the functional biology of thousands of genes via genetic deletion studies (Ooi et al., 2006). This yeast system has been used to discover synthetic lethal interactions among multiple genes to identify genetic interactions that can recapitulate similar genetic functions in mammalian systems. Similar to mammalian Ras proteins, yeast S. cerevisiae contains two Ras proteins, Ras1 and Ras2, which play a central role in controlling cAMP activity (Toda et al., 1985), and through MAPK signaling, both proteins regulate diploid pseudohyphal growth and haploid invasive growth, respectively (Gimeno et al., 1992; Stanhill et al., 1999). These studies and others in yeast have contributed enormously to our understanding of RAS signaling in humans. The similarity between yeast and human Ras proteins supports utilization of the yeast model system to study Ras genetic interactions in humans.
As direct pharmacological inhibition of the onco‐Ras proteins has thus far been unsuccessful in clinical trials, by leveraging the largest yeast synthetic lethal interactome (Costanzo et al., 2010; Deshpande et al., 2013), we explored genetic interactions in yeast to identify putative candidates for Ras‐interacting genes in mammalian cells. We report that the DNA double‐strand break repair (DSB repair) by homologous recombination (HR) pathway was enhanced in KRAS‐mutant colorectal cancer cells through hyperactivation of c‐MYC. Targeting RAD51, a downstream effector of homologous recombination repair (HRR) or CHK1 inhibition, thus may offer a novel strategy in killing mutant KRAS‐dependent colorectal cancers. Because the links between RAD51 and mutant KRAS‐mediated signaling was not known in the context of DNA damage response (DDR) regulation, these results also provide the first evidence on the role of KRAS mutations in hyperactivating HRR.
2. Materials and methods
2.1. Reagents
AZD6244, BEZ235, RI‐1, and AZD2281 were purchased from Selleck Chemicals LLC (Houston, TX, USA). siRNAs were purchased from Shanghai Gene Pharma (Shanghai, China). Lipofectamine® RNAiMAX and Lipofectamine® LTX with Plus™ Reagents were purchased from Life Technologies, Carlsbad (CA, USA) and CellTiter 96® AQueous One Solution Cell Proliferation Assay from Promega Corporation, Fitchburg (WI, USA). The HA‐c‐MYC WT and S62A expression constructs were a gift from Professor Wuhan Xiao, Institute of Hydrobiology, Chinese Academy of Sciences.
2.2. Antibodies
The following antibodies were used in this study: RAD51 (GTX70230; GeneTex, Inc., Irvine, CA, USA), EMD Millipore, Billerica, MA, USA: RAD51 (PC130), γH2AX S139 (05‐636); Cell Signaling Technology, Inc., Danvers, MA, USA antibodies: PARP (#9542), pAKT S473 (#4060), AKT(#9272), pERK1/2 (#4370), ERK1/2 (#4695), HA (#3724), pP53 S15 (#9284), pCHK1 S345 (#2348), cleaved caspase 3 (#9664); Bethyl Laboratories, Inc., Montgomery, TX, USA antibodies: pKAP1 S824 (A300‐767A‐T), pRPA32 S4/S8 (A300‐245A), pRPA32 S33 (A300‐246A); and others: Cox‐IV (PN926‐42214, LI‐COR Biosciences, Lincoln, NE, USA), C‐MYC (AB32072), anti‐BrdU (ab6326; Abcam, Melbourne, Vic. Australia), 53BP1 (NB100‐304; Novus Biologicals, Littleton, CO, USA ) and anti‐BrdU (347580; Becton, Dickinson and Company, Franklin Lakes, NJ, USA).
2.3. Sequence alignment
Clustal Omega (http://www.ebi.ac.uk/Tools/msa/clustalo/) was used to align all the sequences.
2.4. Cell culture
The isogenic colorectal cancer cell lines, HCT116, HKh‐2, HKe‐3 DLD‐1, and DKs‐8, were obtained from Professor Senji Shirasawa (Fukuoka University, Japan) under a material transfer agreement and maintained in DMEM supplemented with 10% FBS. Other colorectal cancer lines were obtained from Professor Barbara Leggett (QIMR Berghofer, Australia). All cell lines were regularly tested for mycoplasma infection and authenticated using short tandem repeat profiling by scientific services at QIMR Berghofer Medical Research Institute.
2.5. Reverse transcriptase quantitative PCR
RNA was extracted using RNeasy Mini Kit (Qiagen, Venlo, Limburg, the Netherlands), and cDNA was synthesized using the SuperScript III First‐Strand Synthesis System (Life Technologies) according to the manufacturer's instructions. RT‐qPCR was performed on a LightCycler 480 (Roche, Basel, Switzerland) using SYBR Green (Roche) and normalized to β‐actin as an internal control (Table S1).
2.6. Ingenuity pathway analysis
Ingenuity pathway analysis was performed using the Ingenuity Pathway Analysis® (IPA) software (Ingenuity Systems®, Redwood City, CA, USA) licensed to QIMRBerghofer.
2.7. siRNA transfection and cell viability
siRNA sequences as described in Table S2 were used for target validation. siRNA transfections (10 nm) were carried out using Lipofectamine® RNAiMAX, and cell viability was determined using AQueous One Solution Cell Proliferation Assay kit as previously described (Al‐Ejeh et al., 2014; Srihari et al., 2016). siRNA sequences were designed as 27mers (minimizing off‐target effects compared to 21mers) and BLAST‐analyzed to check for specificity. These three sequences were pooled at a final concentration of 10–20 nm to further minimize off‐target effects (Table S2).
2.8. Flow cytometry
Flow cytometry analysis was performed to determine cell cycle perturbations following 6‐Gy irradiation (IR) after 6 h, fixed in 70% ethanol overnight at 4 °C, washed, and stained with propidium iodide. Cell phases were analyzed using modfit lt 4.0 software Verity (Software House, Topsham, ME, USA) (Van Schaeybroeck et al., 2014).
2.9. Immunoblotting
Immunoblotting was performed as described previously (Srihari et al., 2016; Van Schaeybroeck et al., 2014).
2.10. DNA combing assay
The DNA fiber protocol was followed as described previously (Schwab and Niedzwiedz, 2011). 5 × 10⁴ cells were seeded overnight that were pulsed for 20 min with 250 μm IdU (Sigma I7125; Sigma‐Aldrich, Castle Hill, NSW, Australia), followed by pulsing with 50 μm CldU (Sigma C6891; Sigma‐Aldrich). The cells were washed thrice with PBS and trypsinized, washed once more, and resuspended in PBS. Two microlitre of cells were spotted onto glass slides (~1500 cells per slide) and lysed for 36 min with 7 μL of spreading buffer (0.5% SDS in 200 mm Tris/HCl pH 7.4 and 50 mm EDTA). Slides were tilted at a 15° angle to allow DNA spreading followed by fixation in a 3 : 1 volume of absolute methanol/glacial acetic acid for 10 min and air‐dried. Samples were denatured in 2.5 m HCl for 60 min at room temperature and rinsed before blocking in PBS/0.1% Triton X‐100/1% BSA for 1 h at room temperature. Slides were incubated for 2 h using mouse anti‐BrdU (1 : 10 dilutions; Becton, Dickinson and Company, 347580) antibody to detect IdU and anti‐BrdU (1 : 200 dilution, BU1/75; rat anti‐BrdU, Abcam, ab6326) antibody to detect CldU. Slides were then washed three times in PBS, followed by secondary antibody staining with Alexa Fluor 546‐conjugated goat anti‐mouse (1 : 300 dilutions) (Life Technologies, A‐11030) and Alexa Fluor 488‐conjugated chicken anti‐rat (1 : 300 dilutions) (Life Technologies, A21470) for 1 h at room temperature. Coverslips were mounted using Prolong Plus (Invitrogen, P36930) and imaged using a 63× objective on a Zeiss 780‐NLO confocal microscope (Zeiss, Oberkochen, Germany). Progressive replication fork speed was calculated based on the length of the CldU tracks measured using imagej software (https://imagej.nih.gov/ij/index.html). At least 300 replication tracks were analyzed for each sample in two independent experiments. The fork speed was calculated based on conversion factor 1 μm = 2.59 kb (Henry‐Mowatt et al., 2003).
2.11. Foci formation and immunofluorescence staining
Cells were seeded on the 0.1% poly‐l‐lysine‐coated coverslips or Ibidi 8‐well chamber slides. To determine RAD51/53BP1 and γH2AX foci accumulation, cells were irradiated (IR) with indicated doses of ionizing radiation using a (137cesium) source, pre‐extracted with cytoskeletal buffer (CSK) (10 mm Pipes, pH 6.8, 300 mm sucrose, 100 mm NaCl, 3 mm MgCl2, 1 mm EGTA) for 5 min, and fixed in 4% paraformaldehyde prior at the indicated time points as described previously. Foci were imaged on a Deltavision Personal deconvolution microscope as described previously (Richard et al., 2008) and scored using the Find Maxima function on Image J (NIH).
2.12. DNA repair kinetics foci formation and immunofluorescence staining
To obtain DNA repair kinetics using γ‐H2AX or 53BP1 foci, cells were irradiated, fixed at time points ranging from 0.5 to 24 h postirradiation with 1 Gy, and immunostained with indicated antibodies. The number of γ‐H2AX or 53BP1 foci was determined for each time point (average of 50 nuclei) and, after subtracting background (number of foci in nonirradiated nuclei), the percentage foci remaining was plotted against repair time to obtain DNA repair kinetics.
2.13. Homologous recombination repair (HRR) assay
0.5 × 10⁶ cells of the isogenic colorectal cancer lines, HCT116, HKh‐2, HKe‐3, were transiently transfected with 3 μg pDRGFP, a truncated eGFP plasmid with 1 μg pCBASceI, a vector that expresses I‐SceI nuclease according to a published protocol with minor modification (Pierce et al., 1999). Twenty‐four hour post‐transfection, cells were collected by trypsinization, resuspended in 400 μL of 1% PBS/FCS, and immediately analyzed using BD FACSCanto™ II Cell Analyzer (BD Biosciences, San Jose, CA, USA). Flow cytometry analysis was performed by excitation of eGFP with a 488‐nm laser, and emissions were collected with a 530/30 filter. For transfection efficiency and data normalization, eGFP empty vector‐transfected cells were used.
2.14. Statistical analysis
Student's t‐tests, one‐way or two‐way ANOVA with Bonferroni post hoc testing was performed using graphpad prism v6.0 (GraphPad Software, LaJolla, CA, USA), and the P‐values were calculated as indicated in figure legends. Asterisks indicate significant differences (*P < 0.05; **P < 0.01; ***P < 0.001; ****P < 0.0001), n.s. = not significant.
3. Results
3.1. Homologs of mammalian Ras in S. cerevisiae (Ras1 and Ras2) identify putative candidates of Ras genetic interacting genes in humans
In order to identify synthetically lethal Ras genetic interactions, we took advantage of a recently published dataset in yeast S. cerevisiae by Costanzo et al. (2010). The authors applied a stringent genetic interaction cutoff based on confidence threshold [|ε (epsilon)| < −0.08, P < 0.05, defined as genetic interaction score (GIS)] to determine false‐negative and false‐positive rates of genetic interactions among individual genes from 5.4 million gene–gene pairs for synthetically lethal genetic interactions. By employing this largest dataset, Deshpande et al. (2013) stratified 24 205 interactions among 1666 yeast S. cerevisiae genes with orthologs to human genes to study genetic interactions in humans. Using this filtered dataset, we were particularly interested in looking for possible genetic interactions of yeast Ras1 and Ras2 which are orthologs to human RRAS2 and RRAS, respectively. The lack of colorectal cancer‐associated RRAS or RRAS2 mutations led us to search for additional human orthologues of yeast Ras1 and Ras2. The N‐terminal regions of human Ras proteins undergo frequent colorectal cancer‐associated hotspot mutations at codons 12, 13, and 61, and this region does share homology with yeast Ras1 and Ras2 (Fig. S1A) and is closely related to KRAS (Fig. S1B). Ras1 and Ras2 genes are essential for vegetative growth in yeast and share many functional similarities between the yeast and mammalian Ras genes (DeFeo‐Jones et al., 1985), so we reasoned that the genetic interactions with Ras1 and Ras2 in yeast may correspond to a genetic interaction with mammalian KRAS.
To test this, we applied a similar filter as Deshpande et al. (2013), but restricted our analysis to (a) intermediate interactions as our analysis is based on homologs and not orthologs (ε < −0.08) for both genetic interactions of gene A–gene B and vice versa (AB‐BA), and (b) only 1‐1 orthologs are considered. We recovered 39 putative Ras1 and Ras2 interacting genes in yeast (Table 1). Of these 39 putative genetic interacting genes, six orthologs to human genes (EMG1, MRE11A, ORC2L, ACOT8, LSM6, and DDX31) particularly showed strong GIS with either Ras1 or Ras2, ε < −0.2, P < 0.05 (Table 1). Eleven orthologs genes showed intermediate GIS with ε < −0.1, while the rest were between ε < −0.1 and −0.08 GIS. Collectively, we identified a list of putative yeast Ras genetic interacting genes that could be tested for synthetic lethal interactions with Ras oncoproteins in the mammalian system.
Table 1.
Synthetic lethal partner with RAS1/2 in yeast identifies putative synthetic lethal partners of RAS in human genome
| Yeast RAS | GI | Human ortholog | Gene description | Epsilon (GIS) |
|---|---|---|---|---|
| RAS1 | RFC3 | RFC5 | Replication factor C (activator 1) 5, 36.5 kDa | −0.081 |
| RAS2 | UBX5 | UBXN7 | BX domain protein 7 | −0.081 |
| RAS2 | RAD18 | RAD18 | RAD18 E3 ubiquitin protein ligase | −0.082 |
| RAS2 | RPS16A | RPS16 | Ribosomal protein S16 | −0.083 |
| RAS2 | PDB1 | PDHB | Pyruvate dehydrogenase (lipoamide) beta | −0.085 |
| RAS2 | TAN1 | THUMPD1 | THUMP domain containing 1 | −0.085 |
| RAS2 | RPL37A | RPL37 | Ribosomal protein L37 | −0.094 |
| RAS2 | ELP2 | ELP2 | Elongator acetyltransferase complex subunit 2 | −0.095 |
| RAS2 | NUP57 | NUP54 | Nucleoporin 54 kDa | −0.096 |
| RAS2 | PEX10 | PEX10 | Peroxisomal biogenesis factor 10 | −0.096 |
| RAS2 | PEX14 | PEX14 | Peroxisomal biogenesis factor 14 | −0.096 |
| RAS1 | ALG1 | ALG1 | ALG1, chitobiosyldiphosphodolichol beta‐mannosyltransferase | −0.102 |
| RAS2 | PAT1 | PATL1 | Protein associated with topoisomerase II homolog 1 (yeast) | −0.103 |
| RAS2 | VPS41 | VPS41 | Vacuolar protein sorting 41 homolog (Saccharomyces cerevisiae) | −0.104 |
| RAS1 | MMF1 | HRSP12 | Heat‐responsive protein 12 | −0.109 |
| RAS2 | UBI4 | UBC | Ubiquitin C | −0.111 |
| RAS2 | RPS19B | RPS19 | Ribosomal protein S19 | −0.118 |
| RAS2 | KTI12 | KTI12 | KTI12 chromatin‐associated homolog | −0.127 |
| RAS2 | PCP1 | PARL | Presenilin‐associated, rhomboid‐like | −0.129 |
| RAS2 | SLM3 | TRMU | tRNA 5‐methylaminomethyl‐2‐thiouridylate methyltransferase | −0.13 |
| RAS2 | MPP10 | MPHOSPH10 | M‐phase phosphoprotein 10 (U3 small nucleolar ribonucleoprotein) | −0.13 |
| RAS2 | RAD51 | RAD51 | RAD51 recombinase | −0.135 |
| RAS2 | RPS16B | RPS16 | Ribosomal protein S16 | −0.136 |
| RAS2 | PHB2 | PHB2 | Prohibitin 2 | −0.136 |
| RAS1 | DYS1 | DHPS | Deoxyhypusine synthase | −0.139 |
| RAS2 | RAD27 | FEN1 | Flap structure‐specific endonuclease 1 | −0.139 |
| RAS2 | VPS28 | VPS28 | Vacuolar protein sorting 28 homolog (S. cerevisiae) | −0.139 |
| RAS2 | ERS1 | CTNS | Cystinosin, lysosomal cystine transporter | −0.14 |
| RAS2 | TMA22 | DENR | Density‐regulated protein | −0.152 |
| RAS2 | PAA1 | AANAT | Aralkylamine N‐acetyltransferase | −0.159 |
| RAS2 | OST2 | DAD1 | Defender against cell death 1 | −0.162 |
| RAS2 | YLR050C | TMEM97 | Transmembrane protein 97 | −0.166 |
| RAS2 | RIA1 | EFTUD1 | Elongation factor Tu GTP‐binding domain containing 1 | −0.192 |
| RAS2 | EMG1 | EMG1 | EMG1 N1‐specific pseudouridine methyltransferase | −0.205 |
| RAS2 | MRE11 | MRE11A | MRE11 homolog A, double‐strand break repair nuclease | −0.206 |
| RAS2 | ORC2 | ORC2L | Origin recognition complex, subunit 2 | −0.222 |
| RAS2 | TES1 | ACOT8 | Acyl‐CoA thioesterase 8 | −0.243 |
| RAS2 | LSM6 | LSM6 | LSM6 homolog, U6 small nuclear RNA and mRNA degradation associated | −0.254 |
| RAS2 | DBP7 | DDX31 | DEAD (Asp‐Glu‐Ala‐Asp) box polypeptide 31 | −0.283 |
| aRAS1 | RAS2 | RRAS2 RRAS | Related RAS viral (r‐ras) oncogene homolog | −0.822 |
| aRAS2 | RAS1 | RRAS2 RRAS | Related RAS viral (r‐ras) oncogene homolog 2 | −0.822 |
GIS is genetic interaction score in yeast with P < 0.05.
Known genetic interaction in yeast as positive control.
3.2. Ras1 and Ras2 genetic interactions in yeast are enriched in DNA damage signaling
Because clusters of genes from the same pathway or similar biological processes tend to share similar genetic interaction profiles (Tong et al., 2004), we analyzed the 39 identified genes from the Ras1 and Ras2 interactome to determine core biological processes that are important in Ras‐mediated oncogenesis in humans. Ingenuity pathway analysis showed that multiple cancer‐mediated signaling networks clustered (Fig. 1A). Importantly, we found that this large network is substantially linked to DSB repair by HRR (P = 3.0 × 10⁻⁴), the BRCA1‐mediated DDR (P = 4.06 × 10⁻⁴), mismatch repair in eukaryotes (P = 3.95 × 10‐4) as well as E1F2 signaling (P = 3.73 × 10⁻⁴) (Fig. 1A), consistent with a recently published report on wild‐type (WT) HRAS and NRAS promoting mutant KRAS‐driven tumorigenesis by modulating the DDR in colorectal cancer cells (Grabocka et al., 2014). Notably, deregulated Ras signaling has been shown to compromise DNA damage checkpoint recovery in S. cerevisiae (Wood and Sanchez, 2010). It is also well documented that Ras signaling is hyperactivated in a majority of breast tumors (Schubbert et al., 2007), although mutations in Ras members are very rare in breast cancers. Consistent with this, we also noticed that the hereditary breast cancer signaling network (also enriched with DDR) (P = 3.87 × 10⁻⁶) was significantly associated with Ras signaling (Fig. 1A). Moreover, pathway enrichment analysis with KRAS as a query gene identified a core biological network linking 17 of 39 genes from this yeast genetic interactome to Ras‐dependent signaling either through AKT or through NFκB complexes (Fig. 1B). Both pathways have been well studied in the context of Ras signaling in cancers (McCubrey et al., 2012; Samatar and Poulikakos, 2014).
Figure 1.
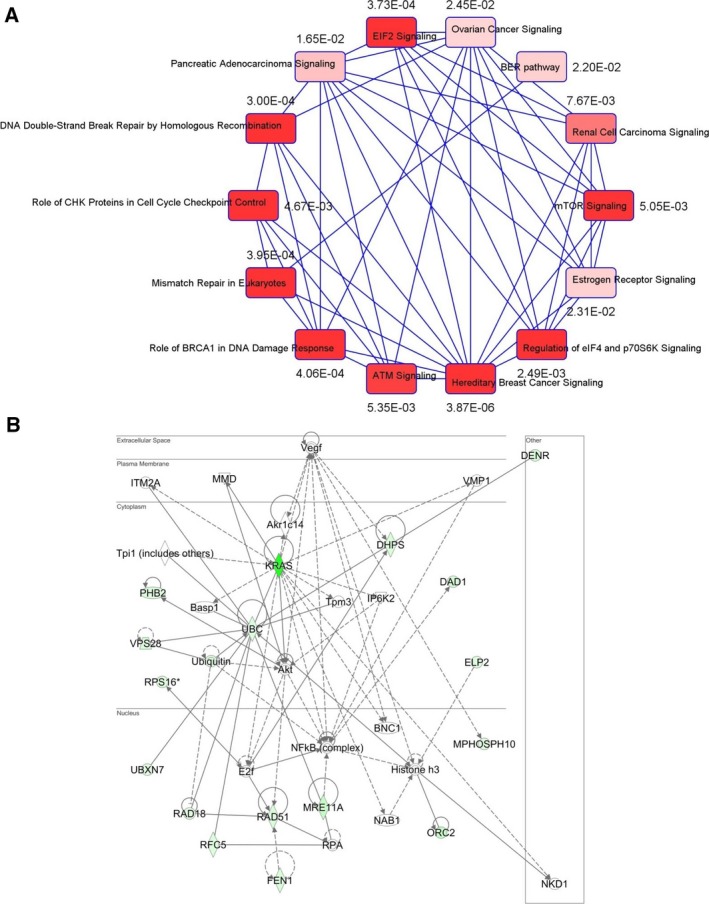
KRAS‐dependent genetic network analysis. (A) Correlation‐based network with P‐value connecting possible Ras‐interacting genes with similar genetic interaction clusters showing pathway enrichment in DNA damage response signaling. (B) Using KRAS as a ‘query gene’, the 39 genes were included to the ingenuity pathway analysis (IPA) to determine possible KRAS‐mediated network. Seventeen of 39 genes were clustered by KRAS gene in the network. The pathway analysis revealed central nodes of AKT or NFκB in regulating HRR genes.
3.3. RAD51 and PARL are putative essential genes for mutant KRAS‐dependent colorectal cancer cell survival
We next asked whether human Ras genes could have analogous synthetically lethal genetic pairs as yeast Ras. If this were the case, we would expect inhibition of these interactions to selectively kill mutant, constitutively activated KRAS‐dependent cells compared to WT counterparts. To investigate this, we utilized an isogenic set of KRAS‐mutant (mt) HCT116 (constitutively active KRAS) and genetically corrected WT HKh‐2 and HKe‐3 colorectal cancer lines (Shirasawa et al., 1993; Van Schaeybroeck et al., 2014), which exhibited similar growth rates (Fig. S2A). Because our network analysis was enriched with DNA damage and repair signaling, we selected RAD51 and FEN1 as candidate genes (both interconnected by AKT signaling; moreover, RAD51 is an essential component for HRR) (Baumann and West, 1998; Kikuchi et al., 2005) along with Prohibition 2 (PHB2)/RAF which has been shown to interact with C‐RAF for epithelial migration (Chowdhury et al., 2014; Mishra et al., 2005; Rajalingam and Rudel, 2005; Rajalingam et al., 2005). We also selected DAD1, identified as protector of apoptosis (Hong et al., 2000); ELP2, a necessary component for functional elongator (Dong et al., 2015), and PARL, an inner mitochondrial membrane rhomboid (Cipolat et al., 2006) as putative Ras synthetic lethal genes. RNAi‐mediated depletion of each gene in the isogenic lines showed that depletion of RAD51 and PARL selectively killed KRAS‐dependent mutant HCT116 cells compared to WT HKh‐2 cells (Fig. 2A). This cell line is dependent on mutant KRAS for survival as KRAS depletion alone promotes cell death as previously reported by us and others (Steckel et al., 2012; Van Schaeybroeck et al., 2014). Unexpectedly, depletion of DAD1 and ELP2 significantly enhanced cell viability in KRAS WT cells, suggesting that mutant KRAS is unlikely to regulate either of these genes. Moreover, we found that depletion of PHB2 had a more profound effect on lethality in KRAS‐mutant cells than their WT counterpart; however, PHB2 depletion alone slightly reduced cell viability in WT cells (Fig. 2A). In addition, a significant differential effect was also observed following FEN1 depletion. To confirm this selectivity, we used KRAS‐independent isogenic DLD‐1/DKs‐8 lines (Singh et al., 2012) and found that only PHB2 depletion showed selectivity in killing mutant cells, while FEN1 showed a similar trend of inhibition as seen in isogenic HCT116 cells (Fig. 2B). To further validate gene‐to‐gene interactions, we codepleted KRAS with FEN1, RAD51, PARL, and PHB2 in the HCT116 and HKe‐3 pair (Figs 2C and S2B,C). We found that when KRAS was codepleted with RAD51, FEN1, and PARL (but not PHB2), cell viability was significantly reduced in KRAS‐mutant cells compared to WT cells. Collectively, our cross‐species validation of synthetic lethal interactions suggested that RAD51, FEN1, and PARL are likely essential in the presence of mutant KRAS‐driven signaling in colorectal cancer cells and, of these three, RAD51 is dysregulated in many cancers and has been identified as a potential target for drug discovery (Ward et al., 2015).
Figure 2.
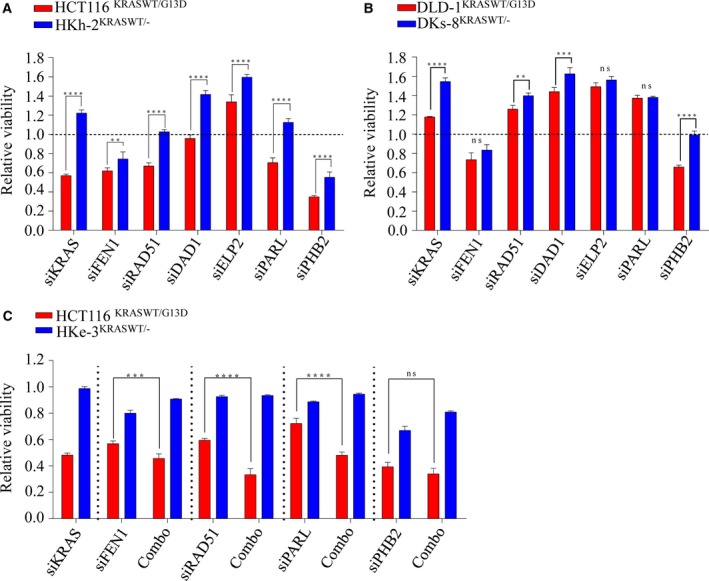
Validation of synthetic lethal interactions with KRAS in isogenic colorectal cancer lines. (A, B) Isogenic lines were reverse‐transfected with 10 nm of indicated siRNAs, and cell viability was determined after 96 h. (C) HCT116 and HKe‐3 lines were transfected with 10 nm of siRNA individually or in combination with siKRAS and cell viability was determined after 96 h. Scr: Scrambled siRNA was used as control and relative cell viability was determined to the scr control‐transfected cells. ****P < 0.0001; ***P < 0.001; **P < 0.01; ns: not significant. Error bars represent the standard error of the mean (SEM) from three independent experiments.
3.4. KRAS mutation induces replication stress and DNA damage
Depletion of RAD51 in isogenic KRAS‐mutant and WT lines as measured by both cell viability and death implicated its critical role in survival in the KRAS‐mutant context (Fig. S2D). The RAD51 protein is a key component of HRR‐mediated DSB repair, which occurs predominantly during the S and G2 phases of the cell cycle. As our results show that cells expressing mutant KRAS are likely dependent on RAD51 for survival, we hypothesized that these cells are reliant on augmented HRR, perhaps in order to survive a higher burden of oncogenic‐mediated replication stress and associated DNA breaks. Consistent with this notion, we found the KRAS‐mutant cells have a higher burden of replication stress, which is evident by a significant increase in stalled replication forks (Fig. 3A,B), which corresponded with increased γH2AX and pRPA32 (S33) signaling. Moreover, we found an increase in basal protein levels of HRR proteins including CHK1, NBS1, and RAD51 in the HCT116‐mutant line compared to the HKe‐3 WT line (Fig. 3C), which is likely to be transcriptional as per a recent report (Kotsantis et al., 2016). In this study, when HRASV12 was ectopically overexpressed in immortalized human fibroblasts, RNA synthesis was found to be increased together with R‐loop accumulation, which resulted in replication fork slowing and DNA damage in a mutant RAS‐dependent manner. In line with this, we found that the mutant HCT116 line has a slower rate of replication fork progression compared to the WT line (Figs 3D,E and S2E). Collectively, these results suggest that mutant KRAS increases replication stress and DNA damage resulting in a greater dependency on HRR for survival.
Figure 3.
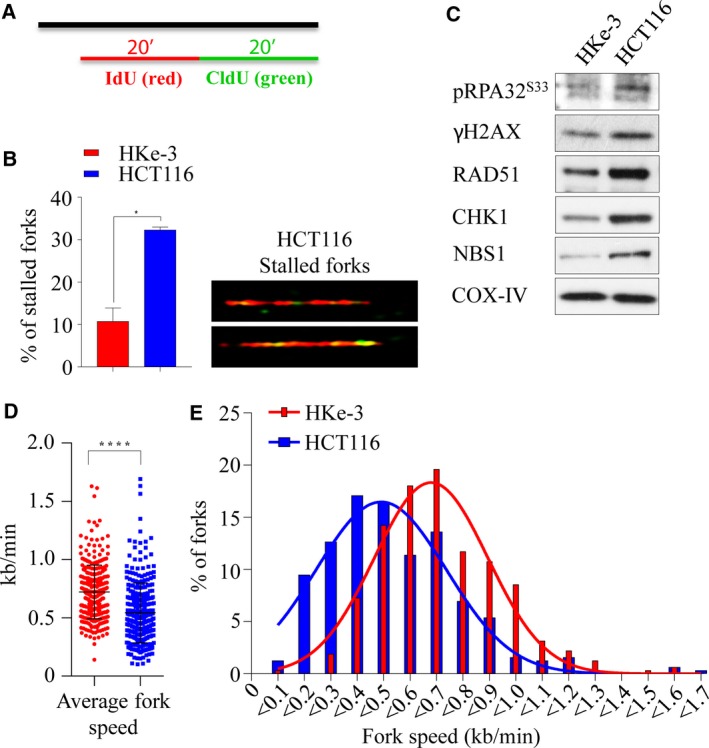
Mutant KRAS‐induced replication stress and DNA damage. (A) Labeling of BrdU analogs for DNA fiber analysis during replication. Both isogenic KRAS‐mutant (HCT116) and wild‐type (HKe‐3) cells pulse‐labeled with IdU (red) and CldU (green) for 20 min and the fibers were imaged and quantified. (B) Percentage of stalled replication forks (left) and representative images of stalled replication fork DNA fibers in HCT116 (right). (C) Immunoblot analysis of phospho‐S33 RPA32, γH2AX, RAD51, CHK1, and NBS1 in isogenic lines. COX‐IV expression was used as a loading control. Velocity of progressing forks (D) and distributions of replication fork speeds (E) were determined in both isogenic lines. At least 300 fibers from each cell line were analyzed from two independent experiment, and error bars represent the standard error of the mean (SEM). Unpaired t‐test with and without Welch's correction between two groups was used to determine the statistical significance, *P < 0.05; ****P < 0.0001.
3.5. RAD51 as a potential therapeutic target in KRAS‐mutant colorectal cancer
As KRAS‐mutant cells are dependent on HRR signaling, we first sought to determine the integrity of HRR in the isogenic lines. We treated HCT116, HKh‐2, and HKe‐3 lines with 6‐Gy of IR, and assessed RAD51 foci formation after 6 h, as a surrogate for HRR efficiency. Interestingly, we observed significantly higher numbers of RAD51 foci‐positive cells in the HCT116‐mutant line compared to the HKh‐2 and HKe‐3 WT counterparts (63% vs. 16–20%, P < 0.0001), suggesting possible increased levels of HRR dependency in KRAS‐mutant line (Fig. 4A,B left). The increase in RAD51 foci formation can be attributed in part to increased expression of RAD51 in KRAS‐mutant cells compared to WT counterparts (Figs 3C and 4B right). To determine whether the increased RAD51 foci formation was due to an increased proportion of cells in the S and G2 phases of the cell cycle, we performed propidium iodide (PI) cell cycle analysis on these cells. Treatment with IR did not result in apoptosis, and all three cell lines exhibited similar increases in the S/G2 population [HCT116 (96%); HKe‐3 (82%); HKh‐2 (72%)], suggesting the increase in RAD51 foci does not result from cell cycle differences (Figs 4C and S3A). Thus, these results suggested that HRR‐related events are greatly stimulated in cells expressing mutant KRAS. To address this possibility, we used an in vivo plasmid recombination GFP‐based assay, which measures reconstitution of GFP signal after induction of DSBs by the I‐SceI endonuclease (Pierce et al., 1999). As shown in Fig. 4D, KRAS‐mutant cells exhibited a significantly higher rate of HRR (fivefold increase) compared to isogenic WT cells. Consistent with this, we found that KRAS‐mutant cells were more proficient than WT cells in repairing IR‐induced DSBs, quantified by 53BP1 or γH2AX foci clearance (Figs 4E,F and S3B,C). Importantly, this increase in repair proficiency was seen only in cells in the S/G2 phases of the cells cycle where HRR is used for repair, but not in the G1 phase where nonhomologous end joining (NHEJ) is the repair pathway of choice. This suggests that KRAS mutation may play a significant role in DNA damage clearance during the S and G2 phases of the cell cycles and that this predominantly occurs by employing HRR.
Figure 4.
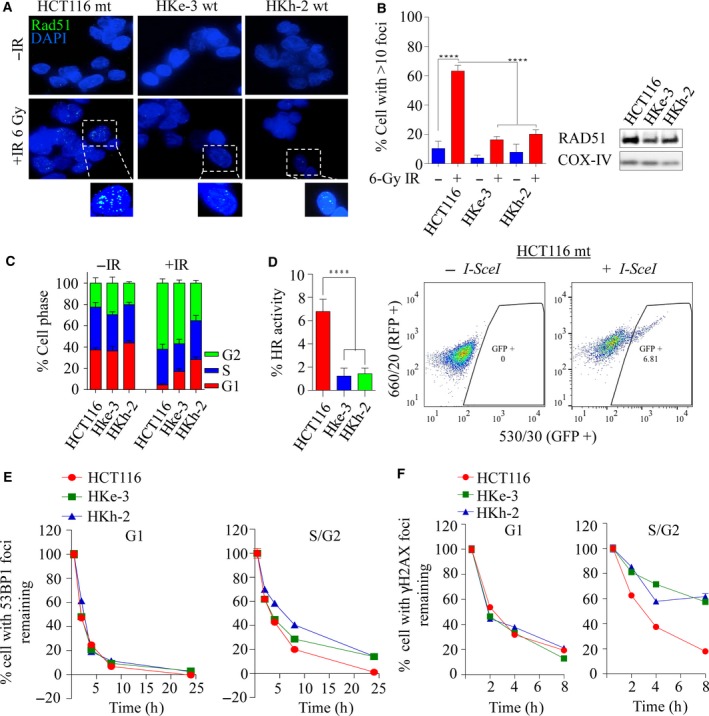
Mutant KRAS‐mediated RAD51‐dependent homologous recombination repair is elevated in KRAS‐mutant colorectal cancer. (A) Representative images of the isogenic colorectal cancer lines immunostained with anti‐RAD51 (green) and anti‐DAPI (blue) following 6‐Gy ionizing radiation processed after 6 h. (B) Left: quantification of RAD51 foci‐positive cells from experiment in A. The percentage of cells with > 10 RAD51 foci was calculated. Error bars denote SEM (n = 3 with more than 50 cells scored for each independent experiment). Right: immunoblot analysis of RAD51 expression in the isogenic lines. COX‐IV was used as a loading control. (C) Propidium iodide (PI) cell cycle profiles of isogenic cell lines before and at 6 h following 6 Gy of ionizing radiation, n = 3 ± SEM. (D) Left: HRR efficiency in isogenic lines was determined using an HRR reporter assay based on pDR‐GFP and I‐SceI (pCBSCE) plasmids. Twenty‐four hours after cotransfection, FACS analysis was carried out to detect GFP‐positive cells, n = 2 ± SEM. Right: representative images of GFP‐positive cells that had successfully undergone HRR in HCT116 cells. Quantification of (E) 53BP1 and (F) γH2AX foci clearance following 1 Gy of ionizing radiation in a time‐dependent manner in KRAS‐mutant and wild‐type isogenic colorectal cancer lines. Y‐axis represents percentage of foci remaining at the indicated time points (with the average number of foci at 0.5 h being 100%). Cells were costained for cyclin A to demarcate G1 (cyclin A −ve) versus S/G2 (cyclin A +ve) populations. The percentage of cells with foci remaining was calculated and plotted against the indicated times post‐IR. Error bars denote SEM (50 nuclei were scored for each time point).
3.6. RAD51 loss impacts survival advantage in KRAS‐mutant colorectal cancer
To determine whether increased RAD51 expression is a common phenomenon in mutant KRAS cell lines, we next assessed a panel of colorectal cell lines for RAD51 protein levels by immunoblotting (Fig. 5A). We noted a trend toward increased RAD51 levels in KRAS‐ and BRAF‐mutant lines compared to WT lines, suggesting a possible reliance on RAD51 expression and HRR dependence. Given the apparent increase in RAD51 levels in KRAS‐ and BRAF‐mutant cell lines, we next wanted to test for their dependency between KRAS and RAD51. To investigate this, we depleted RAD51 alone or in combination with KRAS by siRNA in SW480 (KRASmt) and SW48 (KRASwt) cell lines and found that combined depletion decreased cell viability in mutant, but not WT cells (Fig. 5B,C left). To further confirm this observation, we used 0.5 μm AZD6244 (Davies et al., 2007), a MEK1/2 inhibitor to inhibit ERK1/2‐dependent signaling (a major downstream effector of mutant KRAS) in these cells. MEK1/2 inhibition alone significantly affected cell viability in both cell lines irrespective of KRAS mutational status, and this was enhanced following RAD51 depletion (Fig. 5B,C right). One possible explanation for this synergistic effect observed in SW48wt could be due to an EGFR mutation (c.2155G>A) which constitutively activates MAPK signaling in this line. Consistent with this, nuclear EGFR has been shown to play roles in regulating DSB repair by interacting with DNA‐PK, ATM, RAD51, and BRCA1 either through PI3K‐AKT or through Ras‐Raf‐MAPK pathway (Chen and Nirodi, 2007; Mukherjee et al., 2009, 2010). Moreover, Yeh et al. (2009) suggested that KRAS/BRAF‐independent ERK1/2 activation in WT cells may account for MEK1/2i sensitivity (Hao et al., 2007). Despite this, we found that the WT DKs‐8 cells did not respond to combined inhibition (Fig. S4A). In addition, RAD51 depletion alone decreased cell viability in both LoVo (KRAS mt) and RKO (BRAF mt) lines, and this was significantly enhanced with MEK1/2 inhibition at a proportion greater than the expected lethality (Fig. 5D). In line with this, we also depleted RAD51 in the isogenic HCT116 (mt) and HKe‐3 (WT) lines for 48 h to see whether the specific cell inhibition in mutant cells was accompanied by apoptosis. We found that mutant HCT116 cells were more susceptible to RAD51 loss‐dependent apoptosis compared to WT cells. This was associated with an increase in DSBs following RAD51 depletion marked by γ‐H2AX protein accumulation (Fig. 5E). Moreover, we found that following RAD51 depletion, survival signaling such as ERK1/2 and AKT was impacted in mutant HCT116 cells, but not in WT HKe‐3 cells, suggesting that RAD51 plays a significant role in regulating cell survival pathways through MAPK‐AKT signaling (Fig. 5E). Collectively, our data suggest that KRAS‐ or BRAF‐mutant colorectal cancer lines are likely selectively dependent on Ras‐mediated RAD51‐dependent HRR signaling for survival.
Figure 5.
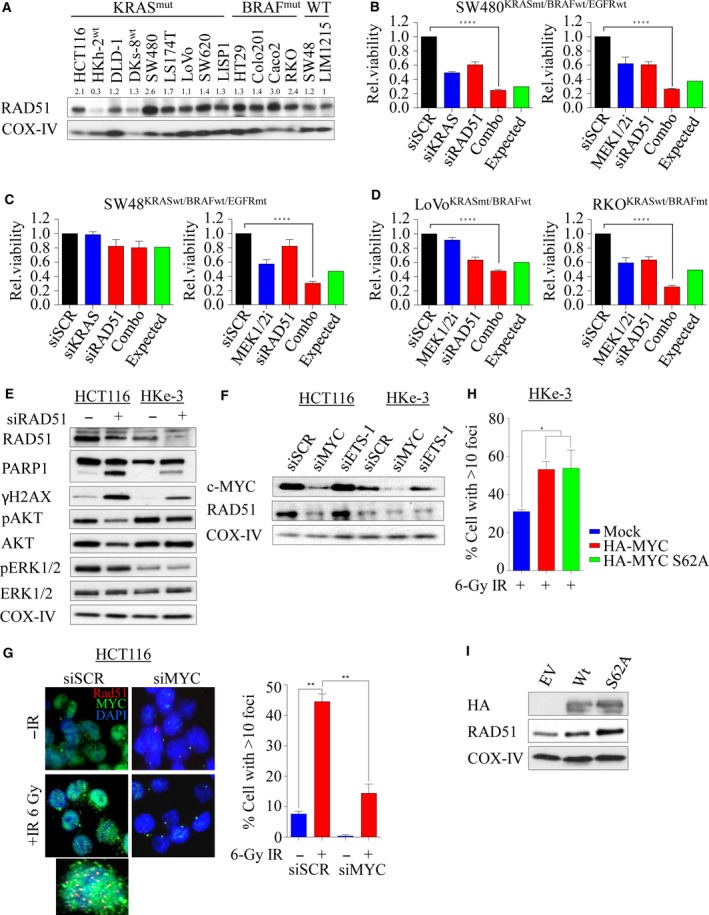
RAD51 loss impacts survival advantage in KRAS‐mutant colorectal cancer. (A) Immunoblot analysis of RAD51 expression in a panel of human colorectal cancer lines including the isogenic lines. COX‐IV expression was used as a loading control. Protein band intensities were measured using imagej software. RAD51 protein expression across the cell lines was calculated relative to KRAS wild‐type LIM1215 cell line. (B–D) A panel of colorectal cancer lines was either reverse‐transfected with 10 nm of siRNA (left) or treated with 0.5 μm AZD6244, a MEK1/2 inhibitor, and cell viability was determined after 96 h. Relative cell viability was determined by comparing with scrambled control‐transfected/DMSO‐treated cells. (E) Isogenic paired lines were reverse‐transfected with 10 nm of pooled siRNA against RAD51, and after 48 h, immunoblot analysis was performed to determine expression of RAD51, cleaved PARP, total and phosphorylated H2AX, AKT, and ERK1/2. COX‐IV expression was used as a loading control. (F) Immunoblot analysis of RAD51 expression following c‐MYC and ETS‐1 silencing in the isogenic lines. COX‐IV expression was used as a loading control. (G) Representative images of RAD51 foci with and without c‐MYC silencing in irradiated (6‐Gy) HCT116 cells, immunostained 6 h later with anti‐RAD51 (red), anti‐c‐MYC (green), and anti‐DAPI (blue). Right: quantification of RAD51 foci cells from experiment in F. The percentage of cells with > 10 RAD51 foci counted. Error bars denote SEM (more than 200 nuclei were scored). (H) Quantification of IR (6‐Gy)‐induced RAD51 foci‐positive cells analyzed 6 h after treatment in HKe‐3 cells transfected with either wild‐type HA‐tagged MYC or phospho‐mutant S62A. Mock‐transfected parental cells were used as a control. The percentage of cells with > 10 RAD51 foci were counted. (I) Immunoblot analysis of RAD51 expression following c‐MYC overexpression in HKe‐3 cells. COX‐IV expression was used as a loading control. Error bars denote SEM (more than 200 nuclei were scored) ****P < 0.0001; ***P < 0.001; **P < 0.01.
3.7. c‐MYC‐mediated RAD51‐dependent HRR is essential in KRAS‐mutant colorectal cancer cells
Upon growth stimulation, Ras triggers a complex array of signal transduction that activates a number of cellular pathways involved in cell proliferation and survival regulated by MAPK and PI3K/AKT networks. Hyperactivation of these pathways through KRAS‐dependent ERK1/2 and/or AKT/mTOR leads to aberrant c‐MYC transcriptional activity during tumorigenesis (Sears et al., 2000). It has been shown through chromatin immunoprecipitation studies that MYC can bind to promoters of a number of DDR genes including RAD51 (Luoto et al., 2010; Mao et al., 2003). c‐MYC is an ERK substrate (Hayes et al., 2016; Wu et al., 2007), and in line with this, RAS mutation in HCT116 cells significantly enhanced basal c‐MYC protein levels (Fig. 5F). In order to mechanistically show the role of RAS signaling in promoting HRR through upregulation of RAD51, we explored the effect of MYC depletion on RAD51 protein expression. Depletion of MYC in both HCT116 and HKe‐3 cells caused a significant reduction in RAD51 protein levels (Fig. 5F). As a comparison, we also depleted ETS‐1, another ETS transcription factor downstream of ERK signaling (Foulds et al., 2004; Ohtani et al., 2001), and found no changes in RAD51 protein levels. When we challenged both control and MYC‐depleted KRAS‐mutant cells with IR, we found significantly fewer RAD51 foci in MYC‐depleted cells compared to sicontrol cells (P < 0.01; Fig. 5G), while c‐MYC depletion had no effect in KRAS WT cells (Fig. S4B). Phosphoserine 62 (pS62) and threonine 58 (pT58) are two essential phospho‐sites that control c‐MYC stability and degradation, respectively (Sears, 2004). The former is phosphorylated by ERK and CDKs, while the latter is phosphorylated by GSK3β which triggers SCF‐Fbw7‐dependent ubiquitination and degradation. To explore the role of c‐MYC activation in promoting RAD51‐dependent DNA repair, we ectopically overexpressed HA‐tagged WT c‐MYC and phospho‐mutant S62A in the KRAS WT cell line HKe‐3. Constitutive induction of WT and stable S62A c‐MYC significantly increased IR‐induced RAD51 foci (Fig. 5H) with a corresponding increase in RAD51 protein levels (Fig. 5I). Collectively, our data show a direct link between constitutive KRAS signaling in regulating HRR through c‐MYC during the DDR.
3.8. Combined CHK1‐PARP1 inhibition synergistically induces cell death in KRAS‐mutant colorectal cancer cells
Because RAD51 has a central role in HRR‐ and KRAS‐mutant cells that are selectively dependent on RAD51 for survival, we depleted RAD51 for 24 h followed by MEK1/2 inhibition (to inhibit MAPK signaling) in HCT116/HKe‐3 cells. We found that coinhibition of RAD51 and MEK1/2 signaling induced DNA damage and apoptosis, evident by accumulation of γ‐H2AX, cleaved PARP‐1, and caspase 3 predominantly in KRAS‐mutant HCT116 cells compared with WT cells (Fig. 6A). To further confirm the RAD51 dependency in KRAS‐mutant cells, we treated both isogenic lines with the RAD51 inhibitor RI‐1 (Budke et al., 2012), and found that KRAS‐mutant cells are more sensitive to RAD51 inhibition with an EC50 of ~ 45 μm, while KRAS WT HKe‐3 cells showed only a limited response at the highest dose tested (Fig. 6B). Next, we treated both the isogenic lines with RI‐1 in combination with the MEK1/2 inhibitor AZD6244 and found that combined inhibition induced DNA damage and PARP‐1 cleavage in the KRAS‐mutant line with minimal effect on the WT line (Fig. S4C).
Figure 6.
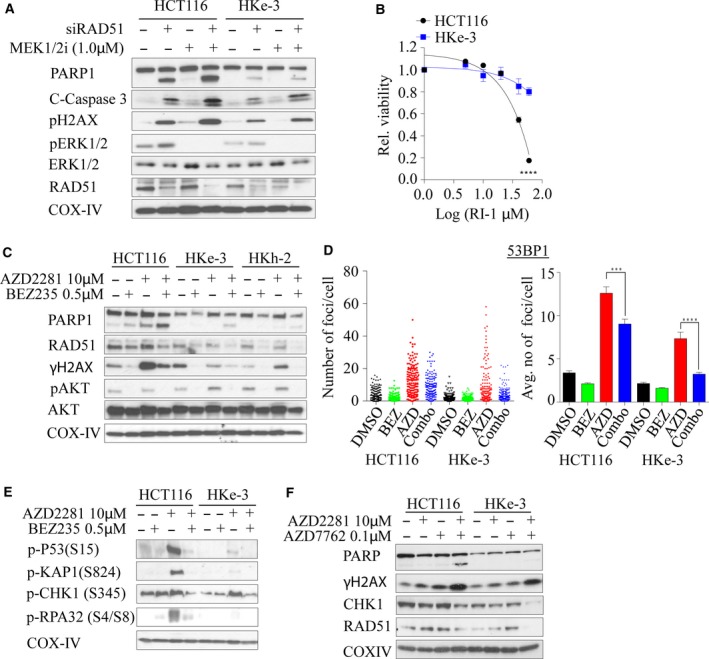
Dual inhibition of RAD51‐MEK1/2, PI3K/Akt/mTOR‐PARP1, or CHK1‐PARP synergistically induces lethality in KRAS‐mutant colorectal cancer cells. (A) Isogenic KRAS‐mutant colorectal cancer lines were reverse‐transfected with 10 nm of siRAD51 for 24 h, followed by 1.0 μm of AZD6244, and immunoblot analysis was performed for an additional 24 h to determine the expression of RAD51, cleaved PARP, γH2AX, total and phosphorylated ERK1/2. (B) Isogenic colorectal cancer cell lines were exposed with different concentrations of RI‐1, a RAD51 inhibitor, and cell viability was determined after 96 h. The dose–response curve was generated by calculating relative cell viability plotted against drug concentration. (C) Isogenic KRAS‐mutant colorectal cancer lines were treated with 10 μm of AZD2281, a PARP inhibitor alone, or in combination with 0.5 μm BEZ235, a PI3K/Akt/mTOR inhibitor, and immunoblot analysis was performed for 48 h to determine the expression of RAD51, cleaved PARP, γH2AX, and phosphorylated AKT. (D) KRAS‐mutant isogenic colorectal cancer lines were treated with BEZ235, AZD2281, or a combination of both inhibitors for 24 h and immunostained for 53BP1 foci. Individual foci number counts (left panels) and average number of foci per cell (right panel) are shown. Error bars denote SEM (n = 2 where more than 50 cells were scored for each experiment). (E) Isogenic KRAS‐mutant colorectal cancer lines were treated with 10 μm of AZD2281 alone or in combination with 0.5 μm BEZ235, and immunoblot analysis was performed for 48 h to determine phosphorylation of p53 (S15), KAP1 (S824), CHK1 (S345), and RPA32 (S4/S8). (F) Isogenic KRAS‐mutant colorectal cancer lines were treated with 10 μm of PARP1 inhibitor alone or in combination with 0.1 μm AZD7762, a CHK1 inhibitor, and immunoblot analysis was performed for 48 h to determine the expression of RAD51, cleaved PARP, γH2AX, and CHK1. COX‐IV expression was used as a loading control.
Because of the lack of clinically potent selective RAD51 inhibitors, as well as in order to further suppress the DSB repair in these cells, we first used NVP‐BEZ235, a dual PI3K/Akt/mTOR inhibitor and also a potent ATM and DNA‐PK inhibitor, which can inhibit both the HRR and NHEJ pathways and is currently in phase I/II clinical trials for advanced solid tumors (Mukherjee et al., 2012). Moreover, the PI3K/AKT/mTOR pathway is one of the major signaling pathways that Ras regulates besides MAPK signaling, and our network analysis interconnected RAD51 through AKT signaling (Fig. 1B) (Chang et al., 2014; Gil del Alcazar et al., 2014; Mukherjee et al., 2012). We expected that inhibition of HR and NHEJ through NVP‐BEZ235 would force cells to be more reliant on PARP1‐dependent alternative NHEJ (alt‐NHEJ), and thus, combined inhibition with PARP1 should synergistically kill mutant cells rather than WT cells. To demonstrate this, we cotreated HCT116 isogenic lines with BEZ235 and olaparib (AZD2281), a PARP inhibitor, and found that mutant cells displayed enhanced PARP‐1 cleavage in combination treatment compared to single drug treatments and combination treatment of either WT line (Fig. 6C). This was associated with a BEZ235‐induced reduction in RAD51 expression (Fig. 6C). Moreover, we found that γ‐H2AX was enhanced following olaparib treatment in mutant cells and this was reduced following dual inhibition, due to BEZ235‐mediated inhibition of DNA‐PK, and ATM reported by us previously (Mukherjee et al., 2012) (Fig. 6C). In line with this, we found that foci formation of both 53BP1 and γ‐H2AX after 24 h was significantly reduced following dual inhibition (Figs 6D and S4D). Moreover, through immunoblotting, we found robust post‐translational modifications of repair proteins such as phosphorylation of S15‐p53, S824‐KAP1, S345‐CHK1, and S4/S8‐RPA in KRAS‐mutant compared to WT cells following olaparib treatment and this was subsequently dampened following the addition of BEZ235 (Fig. 6E). This suggests that in the presence of olaparib, mutant cells rapidly accumulate DNA damage and addition of BEZ235 simply suppresses DNA damage signaling and the accumulation of DNA damage repair proteins at the break sites (although more breaks would have been generated following combined olaparib and BEZ235 treatment), and hence the dampened repair kinetics. Because our strategy targeted DDR signaling as a whole, we wondered whether inhibition of CHK1 kinase that is required for HRR (Sorensen et al., 2005) and replication stress response might selectively kill KRAS‐mutant lines in combination with PARP inhibition. Treatment of both isogenic lines with a CHK1 inhibitor AZD7762 and PARP inhibition resulted in enhanced PARP‐1 cleavage compared to WT treated lines, similar to our observation with the BEZ235‐PARPi combination treatment (Fig. 6F). Collectively, our data support these novel combination treatment options to exploit enhanced lethal vulnerability in cells harboring otherwise nondruggable KRAS mutations.
4. Discussion
Despite recent advances in personalized medicine and a better understanding of human cancers, targeting oncogenic drivers such as KRAS still remains a challenging issue in the cancer therapeutic armamentarium. Using cross‐species validation from the largest yeast genetic interactome (Costanzo et al., 2010), we provide evidence of the novel role of KRAS signaling biology in upregulating HRR and as a potential therapeutic strategy in killing KRAS‐mutant colorectal cancer cells.
Similar to mammalian Ras signaling, S. cerevisiae contains two Ras genes, Ras1 and Ras2, which share homology to the N termini of human Ras proteins. Double mutants of Ras1 ‐; Ras2 ‐ are nonviable, thus showing essentiality in yeast vegetative growth (Kataoka et al., 1984). Convergent evolution between yeast and human Ras proteins facilitated our identification of human RAS synthetic lethal pairs by mining yeast data. Pathway analysis of these genes identified that DSB repair by HRR was specifically deregulated by mutant Ras signaling. This was associated with strong genetic interactions with MRE11A (Krejci et al., 2012) and intermediate interactions with RAD51 (Krejci et al., 2012), RAD18 (Huang et al., 2009), and FEN1 (Kikuchi et al., 2005), all components of HRR‐mediated repair which occurs predominantly in the S and G2 phases of cell cycle.
We found that silencing of FEN1 and PHB2 is lethal in both KRAS WT and KRAS‐mutant cells, although there was a slight difference in cell viability between the two lines. This is not surprising given the role of FEN1 in cleaving 5′‐flaps of branched DNA structures (Harrington and Lieber, 1994). Previous reports have shown that the PHB2/RAF interaction is required for MAPK activation (Chowdhury et al., 2014); however, we found that WT KRAS cells do require PHB for cell survival, further suggesting that PHB2 is unlikely to be regulated by mutant KRAS. In contrast, we found that silencing of PARL, a presenilin‐associated rhomboid‐like gene, selectively reduced cell viability in KRAS‐mutant cells. PARL has been shown to function as an antiapoptotic regulator mainly through OPA1‐dependent mitochondria cristae remodeling. In line with this, recent data reinforce a strong interrelationship between mutant KRAS signaling and mitochondrial dysfunction (Hu et al., 2012).
The most lethal interaction of Ras was observed with RAD51 depletion alone or in combination with KRAS. RAD51 is required for strand invasion during HRR‐mediated DSB repair. RAD51 overexpression has been linked to poor overall survival in colorectal cancer (Tennstedt et al., 2013) and identified as one of the most predictive factors in preoperative chemoradiation therapy for advanced rectal cancer (Iwata et al., 2012). Consistent with this, we observed that deletion of the mutant KRAS allele led to decreased RAD51 expression in isogenic lines, suggesting a specific role of KRAS mutations in inducing RAD51 expression. Consistent with this notion, it has been well established that oncogenes such as KRAS induce DNA replication stress and consequently activate the DDR early in tumorigenesis as a barrier to proliferation and survival (Hills and Diffley, 2014). In support of this, we found that KRAS‐mutant cells have more stalled replication forks than WT cells and the fork rate was significantly reduced in the mutant line. Oncogenes such as HRASV12 have been shown to regulate global transcription factors to stimulate RNA synthesis and cause subsequent R‐loop formation. Interference between transcription and replication machinery can lead to replication fork slowing, increased DNA damage, and genomic instability (Bartkova et al., 2006; Kotsantis et al., 2016). Cells tend to overcome these barriers by augmenting components of checkpoint and repair machineries in order to survive.
Ras signaling plays major roles in modulating cell cycle progression, yet the link between mutant KRAS and DSB repair is not well established. However, the upstream receptor tyrosine kinase EGFR pathway has been well studied in the context of the DDR (Chen and Nirodi, 2007). Upon DSB induction, EGFR translocates to the nucleus and promotes repair predominantly via NHEJ and HRR (Chen and Nirodi, 2007; Kriegs et al., 2010; Mukherjee et al., 2010). During NHEJ repair, EGFR has been shown to interact with the catalytic subunit of DNA‐PK, an essential component of NHEJ (Golding et al., 2009) while for HRR, EGFR activity is required for BRCA1 localization and subsequent RAD51 recruitment to sites of DNA damage (Li et al., 2008). Consistent with this, we found that EGFR‐mutant SW48 cells showed enhanced lethality when treated with MEK1/2 inhibition in combination with RAD51 depletion. Approximately 5–10% of patients with colorectal cancer harbor BRAF mutations, which has been associated with poor clinical outcomes (Tran et al., 2011). We found that silencing of RAD51 also inhibited survival of BRAF‐mutant cells in addition to the KRAS‐mutant cells, suggesting that HRR‐mediated repair is a major potentially druggable driver of oncogene‐addicted tumors.
In order to further illustrate the impact of RAD51‐mediated DSB repair on the survival of KRAS‐mutant cells, we depleted RAD51 in these cells and demonstrated that depletion of RAD51 significantly modulates survival signaling and apoptosis in KRAS‐mutant cells. Surprisingly, we also found that AKT signaling was impacted following RAD51 depletion. Recently, several studies have shown the involvement of AKT signaling in modulating DDR (Xu et al., 2012) (Fraser et al., 2011). AKT has been shown to promote NHEJ‐mediated repair by accumulating at the vicinity of IR‐induced DSBs and colocalizing with γH2AX and ATM‐pSer1981 (Fraser et al., 2011). On the other hand, overexpression of AKT subsequently suppresses ATR/CHK1 signaling and HRR‐mediated repair by indirectly inhibiting resection factors such as RPA, BRCA1, and RAD51 (Xu et al., 2012). This can further explain the selectivity of repair kinetics between the KRAS WT and KRAS‐mutant cells where the WT cells have higher activity of AKT signaling which may suppress HRR. Moreover, we found that silencing of RAD51 impacts MAPK signaling in a KRAS‐mutant‐dependent manner, and further support the hypothesis that RAD51 regulates KRAS‐mutant cells by modulating cell signaling cascades. Mechanistically, we showed that MYC, a transcriptional factor involved in many cancers (Dang, 2012) and a well‐known substrate of MAPK/ERK (Hayes et al., 2016; Wu et al., 2007), facilitates IR‐induced DSB repair through regulation of HRR in KRAS‐mutant cells. In line with our findings, Chen et al. (2011) reported c‐MYC‐mediated BRCA1 promoter activation, an essential component of HRR in breast cancer, which influenced I‐SceI‐induced HRR. Moreover, mapping of c‐MYC binding to various promoters of DDR genes including RAD51 highlights the regulatory role of c‐MYC in regulating DDR in which the authors showed suppression of HRR following MYC depletion (Luoto et al., 2010).
While inhibition of constitutive ERK1/2 signaling has limited effect in KRAS‐mutant colorectal cancer patients due to compensatory pathway activation, we found that combined inhibition of RAD51 and MEK1/2 significantly increases apoptosis by inducing DSBs. Pharmacological inhibition of RAD51 selectively killed KRAS‐mutant cells, suggesting they are strongly dependent on HRR. Consistent with this, MEK1/2 inhibition in KRAS‐mutant small‐cell lung cancer cells has been correlated with enhanced radiation‐induced DNA damage compared to WT cells (Lin et al., 2014), suggesting a novel combination strategy of targeting Ras signaling with RAD51 and MEK1/2 inhibition. Alternatively, we also found that dampening of the DDR with BEZ235 (also inhibits both canonical NHEJ and HRR) (Chang et al., 2014; Mukherjee et al., 2012), in combination with PARP1 inhibition, is synergistic in inducing apoptosis in KRAS‐mutant cells, likely due to increased reliance of these cells on alternative repair pathways such as alt‐NHEJ in which PARP1 is one of the critical proteins. Consistent with this, a report suggested that KRAS‐mutant leukemic cells rely on alt‐NHEJ upon genotoxic stress and targeting this pathway significantly enhanced chemotherapy‐induced toxicity (Hahnel et al., 2014). Moreover, we also show that treatment of KRAS‐mutant cells with a CHK1 kinase inhibitor (which inhibits HRR) sensitizes these cells to PARP inhibition. Consistent with this, it has recently been reported that targeting the global stress kinase pathway p38/MK2 in combination with CHK1 significantly enhanced toxicity in a KRAS‐mutant‐dependent manner (Dietlein et al., 2015). In addition, a recent study has suggested that mutant KRAS requires WT HRAS and NRAS for activation of CHK1 (Grabocka et al., 2014). Thus, knockdown of either WT H/NRAS or CHK1 inhibition can sensitize KRAS‐mutant cells to DNA‐damaging agents.
One limitation of our study was that the majority of the work was conducted in a single isogenic paired cell line model, HCT116 and its derivatives, which is dependent upon KRAS mutation for survival. It would therefore be worthwhile to validate our observation that KRAS‐mutant‐dependent tumors are reliant upon DDR using large‐scale datasets such as TCGA and tissue microarray in future studies. However, determining the actual tumor dependency on mutant KRAS for survival from such genetic data is difficult and in vivo validation is required by taking into account for KRAS dependency. We could, in principle, generate a KRAS‐mutant‐dependent associated DDR signature that could be used to determine tumors that are vulnerable to DDR‐targeting agents. In addition, it is also important to note that intertumoral heterogeneity may exist with regard to DDR alterations both within a given tumor subtype and between tumor types. This heterogeneity should be carefully considered when designing therapies targeting a particular genetic background.
5. Conclusions
We report the importance of upregulated HRR in promoting the survival of KRAS‐mutant colorectal cancer cells. By studying synthetic lethal interactions, we are able to underpin the significance of altered oncogene‐induced DSB repair activity in KRAS mutants. By testing a range of potential therapeutic combinations, we demonstrate that analysis of compensatory pathway activation can facilitate design of synthetic lethal chemotherapeutic combinations to address KRAS‐mutant cancer.
Author contributions
MK, SB, and KKK conceived and designed the experiments. MK, ALB, BM, PN, DMN, SKH, JLH, GNS, and DS performed the experiments. MK, ALB, PN, BM, and SB analyzed the data. SS and SS contributed reagents/materials/analysis tools. All authors wrote and revised the manuscript. All authors read and approved the final manuscript.
Supporting information
Fig. S1. Homology sequence analysis between human and yeast Ras.
Fig. S2. (A) Growth kinetic of HCT116 isogenic pair lines determined using the IncuCyte ZOOM® live cell imager (phase‐only processing module). The percentage of cell confluence was determined using an IncuCyte mask analyzer. (B) HCT116 Isogenic pair lines were reverse transfected with 10 nm of the pool siRNA as indicated and mRNA levels were determined relative to scramble control siRNA transfected cells. Error bars represent the standard deviation of the mean from triplicates. (C) Colorectal cancer lines were reverse transfected with 10 nm of the pool siRNA of RAD51 and immunoblot was performed to determine RAD51 protein levels. (D) HCT116 Isogenic pair lines were reverse transfected with 10 nm of the pool siRNA of RAD51 for 96 h and cell viability and death were determined using MultiTox Glo multiplex cytotoxicity assay. Scr: scrambled siRNA was used as control and relative cell viability was determined to the scr control transfected cells. *P < 0.05; **P < 0.01; ns: not significant. Error bars represent the standard error of the mean (SEM) from three independent experiments. (E) Representative images of replication fork DNA fibers in both wild‐type and mutant KRAS lines.
Fig. S3. (A) Representative cytogram images of cell cycle distribution analyzed at 6 h after exposure to IR (6 Gy) in the isogenic lines using ModFit LT 4.0 software. (B) Percentage of cell cycle distribution analyzed at 24 h following 1 Gy of IR treatment in the isogenic lines using ModFit LT 4.0 software. n = 2 ± SEM. (C) Representative images of the isogenic colorectal cancer lines coimmunostained with anti‐53BP1 (green), Cyclin A (red) and DAPI (blue) following 1 Gy ionizing radiation processed after 0.5 or 24 h.
Fig. S4. (A) DKs‐8 cells were reverse transfected with either 10 nm of siRNA (left) or treated with 0.25 μm AZD6244, a MEK1/2 inhibitor and cell viability was determined after 96 h. Relative cell viability was determined by comparing with scrambled control transfected/DMSO treated cells. (B) Quantification of IR (6 Gy)‐induced RAD51 foci‐positive cells analyzed at 6 h after treatment in c‐MYC‐depleted HKe‐3 cells. siSCR transfected parental cells were used as a control. The percentage of cells with > 10 RAD51 foci were counted. n = 2 ± SEM. (C) Isogenic KRAS‐mutant colorectal cancer lines were treated with 1.0 μm of MEK1/2i (AZD6244) alone or in combination with 25 μm RI‐1 and immunoblot analysis was performed after 48 h to determine the expression of cleaved PARP, RAD51, γH2AX and phosphorylated ERK1/2. COX‐IV expression was used as a loading control. (D) KRAS‐mutant isogenic colorectal cancer lines were treated with BEZ235, AZD2281 or a combination of both inhibitors for 24 h and immunostained for γH2AX foci.
Table S1. Primer sequences used in this study.
Table S2. siRNA sequences used in this study.
Acknowledgements
We wish to thank Professor Wuhan Xiao for the HA‐MYC constructs and Stephen Miles as well as Dr. Wei Shi for technical assistance in this project. This work was supported by Cancer Council Queensland (CCQ) Project Grant to MK [ID 1087363] and National Health & Medical Research Council (NH&MRC) Program Grant to KKK [ID 1017028]. KKK is a NHMRC Senior Principal Research Fellow (ID 613638). SB is supported by grants from the National Institutes of Health [RO1CA149461, RO1CA197796, and R21CA202403] and the National Aeronautics and Space Administration [NNX16AD78G].
Contributor Information
Murugan Kalimutho, Email: Murugan.Kalimutho@qimrberghofer.edu.au.
Kum Kum Khanna, Email: KumKum.Khanna@qimrberghofer.edu.au.
References
- Al‐Ejeh F, Simpson PT, Sanus JM, Klein K, Kalimutho M, Shi W, Miranda M, Kutasovic J, Raghavendra A, Madore J et al (2014) Meta‐analysis of the global gene expression profile of triple‐negative breast cancer identifies genes for the prognostication and treatment of aggressive breast cancer. Oncogenesis 3, e100. [DOI] [PMC free article] [PubMed] [Google Scholar]
- Barbie DA, Tamayo P, Boehm JS, Kim SY, Moody SE, Dunn IF, Schinzel AC, Sandy P, Meylan E, Scholl C et al (2009) Systematic RNA interference reveals that oncogenic KRAS‐driven cancers require TBK1. Nature 462, 108–112. [DOI] [PMC free article] [PubMed] [Google Scholar]
- Bartkova J, Rezaei N, Liontos M, Karakaidos P, Kletsas D, Issaeva N, Vassiliou LV, Kolettas E, Niforou K, Zoumpourlis VC et al (2006) Oncogene‐induced senescence is part of the tumorigenesis barrier imposed by DNA damage checkpoints. Nature 444, 633–637. [DOI] [PubMed] [Google Scholar]
- Baumann P and West SC (1998) Role of the human RAD51 protein in homologous recombination and double‐stranded‐break repair. Trends Biochem Sci 23, 247–251. [DOI] [PubMed] [Google Scholar]
- Bos JL, Rehmann H and Wittinghofer A (2007) GEFs and GAPs: critical elements in the control of small G proteins. Cell 129, 865–877. [DOI] [PubMed] [Google Scholar]
- Budke B, Logan HL, Kalin JH, Zelivianskaia AS, Cameron McGuire W, Miller LL, Stark JM, Kozikowski AP, Bishop DK and Connell PP (2012) RI‐1: a chemical inhibitor of RAD51 that disrupts homologous recombination in human cells. Nucleic Acids Res 40, 7347–7357. [DOI] [PMC free article] [PubMed] [Google Scholar]
- Chang L, Graham PH, Hao J, Ni J, Bucci J, Cozzi PJ, Kearsley JH and Li Y (2014) PI3K/Akt/mTOR pathway inhibitors enhance radiosensitivity in radioresistant prostate cancer cells through inducing apoptosis, reducing autophagy, suppressing NHEJ and HR repair pathways. Cell Death Dis 5, e1437. [DOI] [PMC free article] [PubMed] [Google Scholar]
- Chen DJ and Nirodi CS (2007) The epidermal growth factor receptor: a role in repair of radiation‐induced DNA damage. Clin Cancer Res 13, 6555–6560. [DOI] [PubMed] [Google Scholar]
- Chen Y, Xu J, Borowicz S, Collins C, Huo D and Olopade OI (2011) c‐Myc activates BRCA1 gene expression through distal promoter elements in breast cancer cells. BMC Cancer 11, 246. [DOI] [PMC free article] [PubMed] [Google Scholar]
- Cherfils J and Zeghouf M (2013) Regulation of small GTPases by GEFs, GAPs, and GDIs. Physiol Rev 93, 269–309. [DOI] [PubMed] [Google Scholar]
- Chowdhury I, Thompson WE and Thomas K (2014) Prohibitins role in cellular survival through Ras‐Raf‐MEK‐ERK pathway. J Cell Physiol 229, 998–1004. [DOI] [PMC free article] [PubMed] [Google Scholar]
- Cipolat S, Rudka T, Hartmann D, Costa V, Serneels L, Craessaerts K, Metzger K, Frezza C, Annaert W, D'Adamio L et al (2006) Mitochondrial rhomboid PARL regulates cytochrome c release during apoptosis via OPA1‐dependent cristae remodeling. Cell 126, 163–175. [DOI] [PubMed] [Google Scholar]
- Corcoran RB, Cheng KA, Hata AN, Faber AC, Ebi H, Coffee EM, Greninger P, Brown RD, Godfrey JT, Cohoon TJ et al (2013) Synthetic lethal interaction of combined BCL‐XL and MEK inhibition promotes tumor regressions in KRAS mutant cancer models. Cancer Cell 23, 121–128. [DOI] [PMC free article] [PubMed] [Google Scholar]
- Costanzo M, Baryshnikova A, Bellay J, Kim Y, Spear ED, Sevier CS, Ding H, Koh JL, Toufighi K, Mostafavi S et al (2010) The genetic landscape of a cell. Science 327, 425–431. [DOI] [PMC free article] [PubMed] [Google Scholar]
- Dang CV (2012) MYC on the path to cancer. Cell 149, 22–35. [DOI] [PMC free article] [PubMed] [Google Scholar]
- Davies BR, Logie A, McKay JS, Martin P, Steele S, Jenkins R, Cockerill M, Cartlidge S and Smith PD (2007) AZD6244 (ARRY‐142886), a potent inhibitor of mitogen‐activated protein kinase/extracellular signal‐regulated kinase kinase 1/2 kinases: mechanism of action in vivo, pharmacokinetic/pharmacodynamic relationship, and potential for combination in preclinical models. Mol Cancer Ther 6, 2209–2219. [DOI] [PubMed] [Google Scholar]
- De Roock W, De Vriendt V, Normanno N, Ciardiello F and Tejpar S (2011) KRAS, BRAF, PIK3CA, and PTEN mutations: implications for targeted therapies in metastatic colorectal cancer. Lancet Oncol 12, 594–603. [DOI] [PubMed] [Google Scholar]
- DeFeo‐Jones D, Tatchell K, Robinson LC, Sigal IS, Vass WC, Lowy DR and Scolnick EM (1985) Mammalian and yeast ras gene products: biological function in their heterologous systems. Science 228, 179–184. [DOI] [PubMed] [Google Scholar]
- Deshpande R, Asiedu MK, Klebig M, Sutor S, Kuzmin E, Nelson J, Piotrowski J, Shin SH, Yoshida M, Costanzo M et al (2013) A comparative genomic approach for identifying synthetic lethal interactions in human cancer. Cancer Res 73, 6128–6136. [DOI] [PMC free article] [PubMed] [Google Scholar]
- Dietlein F, Kalb B, Jokic M, Noll EM, Strong A, Tharun L, Ozretic L, Kunstlinger H, Kambartel K, Randerath WJ et al (2015) A synergistic interaction between Chk1‐ and MK2 inhibitors in KRAS‐mutant cancer. Cell 162, 146–159. [DOI] [PubMed] [Google Scholar]
- Dong C, Lin Z, Diao W, Li D, Chu X, Wang Z, Zhou H, Xie Z, Shen Y and Long J (2015) The Elp2 subunit is essential for elongator complex assembly and functional regulation. Structure 23, 1078–1086. [DOI] [PubMed] [Google Scholar]
- Foulds CE, Nelson ML, Blaszczak AG and Graves BJ (2004) Ras/mitogen‐activated protein kinase signaling activates Ets‐1 and Ets‐2 by CBP/p300 recruitment. Mol Cell Biol 24, 10954–10964. [DOI] [PMC free article] [PubMed] [Google Scholar]
- Fraser M, Harding SM, Zhao H, Coackley C, Durocher D and Bristow RG (2011) MRE11 promotes AKT phosphorylation in direct response to DNA double‐strand breaks. Cell Cycle 10, 2218–2232. [DOI] [PubMed] [Google Scholar]
- Gil del Alcazar CR, Hardebeck MC, Mukherjee B, Tomimatsu N, Gao X, Yan J, Xie XJ, Bachoo R, Li L, Habib AA et al (2014) Inhibition of DNA double‐strand break repair by the dual PI3K/mTOR inhibitor NVP‐BEZ235 as a strategy for radiosensitization of glioblastoma. Clin Cancer Res 20, 1235–1248. [DOI] [PMC free article] [PubMed] [Google Scholar]
- Gimeno CJ, Ljungdahl PO, Styles CA and Fink GR (1992) Unipolar cell divisions in the yeast S. cerevisiae lead to filamentous growth: regulation by starvation and RAS. Cell 68, 1077–1090. [DOI] [PubMed] [Google Scholar]
- Golding SE, Morgan RN, Adams BR, Hawkins AJ, Povirk LF and Valerie K (2009) Pro‐survival AKT and ERK signaling from EGFR and mutant EGFRvIII enhances DNA double‐strand break repair in human glioma cells. Cancer Biol Ther 8, 730–738. [DOI] [PMC free article] [PubMed] [Google Scholar]
- Grabocka E, Pylayeva‐Gupta Y, Jones MJ, Lubkov V, Yemanaberhan E, Taylor L, Jeng HH and Bar‐Sagi D (2014) Wild‐type H‐ and N‐Ras promote mutant K‐Ras‐driven tumorigenesis by modulating the DNA damage response. Cancer Cell 25, 243–256. [DOI] [PMC free article] [PubMed] [Google Scholar]
- Hahnel PS, Enders B, Sasca D, Roos WP, Kaina B, Bullinger L, Theobald M and Kindler T (2014) Targeting components of the alternative NHEJ pathway sensitizes KRAS mutant leukemic cells to chemotherapy. Blood 123, 2355–2366. [DOI] [PubMed] [Google Scholar]
- Hao H, Muniz‐Medina VM, Mehta H, Thomas NE, Khazak V, Der CJ and Shields JM (2007) Context‐dependent roles of mutant B‐Raf signaling in melanoma and colorectal carcinoma cell growth. Mol Cancer Ther 6, 2220–2229. [DOI] [PubMed] [Google Scholar]
- Harrington JJ and Lieber MR (1994) The characterization of a mammalian DNA structure‐specific endonuclease. EMBO J 13, 1235–1246. [DOI] [PMC free article] [PubMed] [Google Scholar]
- Hayes TK, Neel NF, Hu C, Gautam P, Chenard M, Long B, Aziz M, Kassner M, Bryant KL, Pierobon M et al (2016) Long‐term ERK inhibition in KRAS‐mutant pancreatic cancer is associated with MYC degradation and senescence‐like growth suppression. Cancer Cell 29, 75–89. [DOI] [PMC free article] [PubMed] [Google Scholar]
- Henry‐Mowatt J, Jackson D, Masson JY, Johnson PA, Clements PM, Benson FE, Thompson LH, Takeda S, West SC and Caldecott KW (2003) XRCC3 and Rad51 modulate replication fork progression on damaged vertebrate chromosomes. Mol Cell 11, 1109–1117. [DOI] [PubMed] [Google Scholar]
- Hills SA and Diffley JF (2014) DNA replication and oncogene‐induced replicative stress. Curr Biol 24, R435–R444. [DOI] [PubMed] [Google Scholar]
- Hong NA, Flannery M, Hsieh SN, Cado D, Pedersen R and Winoto A (2000) Mice lacking Dad1, the defender against apoptotic death‐1, express abnormal N‐linked glycoproteins and undergo increased embryonic apoptosis. Dev Biol 220, 76–84. [DOI] [PubMed] [Google Scholar]
- Hu Y, Lu W, Chen G, Wang P, Chen Z, Zhou Y, Ogasawara M, Trachootham D, Feng L, Pelicano H et al (2012) K‐ras(G12V) transformation leads to mitochondrial dysfunction and a metabolic switch from oxidative phosphorylation to glycolysis. Cell Res 22, 399–412. [DOI] [PMC free article] [PubMed] [Google Scholar]
- Huang J, Huen MS, Kim H, Leung CC, Glover JN, Yu X and Chen J (2009) RAD18 transmits DNA damage signalling to elicit homologous recombination repair. Nat Cell Biol 11, 592–603. [DOI] [PMC free article] [PubMed] [Google Scholar]
- Iwata T, Shimada M, Kurita N, Nishioka M, Morimoto S, Yoshikawa K, Higashijima J, Nakao T and Komatsu M (2012) Evaluation of relation of RAD51 and the effect of chemo‐radiation therapy for advanced rectal cancer. Hepatogastroenterology 59, 990–993. [DOI] [PubMed] [Google Scholar]
- Kataoka T, Powers S, McGill C, Fasano O, Strathern J, Broach J and Wigler M (1984) Genetic analysis of yeast RAS1 and RAS2 genes. Cell 37, 437–445. [DOI] [PubMed] [Google Scholar]
- Kikuchi K, Taniguchi Y, Hatanaka A, Sonoda E, Hochegger H, Adachi N, Matsuzaki Y, Koyama H, van Gent DC, Jasin M et al (2005) Fen‐1 facilitates homologous recombination by removing divergent sequences at DNA break ends. Mol Cell Biol 25, 6948–6955. [DOI] [PMC free article] [PubMed] [Google Scholar]
- Knickelbein K and Zhang L (2015) Mutant KRAS as a critical determinant of the therapeutic response of colorectal cancer. Genes Dis 2, 4–12. [DOI] [PMC free article] [PubMed] [Google Scholar]
- Kotsantis P, Silva LM, Irmscher S, Jones RM, Folkes L, Gromak N and Petermann E (2016) Increased global transcription activity as a mechanism of replication stress in cancer. Nat Commun 7, 13087. [DOI] [PMC free article] [PubMed] [Google Scholar]
- Krejci L, Altmannova V, Spirek M and Zhao X (2012) Homologous recombination and its regulation. Nucleic Acids Res 40, 5795–5818. [DOI] [PMC free article] [PubMed] [Google Scholar]
- Kriegs M, Kasten‐Pisula U, Rieckmann T, Holst K, Saker J, Dahm‐Daphi J and Dikomey E (2010) The epidermal growth factor receptor modulates DNA double‐strand break repair by regulating non‐homologous end‐joining. DNA Repair 9, 889–897. [DOI] [PubMed] [Google Scholar]
- Kumar MS, Hancock DC, Molina‐Arcas M, Steckel M, East P, Diefenbacher M, Armenteros‐Monterroso E, Lassailly F, Matthews N, Nye E et al (2012) The GATA2 transcriptional network is requisite for RAS oncogene‐driven non‐small cell lung cancer. Cell 149, 642–655. [DOI] [PubMed] [Google Scholar]
- Li L, Wang H, Yang ES, Arteaga CL and Xia F (2008) Erlotinib attenuates homologous recombinational repair of chromosomal breaks in human breast cancer cells. Cancer Res 68, 9141–9146. [DOI] [PMC free article] [PubMed] [Google Scholar]
- Lin SH, Zhang J, Giri U, Stephan C, Sobieski M, Zhong L, Mason KA, Molkentine J, Thames HD, Yoo SS et al (2014) A high content clonogenic survival drug screen identifies mek inhibitors as potent radiation sensitizers for KRAS mutant non‐small‐cell lung cancer. J Thorac Oncol 9, 965–973. [DOI] [PMC free article] [PubMed] [Google Scholar]
- Luo J, Emanuele MJ, Li D, Creighton CJ, Schlabach MR, Westbrook TF, Wong KK and Elledge SJ (2009) A genome‐wide RNAi screen identifies multiple synthetic lethal interactions with the Ras oncogene. Cell 137, 835–848. [DOI] [PMC free article] [PubMed] [Google Scholar]
- Luoto KR, Meng AX, Wasylishen AR, Zhao H, Coackley CL, Penn LZ and Bristow RG (2010) Tumor cell kill by c‐MYC depletion: role of MYC‐regulated genes that control DNA double‐strand break repair. Cancer Res 70, 8748–8759. [DOI] [PubMed] [Google Scholar]
- Mao DY, Watson JD, Yan PS, Barsyte‐Lovejoy D, Khosravi F, Wong WW, Farnham PJ, Huang TH and Penn LZ (2003) Analysis of Myc bound loci identified by CpG island arrays shows that Max is essential for Myc‐dependent repression. Curr Biol 13, 882–886. [DOI] [PubMed] [Google Scholar]
- McCormick F (1993a) The GTPase superfamily. Introduction. Ciba Foundation symposium 176, 1–5. [PubMed] [Google Scholar]
- McCormick F (1993b) Signal transduction. How receptors turn Ras on. Nature 363, 15–16. [DOI] [PubMed] [Google Scholar]
- McCubrey JA, Steelman LS, Chappell WH, Abrams SL, Montalto G, Cervello M, Nicoletti F, Fagone P, Malaponte G, Mazzarino MC et al (2012) Mutations and deregulation of Ras/Raf/MEK/ERK and PI3K/PTEN/Akt/mTOR cascades which alter therapy response. Oncotarget 3, 954–987. [DOI] [PMC free article] [PubMed] [Google Scholar]
- Misale S, Di Nicolantonio F, Sartore‐Bianchi A, Siena S and Bardelli A (2014) Resistance to anti‐EGFR therapy in colorectal cancer: from heterogeneity to convergent evolution. Cancer Discov 4, 1269–1280. [DOI] [PubMed] [Google Scholar]
- Mishra S, Murphy LC, Nyomba BL and Murphy LJ (2005) Prohibitin: a potential target for new therapeutics. Trends Mol Med 11, 192–197. [DOI] [PubMed] [Google Scholar]
- Mukherjee B, Choy H, Nirodi C and Burma S (2010) Targeting nonhomologous end‐joining through epidermal growth factor receptor inhibition: rationale and strategies for radiosensitization. Semin Radiat Oncol 20, 250–257. [DOI] [PMC free article] [PubMed] [Google Scholar]
- Mukherjee B, McEllin B, Camacho CV, Tomimatsu N, Sirasanagandala S, Nannepaga S, Hatanpaa KJ, Mickey B, Madden C, Maher E et al (2009) EGFRvIII and DNA double‐strand break repair: a molecular mechanism for radioresistance in glioblastoma. Cancer Res 69, 4252–4259. [DOI] [PMC free article] [PubMed] [Google Scholar]
- Mukherjee B, Tomimatsu N, Amancherla K, Camacho CV, Pichamoorthy N and Burma S (2012) The dual PI3K/mTOR inhibitor NVP‐BEZ235 is a potent inhibitor of ATM‐ and DNA‐PKCs‐mediated DNA damage responses. Neoplasia 14, 34–43. [DOI] [PMC free article] [PubMed] [Google Scholar]
- Ohtani N, Zebedee Z, Huot TJ, Stinson JA, Sugimoto M, Ohashi Y, Sharrocks AD, Peters G and Hara E (2001) Opposing effects of Ets and Id proteins on p16INK4a expression during cellular senescence. Nature 409, 1067–1070. [DOI] [PubMed] [Google Scholar]
- Ooi SL, Pan X, Peyser BD, Ye P, Meluh PB, Yuan DS, Irizarry RA, Bader JS, Spencer FA and Boeke JD (2006) Global synthetic‐lethality analysis and yeast functional profiling. Trends Genet 22, 56–63. [DOI] [PubMed] [Google Scholar]
- Pierce AJ, Johnson RD, Thompson LH and Jasin M (1999) XRCC3 promotes homology‐directed repair of DNA damage in mammalian cells. Genes Dev 13, 2633–2638. [DOI] [PMC free article] [PubMed] [Google Scholar]
- Puyol M, Martin A, Dubus P, Mulero F, Pizcueta P, Khan G, Guerra C, Santamaria D and Barbacid M (2010) A synthetic lethal interaction between K‐Ras oncogenes and Cdk4 unveils a therapeutic strategy for non‐small cell lung carcinoma. Cancer Cell 18, 63–73. [DOI] [PubMed] [Google Scholar]
- Rajalingam K and Rudel T (2005) Ras‐Raf signaling needs prohibitin. Cell Cycle 4, 1503–1505. [DOI] [PubMed] [Google Scholar]
- Rajalingam K, Wunder C, Brinkmann V, Churin Y, Hekman M, Sievers C, Rapp UR and Rudel T (2005) Prohibitin is required for Ras‐induced Raf‐MEK‐ERK activation and epithelial cell migration. Nat Cell Biol 7, 837–843. [DOI] [PubMed] [Google Scholar]
- Richard DJ, Bolderson E, Cubeddu L, Wadsworth RI, Savage K, Sharma GG, Nicolette ML, Tsvetanov S, McIlwraith MJ, Pandita RK et al (2008) Single‐stranded DNA‐binding protein hSSB1 is critical for genomic stability. Nature 453, 677–681. [DOI] [PubMed] [Google Scholar]
- Samatar AA and Poulikakos PI (2014) Targeting RAS‐ERK signalling in cancer: promises and challenges. Nat Rev Drug Discov 13, 928–942. [DOI] [PubMed] [Google Scholar]
- Scheffzek K, Ahmadian MR, Kabsch W, Wiesmuller L, Lautwein A, Schmitz F and Wittinghofer A (1997) The Ras‐RasGAP complex: structural basis for GTPase activation and its loss in oncogenic Ras mutants. Science 277, 333–338. [DOI] [PubMed] [Google Scholar]
- Scholl C, Frohling S, Dunn IF, Schinzel AC, Barbie DA, Kim SY, Silver SJ, Tamayo P, Wadlow RC, Ramaswamy S et al (2009) Synthetic lethal interaction between oncogenic KRAS dependency and STK33 suppression in human cancer cells. Cell 137, 821–834. [DOI] [PubMed] [Google Scholar]
- Schubbert S, Shannon K and Bollag G (2007) Hyperactive Ras in developmental disorders and cancer. Nat Rev Cancer 7, 295–308. [DOI] [PubMed] [Google Scholar]
- Schwab RA and Niedzwiedz W (2011) Visualization of DNA replication in the vertebrate model system DT40 using the DNA fiber technique. J Vis Exp, e3255. doi: 10.3791/3255. [DOI] [PMC free article] [PubMed] [Google Scholar]
- Sears RC (2004) The life cycle of C‐myc: from synthesis to degradation. Cell Cycle 3, 1133–1137. [PubMed] [Google Scholar]
- Sears R, Nuckolls F, Haura E, Taya Y, Tamai K and Nevins JR (2000) Multiple Ras‐dependent phosphorylation pathways regulate Myc protein stability. Genes Dev 14, 2501–2514. [DOI] [PMC free article] [PubMed] [Google Scholar]
- Shirasawa S, Furuse M, Yokoyama N and Sasazuki T (1993) Altered growth of human colon cancer cell lines disrupted at activated Ki‐ras. Science 260, 85–88. [DOI] [PubMed] [Google Scholar]
- Singh A, Sweeney MF, Yu M, Burger A, Greninger P, Benes C, Haber DA and Settleman J (2012) TAK1 inhibition promotes apoptosis in KRAS‐dependent colon cancers. Cell 148, 639–650. [DOI] [PMC free article] [PubMed] [Google Scholar]
- Sorensen CS, Hansen LT, Dziegielewski J, Syljuasen RG, Lundin C, Bartek J and Helleday T (2005) The cell‐cycle checkpoint kinase Chk1 is required for mammalian homologous recombination repair. Nat Cell Biol 7, 195–201. [DOI] [PubMed] [Google Scholar]
- Srihari S, Kalimutho M, Lal S, Singla J, Patel D, Simpson PT, Khanna KK and Ragan MA (2016) Understanding the functional impact of copy number alterations in breast cancer using a network modeling approach. Mol BioSyst 12, 963–972. [DOI] [PubMed] [Google Scholar]
- Stanhill A, Schick N and Engelberg D (1999) The yeast ras/cyclic AMP pathway induces invasive growth by suppressing the cellular stress response. Mol Cell Biol 19, 7529–7538. [DOI] [PMC free article] [PubMed] [Google Scholar]
- Steckel M, Molina‐Arcas M, Weigelt B, Marani M, Warne PH, Kuznetsov H, Kelly G, Saunders B, Howell M, Downward J et al (2012) Determination of synthetic lethal interactions in KRAS oncogene‐dependent cancer cells reveals novel therapeutic targeting strategies. Cell Res 22, 1227–1245. [DOI] [PMC free article] [PubMed] [Google Scholar]
- Tennstedt P, Fresow R, Simon R, Marx A, Terracciano L, Petersen C, Sauter G, Dikomey E and Borgmann K (2013) RAD51 overexpression is a negative prognostic marker for colorectal adenocarcinoma. Int J Cancer 132, 2118–2126. [DOI] [PubMed] [Google Scholar]
- Toda T, Uno I, Ishikawa T, Powers S, Kataoka T, Broek D, Cameron S, Broach J, Matsumoto K and Wigler M (1985) In yeast, RAS proteins are controlling elements of adenylate cyclase. Cell 40, 27–36. [DOI] [PubMed] [Google Scholar]
- Tong AH, Lesage G, Bader GD, Ding H, Xu H, Xin X, Young J, Berriz GF, Brost RL, Chang M et al (2004) Global mapping of the yeast genetic interaction network. Science 303, 808–813. [DOI] [PubMed] [Google Scholar]
- Tran B, Kopetz S, Tie J, Gibbs P, Jiang ZQ, Lieu CH, Agarwal A, Maru DM, Sieber O and Desai J (2011) Impact of BRAF mutation and microsatellite instability on the pattern of metastatic spread and prognosis in metastatic colorectal cancer. Cancer 117, 4623–4632. [DOI] [PMC free article] [PubMed] [Google Scholar]
- Van Schaeybroeck S, Kalimutho M, Dunne PD, Carson R, Allen W, Jithesh PV, Redmond KL, Sasazuki T, Shirasawa S, Blayney J et al (2014) ADAM17‐dependent c‐MET‐STAT3 signaling mediates resistance to MEK inhibitors in KRAS mutant colorectal cancer. Cell Rep 7, 1940–1955. [DOI] [PubMed] [Google Scholar]
- Ward A, Khanna KK and Wiegmans AP (2015) Targeting homologous recombination, new pre‐clinical and clinical therapeutic combinations inhibiting RAD51. Cancer Treat Rev 41, 35–45. [DOI] [PubMed] [Google Scholar]
- Wood MD and Sanchez Y (2010) Deregulated Ras signaling compromises DNA damage checkpoint recovery in S. cerevisiae . Cell Cycle 9, 3353–3363. [DOI] [PMC free article] [PubMed] [Google Scholar]
- Wu CH, van Riggelen J, Yetil A, Fan AC, Bachireddy P and Felsher DW (2007) Cellular senescence is an important mechanism of tumor regression upon c‐Myc inactivation. Proc Natl Acad Sci U S A 104, 13028–13033. [DOI] [PMC free article] [PubMed] [Google Scholar]
- Xu N, Lao Y, Zhang Y and Gillespie DA (2012) Akt: a double‐edged sword in cell proliferation and genome stability. J Oncol 2012, 951724. [DOI] [PMC free article] [PubMed] [Google Scholar]
- Yeh JJ, Routh ED, Rubinas T, Peacock J, Martin TD, Shen XJ, Sandler RS, Kim HJ, Keku TO and Der CJ (2009) KRAS/BRAF mutation status and ERK1/2 activation as biomarkers for MEK1/2 inhibitor therapy in colorectal cancer. Mol Cancer Ther 8, 834–843. [DOI] [PMC free article] [PubMed] [Google Scholar]
Associated Data
This section collects any data citations, data availability statements, or supplementary materials included in this article.
Supplementary Materials
Fig. S1. Homology sequence analysis between human and yeast Ras.
Fig. S2. (A) Growth kinetic of HCT116 isogenic pair lines determined using the IncuCyte ZOOM® live cell imager (phase‐only processing module). The percentage of cell confluence was determined using an IncuCyte mask analyzer. (B) HCT116 Isogenic pair lines were reverse transfected with 10 nm of the pool siRNA as indicated and mRNA levels were determined relative to scramble control siRNA transfected cells. Error bars represent the standard deviation of the mean from triplicates. (C) Colorectal cancer lines were reverse transfected with 10 nm of the pool siRNA of RAD51 and immunoblot was performed to determine RAD51 protein levels. (D) HCT116 Isogenic pair lines were reverse transfected with 10 nm of the pool siRNA of RAD51 for 96 h and cell viability and death were determined using MultiTox Glo multiplex cytotoxicity assay. Scr: scrambled siRNA was used as control and relative cell viability was determined to the scr control transfected cells. *P < 0.05; **P < 0.01; ns: not significant. Error bars represent the standard error of the mean (SEM) from three independent experiments. (E) Representative images of replication fork DNA fibers in both wild‐type and mutant KRAS lines.
Fig. S3. (A) Representative cytogram images of cell cycle distribution analyzed at 6 h after exposure to IR (6 Gy) in the isogenic lines using ModFit LT 4.0 software. (B) Percentage of cell cycle distribution analyzed at 24 h following 1 Gy of IR treatment in the isogenic lines using ModFit LT 4.0 software. n = 2 ± SEM. (C) Representative images of the isogenic colorectal cancer lines coimmunostained with anti‐53BP1 (green), Cyclin A (red) and DAPI (blue) following 1 Gy ionizing radiation processed after 0.5 or 24 h.
Fig. S4. (A) DKs‐8 cells were reverse transfected with either 10 nm of siRNA (left) or treated with 0.25 μm AZD6244, a MEK1/2 inhibitor and cell viability was determined after 96 h. Relative cell viability was determined by comparing with scrambled control transfected/DMSO treated cells. (B) Quantification of IR (6 Gy)‐induced RAD51 foci‐positive cells analyzed at 6 h after treatment in c‐MYC‐depleted HKe‐3 cells. siSCR transfected parental cells were used as a control. The percentage of cells with > 10 RAD51 foci were counted. n = 2 ± SEM. (C) Isogenic KRAS‐mutant colorectal cancer lines were treated with 1.0 μm of MEK1/2i (AZD6244) alone or in combination with 25 μm RI‐1 and immunoblot analysis was performed after 48 h to determine the expression of cleaved PARP, RAD51, γH2AX and phosphorylated ERK1/2. COX‐IV expression was used as a loading control. (D) KRAS‐mutant isogenic colorectal cancer lines were treated with BEZ235, AZD2281 or a combination of both inhibitors for 24 h and immunostained for γH2AX foci.
Table S1. Primer sequences used in this study.
Table S2. siRNA sequences used in this study.