

ABSTRACT
Background: Adequate vitamin D status contributes to bone fragility risk reduction and possibly other pathological conditions that occur with aging. In response to pharmaceutical vitamin D3 supplements, several studies have documented the influence of doses, baseline status, and seasonality on serum 25-hydroyvitamin D (s25OHD).
Objective: Using fortified yogurt, we investigated in one randomized controlled trial how both baseline status, as assessed by measuring s25OHD prior the onset of the trial, and the season of enrollment quantitatively influenced the response to the supplemented (Suppl.) of vitamin D3 (VitD3) in healthy community-dwelling women.
Methods: A 24-week controlled trial was conducted in menopausal women (mean age: 61.5). Participants were randomized into 3 groups (Gr): Gr.Suppl.0, time controls maintaining dietary habits; Gr.Suppl.5 and Gr.Suppl.10 consuming one and two 125-g servings of VitD3-fortified yogurts with 5- and 10-µg daily doses, respectively. The 16 intervention weeks lasted from early January to mid-August, the 8 follow-up weeks, without product, from late August to mid-October. Before enrollment, subjects were randomized into 2 s25OHD strata: low stratum (LoStr): 25–50 nmol/L; high stratum (HiStr): >50–75 nmol/L.
Results: All enrolled participants adhered to the protocol throughout the 24-week study: Gr.Suppl.0 (n = 45), Gr.Suppl.5 (n = 44), and Gr.Suppl.10 (n = 44). Over the 16 intervention and 8 follow-up weeks, s25OHD increased in both supplemented groups, more in Gr.Suppl.10 than in Gr.Suppl.5. At the end of the intervention, the subject proportion with s25OHD ≥ 50 nmol/L was 37.8, 54.5, and 63.6% in Gr.Suppl.0, Gr.Suppl.5, and Gr.Suppl.10, respectively. The constant rate of s25OHD per supplemental VitD3 microgram was greater in LoStr than HiStr. The s25OHD increase was greater with late (mid-March) than early (mid-January) inclusion.
Conclusion: This randomized trial demonstrates (1) a dose-dependent s25OHD improvement related to fortified yogurt consumption; (2) an inversely baseline-dependent increase in s25OHD; and (3) a seasonal effect that highlights the importance of VitD3-fortified foods during winter, even at 5 µg/d, in healthy menopausal women.
KEYWORDS: Nutritional intervention, menopausal women, vitamin D3–fortified yogurts, serum 25OHD dose–response, seasonality interaction
Introduction
Improving the vitamin D status of the general population is recognized as an important public health commitment [1–5]. This status can be assessed by the measurement of its main circulating metabolite, namely, serum 25-hydroxyvitamin D (s25OHD). Among adults, the risk of vitamin D insufficiency (s25OHD < 50 nmol/L), even deficiency (s25OHD < 25 nmol/L), increases with age [2,6].
The greater risk appears to be in elderly population, particularly those living in institutions and who, for various reasons, have a limited access to sun exposure that is not compensated by an adequate vitamin D intake [7]. Nevertheless, younger populations, such as menopausal women in their late 60s and early 70s, also include a certain number of individuals with s25OHD between 25 and 50 nmol/L, a status that corresponds to vitamin D insufficiency [4,8]. The best-documented outcome of this inadequate supply is the risk of fragility fractures, which increases with advancing age [4,8–10].
The limited vitamin D supply provided by most consumed foods in industrialized countries requires an alternative strategy for preventing the development of insufficient or deficient status of this micronutrient in the general population. Fostering sun exposure might theoretically represent an alternative strategy, because ultraviolet radiation of 290- to 315-nm wavelength (ultraviolet B) stimulates the cutaneous photosynthesis of vitamin D3 (cholecalciferol) from 7-dehydrocholesterol [11]. However, this potential alternative is far from being straightforward. Indeed, the production of vitamin D3 (VitD3) by the skin is dependent on several factors, including seasonality, geographical location (latitude, altitude), ozone layer, cutaneous melanin pigment, aging, obesity, and body mass index (BMI), as well as the widespread practice of sun avoidance and/or use of protection creams to curtail skin cancer risk [8,11–15]. Therefore, taking all of these various determinants into account, it is difficult to recommend the appropriate sunlight exposure “dose“ in order to achieve a sufficient vitamin D status without increasing skin cancer risk [15–17].
It is easier to determine the sufficient amount of vitamin D3, whether taken orally in pharmaceutical preparations or in fortified foods. Nevertheless, the impact of vitamin D3 intake on its status depends upon several factors, including (1) dosage; (2) baseline s25OHD level; and (3) season of the year. These 3 determinants have been identified in several observational or interventional studies [2,5,8,12–14,18–27]. How these 3 determinants quantitatively interact remains to be documented in a single prospective study including well-characterized subjects.
In order to test these assumptions, we designed a 24-week randomized controlled trial to quantitatively assess the evolution of s25OHD in response to 2 amounts of vitamin D3 as supplied in fortified yogurt in a cohort of healthy menopausal women. The study was designed to highlight the interaction of the s25OHD response with the baseline vitamin D status and the influence of seasonality.
Materials and methods
Ethical aspects
The study was carried out in accordance with the Declaration of Helsinki as modified in Fortaleza (Brazil) in October 2013 and the recommendations on Good Clinical Practice (ICH E6) and any applicable local regulatory requirements. The study began upon receipt of the approval of both the Ethics Committee (“Comité de Protection des Personnes” and the French Health Authorities (Agence nationale de sécurité du médicament et des produits de santé).
Participants
Participants were recruited among community-dwelling women in the Auvergne–Rhône–Alpes region in France. Only study-specific recruitment tools approved by the European Community were used. These recruitment tools included a volunteer database from the General Clinical Research Center (GCRC), Eurofins-Optimed (Gières, France); regional newspaper advertisements with specific press inserts; radio spots and broadcast messages; posters; mailings; and the GCRC recruitment website. Two hundred eighty-eight volunteers expressed interest in participating. The screening procedure occurred within 3 weeks before the intervention; 140 participants met the study design criteria and were enrolled between January 7 and April 22, 2015.
Inclusion criteria
Inclusion criteria were as follows: women aged between 55 and 75 years with menopause for ≥5 years; informed consent obtained in conformity with the European Directive and French Code of Public Health; and BMI ranging from 18 to 28 kg/m2.
Exclusion criteria
Exclusion criteria included the use of any form of supplemental vitamin D whether as pharmaceutical preparation or through the intake of fortified foods such as milk, dairy products, oil, and tofu during the 6 months preceding the trial; functional disability or confinement to bed; concomitant bone disease or any illness affecting calcium–inorganic phosphate (Ca-Pi) metabolism such as primary hyperparathyroidism, osteoporotic fracture during the year preceding the study, chronic gastrointestinal disease, chronic renal failure, hepatic and cardiac failure, or cancer; treatment during the last 6 months for osteoporosis or other bone disease, including pharmaceutical agents such as bisphosphonates, raloxifene, teriparatide, strontium ranelate, and denosumab; current glucocorticoid treatment; ongoing hormonal replacement therapy; lactose intolerance or any substantial food allergy; and participation in a clinical trial during the 3 months preceding entry into the study.
Design and conduct of the trial
The study was a randomized, open-label controlled trial conducted in one single GCRC located in Gières, (Isère Departement of the Auvergne–Rhône–Alpes region), France.
The aim was to evaluate the effects of a daily consumption of 1 or 2 yogurts fortified with vitamin D and calcium on the evolution of 25OHD during 16 weeks. One 125-g yogurt pot provided 5 µg VitD3, 400 mg calcium, 5 g protein, and 88 kcal energy.
A randomization list was used by the GCRC to distribute the participants into 3 groups:
-
•
Gr.Suppl.0: Parallel time controls that were advised not to change their dietary habits during the 24-week study.
-
•
Gr.Suppl.5: Consumption of 1 yogurt per day during 16 weeks followed by 8 weeks without product.
-
•
Gr.Suppl.10: Consumption of 2 yogurts per day during 16 weeks followed by 8 weeks without product.
Ambulatory visits at the clinical research center were scheduled at inclusion or baseline (BSL) and after weeks 4 (WK4), 8 (WK8), 12 (WK12), 16 (WK16), and 24 (WK24). At each visit, a physical examination was performed, including measurement of body weight, waist circumference, blood pressure, and heart rate and blood sampling. Participants provided a diary reporting information on compliance and product acceptability (see below).
Adherence assessment and acceptability evaluation
Participants randomized to consume 1 (Gr.Suppl.5, n = 44) or 2 yogurts (Gr.Suppl.10, n = 44) per day were asked to complete questionnaires regarding adherence and acceptability of the product. Adherence was noted each day by the participants in a diary. Furthermore, they were asked to keep the yogurt lids. Adherence to or compliance with the intervention in Gr.Suppl.5 and Gr.Suppl.10 was assessed by computing the number of yogurt pot lids returned by the participants at each visit from WK4 to WK16. Adherence was expressed as the ratio (%) of pots consumed to pots distributed for each period of 4 weeks.
Acceptability was assessed at weeks 4, 8, 12, and 16 following the onset of the intervention. A scale from 0 to 10 (do not agree at all = 0; completely agree = 10) was completed in response to the following questions: “Does the dairy product have a pleasant taste?” “Is its size suitable for my appetite?” “Is consumption at a rate of 2 pots per day too restrictive, that is, does it limit the food intake at lunch and dinner?” “Am I tired of consuming it?” The investigator noted the responses for the last 4 weeks in the appropriate section of the case report form.
Sun exposure and vitamin D supplies
Participants were asked to limit daily sun exposure with bare arms or legs to no longer than 20 minutes and not to attend tanning centers. The subjects had to report whether at any time during the 24 investigation weeks they spent more than 20 minutes daily with uncovered arms exposed to the sun or traveled to regions with ultraviolet exposure greater than in the investigation area. The dietary vitamin D supplies were assessed using a questionnaire on the consumption of foods containing vitamin D [28] and was completed at BSL, WK16, and WK 24.
Biochemical analysis
Blood samples were collected in the morning after an overnight fast. They were stored at −70°C until analysis. s25OHD was determined by 2 successive methods. For the screening samples, s25OHD was measured by an automated electroluminescence immunoassay (Cobas 6000, Roche Diagnostics, Rotkreuz, Switzerland). Then, for all samples collected from BSL to WK24 and thus included in the statistical analysis of the results, serum 25OHD was measured by enzyme-linked immunosorbent assay (Promokine, Heidelberg, Germany) on a Bio-Rad Microtech Microplate Reader (Hercules, CA). In other words, the screening s25OHD values were measured several days before the baseline measurements.
The intra-assay and interassay variations were less than 7.0% for both assays. All analytical measurements from BSL to WK24 were run together. Each sample was measured in duplicate.
The option to shift from electroluminescence immunoassay used at screening to enzyme-linked immunosorbent assay used for the whole randomized controlled trial was warranted by the apparent greater sensitivity of the latter method. This shift resulted in an expansion of the s25OHD range from 21–76 (screening) to 7–74 (BSL) nmol/L as determined in the 133 samples collected from all participants included who were compliant during the 24-week trial. The correlation coefficient (r) between the 2 methods was 0.765 as assessed in blood collected at screening and at baseline (mean time interval: 6.4 days) in the 133 subjects who participated in the 24-week randomized study.
Statistical analysis
Determination of the sample size was estimated in order to highlight a difference in serum 25OHD of 7.5 nmol/L between the yogurt-consuming groups (active) and the control group (primary outcome). Taking into account a serum 25OHD standard deviation (SD) of 10 nmol/L, in order to achieve a power of 90% and a 2-sided α of 5%, the overall number of subjects to be included was estimated at 105; that is, 35 per group. With an anticipated dropout rate of 25%, 140 participants were eventually randomized; that is, 46, 47, and 47 in Gr.Suppl.0, Gr.Suppl.5, and Gr.Suppl.10, respectively. Seven subjects dropped out before the onset of the intervention: 1, 3, and 3 in Gr.Suppl.0, Gr.Suppl.5, and Gr.Suppl.10, respectively. Statistical analysis was applied to all included and compliant subjects (n = 133) and in addition to 2 subgroups stratified according to s25OHD from 25 to 50 nmol/L and from ≥50 to 75 nmol/L as measured in the screening samples. This stratification generated the following 2 subpopulations: low stratum (LoStr), n = 53; high stratum (HiStr), n = 80 (secondary outcome). Over the 16 intervention weeks and the following 8 weeks after discontinuation, the differences in the time course and the tested products for s25OHD were evaluated by repeated measures analysis of variance (ANOVA) with adjustment by Tukey's test. Student's t test was used for changes from BSL to WK16 as well as the Wilkoxon signed rank test whenever the variable was not normally distributed.
Over the first 8 weeks of the intervention (from BSL to WK8), the rate constant of the changes in serum 25OHD per microgram of VitD3 consumed (nmol/L/µg vitamin D3) was calculated for both Gr.Suppl.5 and Gr.Suppl.10 (secondary outcome). The rate constant measurement indicates to what extent added dietary vitamin D3 raises the level of s25OHD compared to baseline. It represents the amount of VitD3 biologically converted to 25OHD as assessed in serum samples at a specific time after the onset of the intervention. It is a quantitative estimate of the efficiency of the intervention. Over the first 8 weeks of the intervention, s25OHD virtually remained constant in Gr.Suppl.0 (see Table 1). This avoided any substraction or addition computed from changes in the time control group.
Table 1.
Baseline demographic characteristics of the 3 randomized groups.
| n | Gr.Suppl.0 | Gr.Suppl.5 | Gr.Suppl.10 |
|---|---|---|---|
| 45 | 44 | 44 | |
| Age (years) | 62.6 (5.4) | 60.4 (4.0) | 61.4 (5.3) |
| Weight (kg) | 65.1 (7.4) | 64.0 (9.3) | 63.9 (7.3) |
| Height (cm) | 163.0 (5.4) | 161.5 (5.3) | 160.9 (6.0) |
| BMI (kg/m2) | 24.5 (2.7) | 24.5 (3.3) | 24.7 (2.7) |
| Waist circumference (cm) | 86.8 (7.4) | 85.3 (9.3) | 85.9 (8.0) |
Gr.Suppl.0 = no vitamin D3–fortified yogurt consumption; recommendation to maintain dietary habits during 24 weeks, Gr.Suppl.5 = 1 vitamin D3–fortified yogurt/d during 16 weeks followed by 8 weeks without product, Gr.Suppl.10 = 2 vitamin D3–fortified yogurts/d during 16 weeks followed by 8 weeks without product, BMI = body mass index.
Values are means (SD). There was no statistically significant difference (overall analysis of variance) between the 3 groups for any of the 5 characteristics.
The influence of seasonality was assessed by dichotomizing the 3 randomized groups (Gr.Suppl.0, Gr.Suppl.5, and Gr.Suppl.10) as early (or winter set) and late (spring set) according to the date of enrollment (secondary outcome). The absolute values at BSL, WK4, WK8, and WK16 as well as changes from BSL to WK8 and to WK16 between early and late enrollment were compared by ANOVA for each of the 3 randomized experimental groups. Furthermore, the differences between the 3 groups from baseline to WK24 in the proportion of subjects displaying a serum 25OHD level ≥50 nmol/L [4] were assessed by chi-square test. Statistical analyses were performed using SAS software, Version 9.3 (SAS Institute Inc., Cary, NC).
Results
Demographic characteristics at baseline
There were no significant differences between the 3 randomized groups in relation to either age or anthropometric variables (Table 1).
s25OHD evolution
The evolution of s25OHD levels in the 133 participants during the 16-week intervention (BSL to WK16) and 8 weeks after discontinuation (WK24) is presented in Table 2. The baseline level was quite similar (about 36 nmol/L) among the 3 randomized groups and was within the insufficiency range in conformance with one prespecified inclusion criterion. From BSL to WK8, there was a dose-related increase in s25OHD of 12.3 and 18.4 nmol/L in Gr.Suppl.5 and Gr.Suppl.10, respectively (Table 2 and Figure 1A). From BSL to WK16, differences in changes were highly significant between Gr.Suppl.5 and Gr.Suppl.0 (18.3 vs 7.7 nmol/L, t test: p = 0.0007) and between Gr.Suppl.10 and Gr.Suppl.0 (23.5 vs 7.7 nmol/L, t test: p = 0.000001). The corresponding difference in change between Gr.Suppl.5 and Gr.Suppl.10 was not statistically significant (18.3 vs 23.5 nmol/L, y test: p = 0.116).
Table 2.
Evolution of serum 25OHD in the 3 randomized groups.
| n | Gr.Suppl.0 | Gr.Suppl.5 | Gr.Suppl.10 |
|---|---|---|---|
| 45 | 44 | 44 | |
| BSL | 36.4 (15.8) | 36.5 (14.6) | 35.9 (14.8) |
| WK4 | 31.8 (14.9) | 41.4 (11.7) | 44.5 (11.3) |
| WK8 | 36.6 (16.3) | 48.8 (12.7) | 54.3 (16.6) |
| WK12 | 38.7 (17.7) | 51.0 (16.3) | 55.4 (15.9) |
| WK16 | 44.1 (17.9) | 54.8 (15.9) | 59.4 (17.2) |
| WK24 | 49.5 (18.8) | 52.6 (17.0) | 58.9 (19.9) |
25OHD = 25-hydroyvitamin D, Gr.Suppl.0 = no vitamin D3–fortified yogurt consumption; recommendation to maintain dietary habits during 24 weeks, Gr.Suppl.5 = 1 vitamin D3–fortified yogurt/d during 16 weeks followed by 8 weeks without product, Gr.Suppl.10 = 2 vitamin D3–fortified yogurts/d during 16 weeks followed by 8 weeks without product, BSL = baseline visit, WK4 to WK24 = number of weeks elapsed from the baseline visit, WK16 = end of the intervention for both Gr.Suppl.5 and Gr.Suppl.10, WK24 = 8 weeks after discontinuation of the intervention for both Gr.Suppl.5 and Gr.Suppl.10.
Serum 25OHD values are means (SD) in nanomoles per liter. Probability levels for group-by-time interaction (repeated measures analysis of variance) for the evolution of serum 25OHD from BSL to WK16 were p = 0.0001 for the difference between Gr.Suppl.10 or Gr.Suppl.5 and Gr.Suppl.0 and p = 0.0417 for the difference between Gr.Suppl.10 and Gr.Suppl.5. Probability levels for the evolution following the discontinuation of the intervention—that is from WK16 to WK24—were p = 0.0025 and p = 0.0321 for the differences between Gr.Suppl.0 vs Gr.Suppl.5 and Gr.Suppl.10, respectively, and p = 0.706 for the difference between Gr.Suppl.10 and Gr.Suppl.5.
Figure 1A.

Change (∆) in s25OHD in nanomoles per liter from baseline to weeks 4, 8, 12, and 16 after the onset of the intervention. One hundred thirty-three healthy menopausal women were randomized into 3 groups: Gr.Suppl.0, who were advised not to change their dietary habits; Gr.Suppl.5, who consumed one fortified yogurt that provided 5 µg of vitamin D3 per day; and Gr.Suppl.10, who consumed 2 fortified yogurts that provided 10 µg of vitamin D3 per day. The SD values are written in association with each column. Statistical test by repeated measures ANOVA indicates that the differences between Gr.Suppl.5 or Gr.Suppl.10 and Gr.Suppl.0 was significant at p = 0.0007 and p = 0.00002, respectively. The difference between Gr.Suppl.5 and Gr, Suppl.10 was not significant taking into account an adjustment for 3 comparisons reducing the p level from 0.050 to 0.0167.
After 8 weeks of yogurt consumption, serum 25OHD was increased to 89.1% (Gr.Suppl.5) and to 94.1% (Gr.Suppl.10) of the level measured after 16 weeks (Table 2). In the control group (Gr.Suppl.0), during the first 8 weeks, s25OHD remained stable: 36.4 at BSL and 36.6 nmol/L at WK8 (Table 2, Figure 1A). Thereafter it rose significantly to reach a level of 44.1 nmol/L at week 16 (Table 2, Figure 1A). After discontinuation of the intervention, from WK16 to WK24, s25OHD was virtually maintained in both Gr.Suppl.10 (−0.57 ± 1.68 nmol/L, p = 0.738) and Gr.Suppl.5 (−2.20 ± 1.62 nmol/L, p = 0.182) and it significantly rose in Gr.Suppl.0 (+5.53 ± 1.61, p = 0.0015; Table 2). As indicated in Table 2, the evolution from WK16 to WK24 was significantly different between the 2 groups who consumed VitD-fortified yogurts and the control group. At WK8, the proportion of subjects who achieved s25OHD levels ≥50 nmol/L—the threshold between insufficient and sufficient vitamin D status according to the 2011 Institute of Medicine report [4]—was 22.2, 45.5, and 54.5% in Gr.Suppl.0, Gr.Suppl.5, and Gr.Suppl.10, respectively (Figure 1B). At WK16, the corresponding proportion was 37.8, 54.5, and 63.6%, respectively (Figure 1B).
Figure 1B.

Proportion of subjects whose s25OHD increased to ≥50 nmol/L from baseline to the end of the intervention (WK16) and 8 weeks later (WK24). The figure illustrates a dose effect related to the duration of the intervention from BSL to WK16. The seasonality effect is highlighted by the increase in the time-controlled group (Gr.Suppl.0) from BSL (samples collected on average from mid-January to mid-March 2015) to WK24 (samples collected on average from mid-July to mid-August 2015). The corresponding absolute values (mean ± SD) of s25OHD in nanomoles per liter are presented in Figure 1A. The probability of difference as assessed by chi-squared tests was p = 0.002 and p = 0.088 between Gr.Suppl.0 and Gr.Suppl.5 at WK8 and WK16, respectively, and p = 0.0001 and p = 0.008 between Gr.Suppl.0 and Gr.Suppl.10 at WK8 and WK16, respectively. At WK24, there was a trend (p = 0.081) for a greater proportion of participants maintaining an s25OHD level ≥50 nmol/L in Gr.Suppl.10 (29/44 = 65.9%) than in Gr.Suppl.5 (21/44 = 47.7%).
Figure 2.
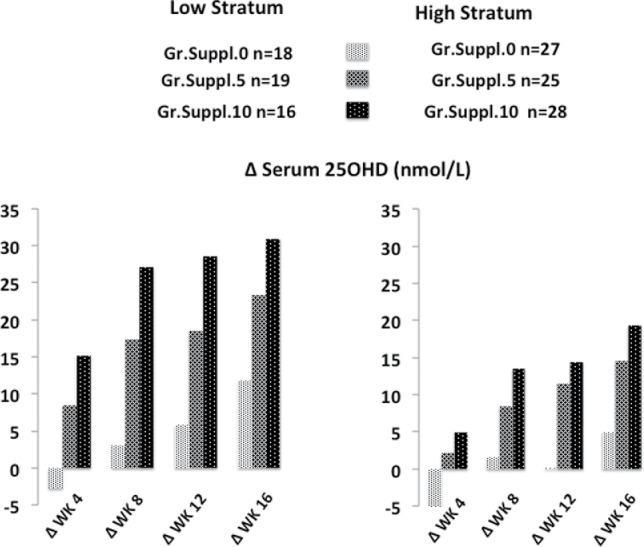
Change (∆) in s25OHD in nanomoles per liter from baseline to weeks 4, 8, 12, and 16 after the onset of the intervention. One hundred thirty-three healthy menopausal women were randomized into 3 groups: Gr.Suppl.0, who were advised not to change their dietary habits; Gr.Suppl.5, who consumed one fortified yogurt providing 5 µg of vitamin D3 per day; and Gr.Suppl.10, who consumed 2 fortified yogurts providing 10 µg of vitamin D3 per day. Based on s25OHD values measured in screening samples, the cohort was divided into 2 strata: low, from 25 to 50 nmol/L, and high, from >50 to 75 nmol/L. The statistical significance by repeated measures ANOVA indicates that the differences between Gr.Suppl.5 or Gr.Suppl.10 and Gr.Suppl.0 for the low stratum were significant at p = 0.0012 and p = 0.0001, respectively. For the high stratum, the corresponding significance was p = 0.0020 and p = 0.0001, respectively. The difference between Gr.Suppl.5 and Gr.Suppl.10 was significant in the low stratum (p = 0.0346) but not in the high stratum (p = 0.416). The influence of baseline serum 25OHD level on the progressive increase in serum 25OHD during the intervention was significantly greater in the low stratum than in the high stratum (p = 0.0001).
s25OHD response in relation to baseline level
Based on screening s25OHD levels, the participants were segregated into low stratum (LowStr from 25 to 50 nmol/L, n = 53) and high stratum (HighStr ≥ 50 to 75 nmol/L, n = 80). The evolution from BSL to WK24 of the absolute s25OHD values indicates a dose effect of VitD3-fortified yogurts in both LowStr and HighStr subgroups (Table 3). The changes from baseline to 8 weeks were as follows: for Gr.Suppl.5: 17.4 nmol/L LowStr vs 8.4 nmol/L HighStr (Figure 2); for Gr.Suppl.10: 27.1 nmol/L LowStr vs 13.5 nmol/L HighStr; for Gr.Suppl.0: 3.0 nmol/L LowStr vs −1.6 nmol/mL HighStr (Figure 2). Thus, the absolute increase in s25OHD after 8 weeks was greater in LowStr than in HighStr regardless of the daily vitamin D3 amounts consumed (5 or 10 µg).
Table 3.
Evolution of serum 25OHD in subjects distributed according to their initial vitamin D status.
| Gr.Suppl.0 |
Gr.Suppl.5 |
Gr.Suppl.10 |
||||
|---|---|---|---|---|---|---|
| Low Stratum | High Stratum | Low Stratum | High Stratum | Low Stratum | High Stratum | |
|
n |
18 |
27 |
19 |
25 |
16 |
28 |
| BSL | 22.0 (7.4) | 46.0 (12.1) | 26.8 (10.4) | 43.9 (13.0) | 23.0 (8.5) | 43.2 (12.5) |
| WK4 | 19.2 (8.8) | 40.1 (12.0) | 35.3 (9.4) | 46.1 (11.3) | 38.2 (10.0) | 48.1 (10.5) |
| WK8 | 24.9 (10.5) | 44.4 (14.9) | 44.2 (11.1) | 52.3 (12.9) | 50.1 (16.7) | 56.7 (16.3) |
| WK12 | 27.7 (13.0) | 46.1 (16.8) | 45.3 (12.3) | 55.3 (17.8) | 51.6 (15.2) | 57.5 (16.1) |
| WK16 | 33.8 (16.2) | 51.0 (15.8) | 50.2 (13.3) | 58.4 (17.1) | 54.0 (17.5) | 62.5 (16.5) |
| WK24 | 37.9 (14.1) | 57.2 (17.7) | 46.0 (13.5) | 57.7 (17.9) | 50.8 (14.9) | 63.5 (21.1) |
25OHD = 25-hydroyvitamin D, Gr.Suppl.0 = no vitamin D3–fortified yogurt consumption; recommendation to maintain dietary habits during 24 weeks, Gr.Suppl.5 = 1 vitamin D3–fortified yogurt/d during 16 weeks followed by 8 weeks without product, Gr.Suppl.10 = 2 vitamin D3–fortified yogurts/d during 16 weeks followed by 8 weeks without product, BSL = baseline visit, WK4 toWK24 = number of weeks elapsed from the baseline visit, WK16 = end of the intervention for both Gr.Suppl.5 and Gr.Suppl.10, WK24 = 8 weeks after discontinuation of the intervention for both Gr.Suppl.5 and Gr.Suppl.10.
Serum 25OHD values are means (SD) in nanomoles per liter. The participants were distributed as low or high according to their serum 25OHD screening values; that is, before the BSL visit. Low stratum range: 25 to 50 nmol/L; high stratum range: ≥50 to 75 nmol/L. Probability levels for group-by-time interaction (repeated measures analysis of variance) for the evolution of serum 25OHD from BSL to WK16 were as follows: low stratum: p = 0.0001 and p = 0.0012 for the difference between Gr.Suppl.10 or Gr.Suppl.5 and Gr.Suppl.0, respectively, and p = 0.0346 for the difference between Gr.Suppl.10 and Gr.Suppl.5.
Figure 3.

Changes in s25OHD during the first 8 weeks following the consumption of 1 or 2 vitamin D3–fortified yogurts that increased the intake of vitamin D3 up to 5 and 10 µg per day, respectively. Columns indicate the rate constant of the increase in s25OHD in nanomoles per liter per 1 µg of supplemental vitamin D3. SD values are written in association with each column. The totality (ALL) of participants (left 2 columns) was separated into a high stratum (middle 2 columns) and low stratum (right 2 columns) according to the values of s25OHD as measured in screening samples: >50 to 75 and 25 to ≤50 nmol/L, respectively. Number of subjects: ALL, 44 and 44 in Gr.Suppl.5 and Gr.Suppl.10, respectively; high stratum, 25 and 28; low stratum, 19 and 16 in Gr.Suppl.5 and Gr.Suppl.10, respectively. Statistical evaluation by ANOVA between Gr.Suppl.5 and Gr.Suppl.10: ALL, p = 0.488; high stratum, p = 0.452; low stratum, p = 0.794. Difference between high stratum and low stratum: p = 0.0006.
s25OHD rate constant
The rate constant was calculated based on the increase in s25OHD per microgram of VitD3 consumed from BSL to WK8. For all participants in the 2 vitamin D3–supplemented groups, it was not significantly different between Gr.Suppl.5 and Gr.Suppl.10 (1.49 vs 1.18 nmol/L, respectively; Figure 3). By comparing the 2 strata according to baseline s25OHD, it was 2.3- and 2.9-fold greater in LowStr than in HighStr in Gr.Suppl.5 and Gr.Suppl.10, respectively (Figure 3).
Figure 4.

Changes in s25OHD after 8 and 16 weeks of intervention. The 3 randomized groups were divided into 2 subgroups according to enrollment date: early (January 16–18, 2015) and late (March 13–17, 2015). The figure illustrates the interactions between the sampling date (season effect) and the amount of vitamin D3 (dose effect) as consumed from fortified yogurt that provided daily either 5 µg (Gr.Suppl.5) or 10 µg (Gr.Suppl.10) compared to a time-controlled group (Gr.Suppl.0). The SD values are written in association with each column. See Table 4 for the corresponding absolute values, the number of subjects in each subgroup, as well as the probability level for the differences in s250HD between early and late for Gr.Suppl.0, Gr.Suppl.5, and Gr.Suppl.10.
Seasonal effect on s25OHD
The 133 participants were enrolled between early January and late April 2015. In order to assess whether s25OHD was influenced by enrollment time, we analyzed the evolution of vitamin D status after dichotomization of the 3 investigated groups as early (BSL in January) and late (BSL in March) enrollment (Table 4). At BSL, in each randomized group there was no significant difference in s25OHD between early and late enrollment (Table 4). Mean s25OHD changes measured in the parallel time-controlled group illustrate the influence of enrollment time (as designated by the term seasonality) in the absence of any VitD3 supplementation. In Gr.Suppl.0, the increase in s25OHD from BSL to WK16 was +1.1 nmol/L in the early group and +14.1 nmol/L in the late group. In Gr.Suppl.5, the corresponding increase was +15.2 nmol/L in the early group and +21.4 nmol/L in the late group. In Gr.Suppl.10, it was +12.5 nmol/L in the early group and +24.5 nmol/L in the late group (Table 4 and Figure 4). The contribution of the seasonality effect to the changes measured in the 2 groups consuming VitD3-fortified yogurts from BSL to WK16 may be roughly estimated by subtracting the corresponding change assessed in Gr.Suppl.0 (Table 4 and Figure 4).
Table 4.
Influence of sampling date on serum 25OHD evolution in healthy menopausal women supplemented with vitamin D3 at 5 (Gr.Suppl.5) or 10 µg/d (Gr.Suppl.10) Compared to Time-Controlled Nonsupplemented Participants (Gr.Suppl.0).
| Gr.Suppl.0 |
Gr.Suppl.5 |
Gr.Suppl.10 |
|||||||
|---|---|---|---|---|---|---|---|---|---|
| n | 22 | 23 | 22 | 22 | 22 | 22 | |||
| Sampling Time | Early | Late | Early | Late | Early | Late | p.0 | p.5 | p.10 |
| Date value BSL: Range | 42010-42039 | 42044-42116 | 42010-42044 | 42044-42116 | 42010-42044 | 42046-42116 | |||
| Date value BSL: Mean | 42020 | 42076 | 42021 | 42080 | 42022 | 42080 | |||
| Mean Date BSL: M/D/Y | 01/16/2015 | 03/13/2015 | 01/17/2015 | 03/17/2015 | 01/18/2015 | 03/17/2015 | |||
| 25OHD BSL | 35.1 (14.2) | 37.6 (17.5) | 36.8 (14.2) | 36.3 (15.3) | 38.1 (15.2) | 33.6 (14.5) | 0.612 | 0.902 | 0.316 |
| Date value WK8: Range | 42066-42095 | 42100-42172 | 42066-42102 | 42101-42172 | 42066-42101 | 42102-42172 | |||
| Date value WK8: Mean | 42076 | 42132 | 42077 | 42136 | 42078 | 42136 | |||
| Mean Date WK8: M/D/Y | 03/13/2015 | 05/08/2015 | 03/14/2015 | 05/12/2015 | 03/15/2015 | 05/12/2015 | |||
| 25OHD WK8 | 31.6 (13.6) | 41.5 (17.6) | 48.4 (11.0) | 49.1 (14.5) | 50.6 (13.9) | 58.1 (18.4) | 0.041 | 0.383 | 0.136 |
| Date value WK16: Range | 42122-42151 | 42156-42228 | 42122-42156 | 42156-4228 | 42122-42226 | 42156-42233 | |||
| Date value WK16: Mean | 42132 | 42188 | 42133 | 42192 | 42136 | 42186 | |||
| Mean Date WK16: M/D/Y | 05/08/2015 | 07/03/2015 | 05/09/2015 | 07/07/2015 | 05/12/2013 | 07/01/2015 | |||
| 25OHD WK16 | 36.2 (13.4) | 51.6 (18.7) | 52.0 (14.2) | 57.7 (17.4) | 54.2 (14.1) | 64.6 (18.7) | 0.003 | 0.238 | 0.042 |
| Date value WK24:Range | 42174-42207 | 42212-42284 | 42178-42212 | 42212-42285 | 42172-42212 | 42209-42284 | |||
| Date value WK24:Mean | 42188 | 42243 | 42190 | 42248 | 42190 | 42248 | |||
| Mean Date WK24: M/D/Y | 07/03/2015 | 08/27/2015 | 07/05/2015 | 09/01/2015 | 07/05/2015 | 09/01/2015 | |||
| 25OHD WK24 | 42.9 (15.5) | 55.8 (19.9) | 49.4 (13.3) | 55.9 (19.9) | 50.7 (15.1) | 67.0 (21.1) | 0.019 | 0.205 | 0.005 |
25OHD = 25-hydroyvitamin D, Gr.Suppl.0 = no vitamin D3–fortified yogurt consumption; recommendation to maintain dietary habits during 24 weeks, Gr.Suppl.5 = 1 vitamin D3–fortified yogurt/d during 16 weeks followed by 8 weeks without product, Gr.Suppl.10 = 2 vitamin D3–fortified yogurts/d during 16 weeks followed by 8 weeks without product, BSL = baseline visit, WK4 toWK24 = number of weeks elapsed from the baseline visit, WK16 = end of the intervention for both Gr.Suppl.5 and Gr.Suppl.10, WK24 = 8 weeks after discontinuation of the intervention for both Gr.Suppl.5 and Gr.Suppl.10.
Serum 25OHD values are means (SD) in nanomoles per liter. Date value = Date stored as text in month/day/year (M/D/Y) converted into a serial number, 1 = 01/01/1900. The participants were divided as early or late according to their serum 25OHD sampling dates at baseline (BSL). The next measurements were made after 8 and 16 weeks of intervention and 8 weeks after discontinuation of intervention (WK24). p.0, p.5, p.10: Probability level in serum 25OHD differences between early and late samplings for Gr.Suppl.0, Gr.Suppl.5, and Gr.Suppl.10, respectively.
Evolution of anthropometric, cardiovascular variables, and serum calcium
Over the 16 weeks of intervention, no significant change was observed in body weight, BMI, and waist circumference. Measurements of diastolic/systolic blood pressure remained stable in the 3 groups from BSL to WK8 and WK16. Likewise, serum calcium was not modified by the intervention.
Adherence to consumption of vitamin D3–supplemented yogurts
The degree of adherence as assessed by the number of yogurt pot lids returned by the participants at each visit compared to the number of theoretical number of yogurts distributed remained quite stable from WK4 to WK16, varying from 93% to 100% and from 82% to 100% in Gr.Suppl.5 and Gr.Suppl.10, respectively (p = 0.084).
Acceptability
The tested products, whether consumed at a daily rate of 1 or 2 fortified yogurts, were well accepted in terms of taste, with no negative feeling concerning the dairy product size, a factor that may reduce appetite and thereby limit food intake.
Discussion
Main results
This article highlights the relative importance of 3 interdependent determinants of the response to VitD3-fortified foods documented in one single randomized clinical trial carried out in menopausal women. It provides information on the impact of VitD3-fortified yogurt taken at 2 dose levels compared to a time-controlled group and on the quantitative influence of the baseline vitamin D status. It emphasizes the distinct impact of 2 amounts of VitD3 consumed orally in relation to the period of the year during which the intervention was conducted.
Relation to supplemental doses
According to a 2011 report from the Institute of Medicine, a s25OHD level of ≥50 nmol/L meets the needs, primarily related to bone health outcomes [4], of at least 97.5% of the population. In our study, the baseline s25OHD value of approximately 36 nmol/L (Figures 1A and 1B, Table 1) fell within the insufficiency range. Following consumption of the VitD3-fortified yogurts, s25OHD crossed the sufficiency threshold of 50 nmol/L earlier with a dose of 10 µg/d (54.3 nmol/L after 8 weeks) and later with a dose of 5 µg/d (54.8 nmol/L after 16 weeks; Table 1). Thus, the s25OHD kinetic response differentiates the 2 tested amounts of VitD3 better than the absolute level attained by the end of the intervention (59.4 vs 54.8 nmol/L with 10 vs 5 µg/d after 16 weeks of intervention, p = 0.198; Table 2).
Relation to initial s25OHD level
Previous reports suggested an inverse correlation between baseline vitamin D status and an increase in s25OHD in response to either pharmaceutical supplement or food fortification [5,29,30]. The design of our randomized controlled study was prespecified to test this possible relationship. Our results clearly establish that the lower the baseline vitamin D status, the higher the absolute increment in s25OHD (Figure 2). The reasons for this inverse relationship remain conjectural. Among possible mechanisms are (1) the vitamin D status could influence the distribution of s25OHD; (2) the hepatic hydroxylation rate of the cholecalciferol molecule in position 25 could be inversely related to its product; (3) the affinity of the vitamin D binding protein(s) could vary according to vitamin D status; (4) the activity/induction of catabolic vitamin D 24-hydroxylase enzyme may be reduced in response to a prolonged decrease in the level of serum 25OHD [31–33].
Rate constant of s25OHD increase or vitamin D3 supplementation efficiency
The concept of rate constant as detailed by Heaney et al. [18] is a useful link between the amount of vitamin D consumed as a supplement or fortified foods and improvement in vitamin D status. This value corresponds to an efficiency estimate of the supplemental VitD3 consumed [18]. In a recent systematic review, the rate constant of change in s25OHD expressed as nanomoles per liter per microgram of additional vitamin D was calculated from 18 randomized controlled trials [5]. The mean rate constant close to 2.0 nmol/L per µg of vitamin D [5] was in agreement with an analysis of 41 studies with an average rate constant of 2.1 [34]. We observed an important effect of baseline s25OHD on the response to VitD3-fortified dairy. It was more than twice as high in the participants randomized as LowStr (25 to 50 nmol/L) compared to HighStr (>50 to 75 nmol/L; Figure 3).
Dose–response and seasonality
The magnitude of the effect of vitamin D consumption on its status should reflect both the supplemental dose as well as the season-related evolution of s25OHD. Our study ran from January to October and allows one to identify the relative importance of these 2 factors. Thus, the increase in response to VitD3-fortified yogurts would be substantially overestimated if one did not take into account the evolution of s25OHD as assessed in our study by monitoring a parallel time-control group. The difference between the control and the 2 supplemental groups decreased from the onset of the intervention to the end (Table 1 and Figures 1A and 1B). Most likely, this attenuation of the fortified food effect results from the increased cutaneous production of VitD3. In the control group, s25OHD significantly increased from 36.4 to 44.1 nmol/L (+21.2%) from BSL (mean sampling time mid-February) to WK16 (mean sampling time early June). It increased further to 49.5 nmol/L 8 weeks later (WK24; mean sampling time early August). Thus, from February to August, without evidence of an increase in the food intake of vitamin D in the control group, the status evolved from insufficiency to reach the lower range of sufficiency (50 nmol/L) according to the 2011 Institute of Medicine report [4]. This evolution is in keeping with the influence of seasonality on vitamin D status, as studied in some European countries and the United States [11–14,35]. The seasonality effect from 36.4 to 49.5 nmol/L in the control group (Table 1) approximately equals the consumption during 8 weeks of fortified dairy providing 5 µg/d of supplemental VitD3, which increased the s25OHD level from 36.5 to 48.8 nmol/L (Table 1). Nevertheless, it is somewhat less than that achieved during the same period, from 35.9 to 54.3 nmol/L, with 10 µg/d of supplemental VitD3 (Table 1). These results corroborate the utility of consuming supplemental vitamin D during the winter season.
Food fortification for preventing vitamin D insufficiency in the general population
All enrolled subjects remained compliant with the prescribed fortified dairy products, whether consumed as 1 or 2 servings per day during 16 weeks. This high adherence should reflect the good acceptability of supplemental VitD3 as provided through the consumption of fortified dairy products (for a review, see Whiting et al. [36]).
In terms of public health programs aimed at preventing vitamin D insufficiency, adherence and acceptability are important criteria for achieving a beneficial effect of long-term supplementation. Relatively low vitamin D doses regularly consumed with usual foods offer some advantage over pharmaceutical pills that are either taken daily in small doses but with the risk of low compliance due to medication-related side effects [37] or, alternatively, taken in large amounts at monthly or yearly intervals with the nonnegligible risk of the occurrence of adverse events [38].
The results of our randomized trial in healthy menopausal women pertain to the prevention of insufficient vitamin D status in the general population. Quantitatively, the presented evolution of s25OHD can be interpreted in relation to the 2011 Institute of Medicine report that established that a s25OHD level of at least 50 nmol/L meets the skeletal health requirements for vitamin D of ≥97.5% of the general population [4]. Whether the benefits of vitamin D supplementation would only become manifest when s25OHD reaches a level of at least 75 nmol/L is controversial [3,39]. Furthermore, it remains uncertain that such a high level might be required for the adequate management of disease-related conditions such as cardiovascular disease, site-specific cancers, diabetes, chronic kidney disease, hepatic failure, malabsorption syndromes, and obesity [4,39]. In these pathological conditions, dairy and/or non-dairy food fortification with vitamin D [40] may not be enough to achieve a s25OHD level of 75 nmol/L and above, particularly when ultraviolet B radiation is limited, as recommended to the participants in our trial. To achieve such high levels, the use of vitamin D pharmaceutical supplements in amounts close to the estimated tolerable upper intake level, set at 100 µg/day [4], appears appropriate.
Several epidemiological studies have shown an inverse association between s25OHD and age-adjusted mortality [41–43]. This association between vitamin D status and mortality appears to be stronger with cardiovascular disease (CVD) than non-CVD pathologies [41]. A doubling of s25OHD between 40 and 90 nmol/L was associated with a 20% lower vascular mortality [44]. In 2 recent reports on a well-conducted randomized placebo-controlled trial entitled BEST-D trial (Biochemical Efficacy and Safety Trial of Vitamin D), the effects of daily supplementation of 2000 IU (50 µg) and 4000 IU (100 µg) for 1 year were assessed in about 300 community-dwelling people aged ≥65 years in Oxfordshire [45,46]. s25OHD increased from a mean baseline level of 50 nmol/L to 102 and 137 nmol/L in those allocated daily VitD3 doses of 50 and 100 µg, respectively [46], whereas it barely changed in the placebo group. The authors concluded that 100 µg of VitD3 may be required to achieve a lowest risk of CVD and other diseases such as certain types of cancer [46]. Of note, supplementation with these high doses of VitD3 had no detectable effects on cardiovascular risk factors, including blood pressure, arterial stiffness, circulating lipids, and markers of inflammation [46]. Nevertheless, this randomized controlled trial cannot exclude benefits of CVD prevention beyond 1 year of treatment with high doses of VitD3.
Strengths and weaknesses
This study has a number of strengths:
-
1.
It provides information from a randomized controlled trial on the interaction of 3 important determinants of the vitamin D status prospectively studied in 133 menopausal women who remained adherent over the 24 weeks of the investigation.
-
2.
The kinetic analysis of the initial 8-week increment in s25OHD in response to the consumption of VitD3-fortified dairy clearly differentiates the 2 daily doses tested, namely, 5 vs 10 µg.
-
3.
The study also shows the attenuation of the difference between the 2 doses of supplemental VitD3 during the 16 weeks of intervention.
-
4.
It furthermore unequivocally documents the inverse relationship between baseline vitamin D status and the response to VitD3-fortified yogurt.
-
5.
It demonstrates the marked interaction between the effect of VitD3 supplementation and the season-dependent onset of the intervention.
-
6.
The study highlights the importance of VitD3 supplementation during the winter season, even in amounts as low as 5 µg/d.
-
7.
Its practical utility in terms of public health, allowing a definition of the efficacious amount of VitD3-fortified foods to be consumed by menopausal women according to the season of the year in order to avoid the risk of vitamin D insufficiency.
Weaknesses include the following:
-
1.
The absence of a placebo-control group that consumed the same dairy product without any VitD3 fortification.
-
2.
An estimate by self-questionnaires of vitamin D supplies that reported on sun exposure and frequency of vitamin D–relevant food consumption.
-
3.
The arbitrary dichotomization of the participants between low (25 to 50 nmol/L) and high (>50 to 75 nmol/L) strata based on screening s25OHD measurements that used an analytical method different than that applied to the samples collected during the 24 weeks of the trial. Nevertheless, this modification did not attenuate the marked difference in s25OHD between the 2 strata.
-
4.
The cohort was exclusively white and recruited in one single French region. Therefore, the results may not be the same for other ethnic groups or among populations with different dietary and lifestyle habits and/or living in regions at different latitudes and/or altitudes.
Conclusions
This clinical trial in menopausal women provides data on 3 interdependent determinants of vitamin D status. It documents a dose–response of vitamin D3–fortified yogurt on the evolution of s25OHD during 4 months and the 2 months following discontinuation of the intervention. At the end of the intervention, the percentage of subjects with s25OHD ≥ 50 nmol/L was about 38, 55, and 64% in Gr.Suppl.0, Gr.Suppl.5, and Gr.Suppl.10, respectively. The study unequivocally demonstrates the marked influence of the initial vitamin D status on the absolute increase in s25OHD: the lower the baseline status, the higher the response to a given dose of supplemental VitD3. The trial was conducted from January to October of the same year, which highlighted the important influence of season on the magnitude of the s25OHD response to 2 doses of VitD3-fortified yogurt compared to the maintenance of dietary habits in a time-controlled group. Thus, this randomized controlled trial quantitatively documents the interaction of 3 key determinants of vitamin D status: supplemental doses, initial status, and seasonality.
Funding
Funding was provided by Yoplait France, Boulogne, France, and General Mills, Minneapolis, Minnesota.
Disclosure
J.P.B. is clinical consultant for General Mills-Yoplait; J.P.B. has no financial interest in the outcome of the reported clinical trial. F.D.-P. and B.R. are scientific collaborators of General Mills-Yoplait; E.R. is a former scientific collaborator of Yoplait France; and S.W. is scientific consultant for General Mills-Yoplait; S.W. has no financial interest in the outcome of the reported clinical trial.
References
- 1. Cashman KD, Seamans KM, Lucey AJ, Stocklin E, Weber P, Kiely M, Hill TR: Relative effectiveness of oral 25-hydroxyvitamin D3 and vitamin D3 in raising wintertime serum 25-hydroxyvitamin D in older adults. Am J Clin Nutr 95:1350–1356, 2012. [DOI] [PubMed] [Google Scholar]
- 2. Dawson-Hughes B, Mithal A, Bonjour JP, Boonen S, Burckhardt P, Fuleihan GE, Josse RG, Lips P, Morales-Torres J, Yoshimura N: IOF position statement: vitamin D recommendations for older adults. Osteoporos Int 21:1151–1154, 2010. [DOI] [PubMed] [Google Scholar]
- 3. Holick MF, Binkley NC, Bischoff-Ferrari HA, Gordon CM, Hanley DA, Heaney RP, Murad MH, Weaver CM: Guidelines for preventing and treating vitamin D deficiency and insufficiency revisited. J Clin Endocrinol Metab 97:1153–1158, 2012. [DOI] [PubMed] [Google Scholar]
- 4. Ross AC, Manson JE, Abrams SA, Aloia JF, Brannon PM, Clinton SK, Durazo-Arvizu RA, Gallagher JC, Gallo RL, Jones G, et al.: The 2011 report on dietary reference intakes for calcium and vitamin D from the Institute of Medicine: what clinicians need to know. J Clin Endocrinol Metab 96:53–58, 2011. [DOI] [PMC free article] [PubMed] [Google Scholar]
- 5. Whiting SJ, Bonjour JP, Payen FD, Rousseau B: Moderate amounts of vitamin D3 in supplements are effective in raising serum 25-hydroxyvitamin D from low baseline levels in adults: a systematic review. Nutrients 7:2311–2323, 2015. [DOI] [PMC free article] [PubMed] [Google Scholar]
- 6. Lips P: Vitamin D deficiency and secondary hyperparathyroidism in the elderly: consequences for bone loss and fractures and therapeutic implications. Endocr Rev 22:477–501, 2001. [DOI] [PubMed] [Google Scholar]
- 7. Rolland Y, de Souto Barreto P, Abellan Van Kan G, Annweiler C, Beauchet O, Bischoff-Ferrari H, Berrut G, Blain H, Bonnefoy M, Cesari M, et al.: Vitamin D supplementation in older adults: searching for specific guidelines in nursing homes. J Nutr Health Aging 17:402–412, 2013. [DOI] [PubMed] [Google Scholar]
- 8. Lips P, van Schoor NM, de Jongh RT: Diet, sun, and lifestyle as determinants of vitamin D status. Ann N Y Acad Sci 1317:92–98, 2014. [DOI] [PubMed] [Google Scholar]
- 9. Boonen S, Lips P, Bouillon R, Bischoff-Ferrari HA, Vanderschueren D, Haentjens P: Need for additional calcium to reduce the risk of hip fracture with vitamin d supplementation: evidence from a comparative metaanalysis of randomized controlled trials. J Clin Endocrinol Metab 92:1415–1423, 2007. [DOI] [PubMed] [Google Scholar]
- 10. Bischoff-Ferrari HA: Vitamin D and fracture prevention. Endocrinol Metab Clin North Am 39:347–353, 2010. [DOI] [PubMed] [Google Scholar]
- 11. Holick MF, Chen TC, Lu Z, Sauter E: Vitamin D and skin physiology: a D-lightful story. J Bone Miner Res 22(Suppl 2):V28–V33, 2007. [DOI] [PubMed] [Google Scholar]
- 12. Kasahara AK, Singh RJ, Noymer A: Vitamin D (25OHD) serum seasonality in the United States. PLoS One 8:e65785, 2013. [DOI] [PMC free article] [PubMed] [Google Scholar]
- 13. Klenk J, Rapp K, Denkinger MD, Nagel G, Nikolaus T, Peter R, Koenig W, Bohm BO, Rothenbacher D: Seasonality of vitamin D status in older people in southern Germany: implications for assessment. Age Ageing 42:404–408, 2013. [DOI] [PubMed] [Google Scholar]
- 14. Macdonald HM: Contributions of sunlight and diet to vitamin D status. Calcif Tissue Int 92:163–176, 2013. [DOI] [PubMed] [Google Scholar]
- 15. Lucas RM, Norval M, Neale RE, Young AR, de Gruijl FR, Takizawa Y, van der Leun JC: The consequences for human health of stratospheric ozone depletion in association with other environmental factors. Photochem Photobiol Sci 14:53–87, 2015. [DOI] [PubMed] [Google Scholar]
- 16. Engelsen O, Brustad M, Aksnes L, Lund E: Daily duration of vitamin D synthesis in human skin with relation to latitude, total ozone, altitude, ground cover, aerosols and cloud thickness. Photochem Photobiol 81:1287–1290, 2005. [DOI] [PubMed] [Google Scholar]
- 17. Farrar MD, Kift R, Felton SJ, Berry JL, Durkin MT, Allan D, Vail A, Webb AR, Rhodes LE: Recommended summer sunlight exposure amounts fail to produce sufficient vitamin D status in UK adults of South Asian origin. Am J Clin Nutr 94:1219–1224, 2011. [DOI] [PubMed] [Google Scholar]
- 18. Heaney RP, Davies KM, Chen TC, Holick MF, Barger-Lux MJ: Human serum 25-hydroxycholecalciferol response to extended oral dosing with cholecalciferol. Am J Clin Nutr 77:204–210, 2003. [DOI] [PubMed] [Google Scholar]
- 19. Dawson-Hughes B, Heaney RP, Holick MF, Lips P, Meunier PJ, Vieth R: Estimates of optimal vitamin D status. Osteoporos Int 16:713–716, 2005. [DOI] [PubMed] [Google Scholar]
- 20. Bischoff-Ferrari HA, Shao A, Dawson-Hughes B, Hathcock J, Giovannucci E, Willett WC: Benefit–risk assessment of vitamin D supplementation. Osteoporos Int 21:1121–1132, 2010. [DOI] [PMC free article] [PubMed] [Google Scholar]
- 21. Heaney RP: Assessing vitamin D status. Curr Opin Clin Nutr Metab Care 14:440–444, 2011. [DOI] [PubMed] [Google Scholar]
- 22. Gallagher JC, Sai A, Templin T II, Smith L: Dose response to vitamin D supplementation in postmenopausal women: a randomized trial. Ann Intern Med 156:425–437, 2012. [DOI] [PubMed] [Google Scholar]
- 23. Bouillon R, Van Schoor NM, Gielen E, Boonen S, Mathieu C, Vanderschueren D, Lips P: Optimal vitamin D status: a critical analysis on the basis of evidence-based medicine. J Clin Endocrinol Metab 98:E1283–E1304, 2013. [DOI] [PubMed] [Google Scholar]
- 24. Gallagher JC, Yalamanchili V, Smith LM: The effect of vitamin D supplementation on serum 25(OH)D in thin and obese women. J Steroid Biochem Mol Biol 136:195–200, 2013. [DOI] [PMC free article] [PubMed] [Google Scholar]
- 25. Mazahery H, von Hurst PR: Factors affecting 25-hydroxyvitamin D concentration in response to vitamin D supplementation. Nutrients. 7:5111–5142, 2015. [DOI] [PMC free article] [PubMed] [Google Scholar]
- 26. Sollid ST, Hutchinson MY, Fuskevag OM, Joakimsen RM, Jorde R: Large individual differences in serum 25-hydroxyvitamin D response to vitamin D supplementation: effects of genetic factors, body mass index, and baseline concentration. Results from a randomized controlled trial. Horm Metab Res 48:27–34, 2016. [DOI] [PubMed] [Google Scholar]
- 27. Rees JR, Mott LA, Barry EL, Baron JA, Bostick RM, Figueiredo JC, Bresalier RS, Robertson DJ, Peacock JL: Lifestyle and other factors explain one-half of the variability in the serum 25-hydroxyvitamin D response to cholecalciferol supplementation in healthy adults. J Nutr 146:2312–2324, 2016. [DOI] [PMC free article] [PubMed] [Google Scholar]
- 28. Garabedian M, Menn S, Walrant-Debray O, Teinturier C, Delaveyne R, Roden A: Prevention of child and adolescent vitamin D deficiency. II. Validation of a decision-making abacus based on sun exposure and vitamin D intakes. Arch Pediatr 12:410–419, 2005. [DOI] [PubMed] [Google Scholar]
- 29. Viljakainen HT, Palssa A, Karkkainen M, Jakobsen J, Lamberg-Allardt C: How much vitamin D3 do the elderly need? J Am Coll Nutr 25:429–435, 2006. [DOI] [PubMed] [Google Scholar]
- 30. Black LJ, Seamans KM, Cashman KD, Kiely M: An updated systematic review and meta-analysis of the efficacy of vitamin D food fortification. J Nutr 142:1102–1108, 2012. [DOI] [PubMed] [Google Scholar]
- 31. Bikle DD: Vitamin D metabolism, mechanism of action, and clinical applications. Chem Biol 21:319–329, 2014. [DOI] [PMC free article] [PubMed] [Google Scholar]
- 32. Tang JCY, Nicholls H, Piec I, Washbourne CJ, Dutton JJ, Jackson S, Greeves J, Fraser WD: Reference intervals for serum 24,25-dihydroxyvitamin D and the ratio with 25-hydroxyvitamin D established using a newly developed LC-MS/MS method. J Nutr Biochem 46:21–29, 2017. [DOI] [PubMed] [Google Scholar]
- 33. Zhou R, Chun RF, Lisse TS, Garcia AJ, Xu J, Adams JS, Hewison M: Vitamin D and alternative splicing of RNA. J Steroid Biochem Mol Biol 148:310–317, 2015. [DOI] [PMC free article] [PubMed] [Google Scholar]
- 34. McKenna MJ, Murray BF: Vitamin D dose response is underestimated by Endocrine Society's Clinical Practice Guideline. Endocr Connect 2:87–95, 2013. [DOI] [PMC free article] [PubMed] [Google Scholar]
- 35. Lips P, van Shoor NM, Bravenhoer N: Vitamin D–related disorders. In Rosen CJ, Compston JE, Lian JB (eds): “Primer on the Metabolic Bone Diseases and Disorders of Mineral Metabolism,” 7th The American Society for Bone and Mineral Research, 329–335, 2009. [Google Scholar]
- 36. Whiting SJ, Kohrt WM, Warren MP, Kraenzlin MI, Bonjour JP: Food fortification for bone health in adulthood: a scoping review. Eur J Clin Nutr 70:1099–1105, 2016. [DOI] [PMC free article] [PubMed] [Google Scholar]
- 37. Rossini M, Bianchi G, Di Munno O, Giannini S, Minisola S, Sinigaglia L, Adami S: Determinants of adherence to osteoporosis treatment in clinical practice. Osteoporos Int 17:914–921, 2006. [DOI] [PubMed] [Google Scholar]
- 38. Sanders KM, Stuart AL, Williamson EJ, Simpson JA, Kotowicz MA, Young D, Nicholson GC: Annual high-dose oral vitamin D and falls and fractures in older women: a randomized controlled trial. JAMA 303:1815–1822, 2010. [DOI] [PubMed] [Google Scholar]
- 39. Rosen CJ, Abrams SA, Aloia JF, Brannon PM, Clinton SK, Durazo-Arvizu RA, Gallagher JC, Gallo RL, Jones G, Kovacs CS, et al.: IOM committee members respond to Endocrine Society vitamin D guideline. J Clin Endocrinol Metab 97:1146–1152, 2012. [DOI] [PMC free article] [PubMed] [Google Scholar]
- 40. Cashman KD, Kiely M: Tackling inadequate vitamin D intakes within the population: fortification of dairy products with vitamin D may not be enough. Endocrine 51:38–46, 2016. [DOI] [PubMed] [Google Scholar]
- 41. Ginde AA, Scragg R, Schwartz RS, Camargo CA Jr: Prospective study of serum 25-hydroxyvitamin D level, cardiovascular disease mortality, and all-cause mortality in older U.S. adults. J Am Geriatr Soc 57:1595–1603, 2009. [DOI] [PubMed] [Google Scholar]
- 42. Zittermann A, Iodice S, Pilz S, Grant WB, Bagnardi V, Gandini S: Vitamin D deficiency and mortality risk in the general population: a meta-analysis of prospective cohort studies. Am J Clin Nutr 95:91–100, 2012. [DOI] [PubMed] [Google Scholar]
- 43. Garland CF, Kim JJ, Mohr SB, Gorham ED, Grant WB, Giovannucci EL, Baggerly L, Hofflich H, Ramsdell JW, Zeng K, et al.: Meta-analysis of all-cause mortality according to serum 25-hydroxyvitamin D. Am J Public Health 104:e43–e50, 2014. [DOI] [PMC free article] [PubMed] [Google Scholar]
- 44. Tomson J, Emberson J, Hill M, Gordon A, Armitage J, Shipley M, Collins R, Clarke R: Vitamin D and risk of death from vascular and non-vascular causes in the Whitehall study and meta-analyses of 12,000 deaths. Eur Heart J 34:1365–1374, 2013. [DOI] [PubMed] [Google Scholar]
- 45. Clarke R, Newman C, Tomson J, Hin H, Kurien R, Cox J, Lay M, Sayer J, Hill M, Emberson J, et al.: Estimation of the optimum dose of vitamin D for disease prevention in older people: rationale, design and baseline characteristics of the BEST-D trial. Maturitas 80:426–431, 2015. [DOI] [PMC free article] [PubMed] [Google Scholar]
- 46. Hin H, Tomson J, Newman C, Kurien R, Lay M, Cox J, Sayer J, Hill M, Emberson J, Armitage J, et al.: Optimum dose of vitamin D for disease prevention in older people: BEST-D trial of vitamin D in primary care. Osteoporos Int 28:841–851, 2017. [DOI] [PMC free article] [PubMed] [Google Scholar]