

Abstract

High sensitivity imaging tools could provide a more holistic view of target antigen expression to improve the identification of patients who might benefit from cancer immunotherapy. We developed for immunoPET a novel recombinant human IgG1 (termed C4) that potently binds an extracellular epitope on human and mouse PD-L1 and radiolabeled the antibody with zirconium-89. Small animal PET/CT studies showed that 89Zr-C4 detected antigen levels on a patient derived xenograft (PDX) established from a non-small-cell lung cancer (NSCLC) patient before an 8-month response to anti-PD-1 and anti-CTLA4 therapy. Importantly, the concentration of antigen is beneath the detection limit of previously developed anti-PD-L1 radiotracers, including radiolabeled atezolizumab. We also show that 89Zr-C4 can specifically detect antigen in human NSCLC and prostate cancer models endogenously expressing a broad range of PD-L1. 89Zr-C4 detects mouse PD-L1 expression changes in immunocompetent mice, suggesting that endogenous PD-1/2 will not confound human imaging. Lastly, we found that 89Zr-C4 could detect acute changes in tumor expression of PD-L1 due to standard of care chemotherapies. In summary, we present evidence that low levels of PD-L1 in clinically relevant cancer models can be imaged with immunoPET using a novel recombinant human antibody.
Introduction
The recent clinical success of inhibitors of immune checkpoint proteins (e.g., CTLA-4, PD-1, PD-L1) has stimulated deserved enthusiasm for cancer immunotherapy.1,2 Since this milestone, there is now an urgent need to develop translational biomarkers to understand which patients will be most likely to respond to immunotherapy and distinguish responsive tumors from treatment refractory disease early after therapy initiation.2
The clinical experience with anti-PDL1 and PD-1 therapies underscores the urgency to develop better translational biomarkers to more effectively implement immunotherapies. For example, there is compelling evidence that a tissue-based biomarker is crucial to identifying potential responders, as a recent retrospective analysis of clinical data enrolled in trials with nivolumab, pembrolizumab, and MPDL3280A (atezolizumab) showed that the overall response rate was significantly higher in melanoma and NSCLC patients with PD-L1 positive tumors compared to those scored as negative.3 That said, while the community understands that PD-L1 expression in the tumor microenvironment is likely a prerequisite for response, there is very little consensus beyond this consideration.4−6 One example of an open question is the threshold of PD-L1 positive cells required in a tumor biopsy to confer a response. Multiple clinical trial sponsors have set different thresholds for the percentage of PD-L1 positive cells in a biopsy as inclusion criteria, ranging from very low percentages (e.g., >5%) to higher percentages (e.g., >50%) of cells in the sample.4 Adding to the confusion, different antibodies recognizing discrete epitopes on PD-L1 have been used in immunohistochemical assays of biopsied tissue. Overall, the lack of a gold standard assay for patient recruitment has made it challenging to interpret the role of PD-L1 tumor expression in patient outcome.
Immunotherapies are currently administered to patients with advanced metastatic cancer, and this also calls into question whether a tumor biopsy alone is ideal to characterize PD-L1 status in the tumor microenvironment. Indeed, there are many examples of patients whose biopsies are scored as “PD-L1 positive” yet do not experience clinical responses. This raises the possibility that biopsy at single site may not reflect the molecular character of the majority of metastases in the patient. Moreover, if PD-L1 status is determined from archival tissue, the patient’s tumor may have evolved to change PD-L1 expression over time, a well-documented observation in preclinical models that may impact clinical responses to immunotherapies.7−9
These considerations have led several groups to propose that a translational molecular imaging tool to study PD-L1 expression could improve how we treat and monitor patients with anti-PD-1/PD-L1 therapies.10 Five prior reports have described preclinical assessments of radiolabeled anti-PD-L1 antibodies for imaging using commercial, nonhumanized antibodies, or atezolizumab. While these reports arrived at the conclusion that cancer models overexpressing human or mouse PD-L1 can be imaged with a potent and selective radiolabeled antibody, it is an entirely open question as to whether tumor types responsive to anti-PD1/PD-L1 therapy express sufficient antigen to be detected with immunoPET. Moreover, the prior radiotracer development efforts with FDA approved IgG atezolizumab suggest it is not an ideal tool for nuclear imaging.11,12 Most importantly, radiolabeling the antibody with copper-64 resulted in a fairly low immunoreactive fraction (∼75%) and high background in PD-L1 null mouse and human tissues (∼10% ID/g). On this basis, we campaigned for a new recombinant human antibody to the ectodomain of PD-L1 and proposed to evaluate whether the PD-L1 levels in tumor tissues derived from a true responder to anti-PD-1 therapy could be detected with immunoPET.
Results and Discussion
Development and Characterization of C4, a Human Recombinant Antibody against an Extracellular Epitope on Human and Mouse PD-L1
Anti-PD-L1 antibodies were isolated from a 3 × 10¹⁰ diversity Fab phage display library.13 Following 3 rounds of biopanning against the biotinylated ectodomain of the human PD-L1, 27 antigen-positive Fabs of unique sequences were identified after screening 249 clones. Of these positive binders, clone C4 was found to cross-react with both human and mouse PD-L1 proteins by ELISA, which share 73% protein sequence identity within the extracellular domain. C4 was further evaluated for its ability to recognize full length PD-L1 expressed on cell surface. Using flow cytometry, we show that C4 binds to both human and mouse PD-L1-expressing cells in a dose-dependent manner, with only a slight difference in its EC50 (Table 1).
Table 1. Summary of the Relative Affinity and Binding Constants for C4 and DFO-C4 against Human and Mouse PD-L1a.
| Ab | antigen source | species | vendor | EC50 (nM) | Kd (nM) |
|---|---|---|---|---|---|
| C4 | HEK293-6E | human | N/A | 0.31 | |
| HEK293-6E | mouse | N/A | 5.06 | ||
| RP | human | R&D | 4.2 ± 0.7 | ||
| RP | mouse | R&D | ND | ||
| RP | human | SBI | 1.5 ± 0.34 | ||
| RP | mouse | SBI | 360 ± 63 | ||
| PC3 | human | N/A | 6.6 | ||
| B16F10 | mouse | N/A | 5.5 | ||
| DFO-C4 | PC3 | human | N/A | 9.9 | |
| B16F10 | mouse | N/A | 5.2 |
The first two rows of data represent the EC50 data obtained from the initial characterization of the C4 clone using a flow cytometry assay with PE-conjugated C4. The clone was screened against HEK293-6E cells stably overexpressing full length human or mouse PD-L1. The next four rows of data report the Kd values obtained using two different commercial sources of recombinant, purified human or mouse PD-L1. The last four rows show the EC50 data for C4 and DFO-C4 derived from a competition binding assay on PC3 or B16F10 cells. Abbreviations: RP = recombinant protein, SBI = Sino Biological, Inc., N/A = not applicable, ND = not detected.
We next tested binding of C4 to recombinant, purified human and mouse PD-L1 from R&D and Sino Biological Inc. C4 antibody binds to human PD-L1 from R&D and Sino Biological Inc. with a Kd in the low nanomolar range (4.2 ± 0.7 nM and 1.5 ± 0.34 nM, respectively). C4 binds weakly to mouse PD-L1 from Sino Biological Inc. (360 ± 63 nM) but does not bind to mouse PD-L1 from R&D even at high concentrations (4 μM). These findings may indicate that mouse PD-L1 may harbor features on cells required for C4 binding that are not present on recombinant antigen.
Radiolabeling and in Vitro Pharmacological Assessment of C4 IgG
Desferrioxamine B (DFO) is a well-established potent chelator of zirconium-89 and has been used to append 89Zr to antibodies for both animal and human studies.14 On this basis, we conjugated DFO to C4 by reacting commercial N-succinimidyl DFO with solvent exposed lysines. An analysis of chelate number showed that there was approximately 1 DFO per antibody (Supporting Information Figure 1). We next tested whether DFO impacted the affinity and immunoreactivity of C4. Competition binding assays on B16F10 and PC3 cells showed virtually no change in the binding of C4 for mouse and human PD-L1, respectively (Table 1). The immunoreactive fraction of 89Zr-C4 was assayed using PC3 cells, and ∼93% of the radiolabeled lot was immunoreactive for PD-L1 (Supporting Information Figure 2). Lastly, the stability of 89Zr-C4 was measured in serum and was determined to be >98% over 5 days in mouse serum, making it suitable for in vivo use (Supporting Information Figure 3).
89Zr-C4 Specifically Binds Mouse and Human PD-L1 in Vivo
To establish whether 89Zr-C4 can detect human and mouse PD-L1 expression in vivo, male nu/nu mice bearing H1975 xenografts (a PD-L1 positive model of human non-small-cell lung cancer bearing oncogenic EGFR L858R/T790M) were injected with the radiotracer via the tail vein. The biodistribution of 89Zr-C4 was monitored over time with small animal PET/CT (Figure 1A). Analysis of the imaging data suggested that peak radiotracer accumulation was observed at 48 h after injection. Biodistribution studies at 8, 24, 48, 72, and 120 h after injection confirmed that the highest tumor uptake was observed at 48 h (Figure 1B and Supporting Information Figure 4). Moreover, radiotracer uptake in the tumor exceeded that of blood pool and muscle, suggesting it to be receptor mediated uptake and not nonspecific uptake due to the enhanced permeability and retention effect. Lastly, bone uptake was low and did not increase over time, supportive of the stability of 89Zr-C4 in vivo (free Zr4+ salts can have tropism to the bone). To confirm PD-L1 specific uptake in tissues, a separate mouse cohort received 89Zr-C4 or 89Zr-C4 with 30-fold excess C4. Clear evidence of in vivo blocking in the tumor tissue was observed 48 h after injection by PET and biodistribution (Figure 1C; see Supporting Information Figure 5).
Figure 1.

Defining the optimal time after injection to study PD-L1 expression levels in a xenograft model. (A) Representative coronal and transaxial PET/CT images of male nu/nu mice bearing subcutaneous H1975 tumors, a human model of NSCLC , show that peak tumor uptake of 89Zr-C4 occurs 48 h after injection. (B) Biodistribution data also show peak tumor uptake of the radiotracer 48 h after injection. High uptake is also observed in PD-L1 positive tissues like the liver a spleen. (C) Representative data from a blocking study acquired 48 h after injection show the tumor specific uptake of 89Zr-C4. Blocking was performed with 30-fold excess C4. Radiotracer uptake exceeded that observed in the blood pool and muscle: (∗) P < 0.01.
89Zr-C4 Detects PD-L1 Expression in a Patient Derived Xenograft from an Individual That Responded Durably to Anti-PD-L1 Therapy
Using the conditions defined in the study of H1975 tumors, we next tested whether 89Zr-C4 can detect PD-L1 expression on a PDX model of EGFR mutant (L858R) NSCLC that was isolated at UCSF in 2014.15 The PDX was established 7 months prior to the individual beginning treatment with pembrolizumab plus ipilimumab. The patient experienced a confirmed partial response detected by CT that lasted for 8 months (Figure 2A). Immunofluorescence of tissue sections showed that the tumor tissue expresses PD-L1 (Supporting Information Figure 6). Three mice bearing bilateral subcutaneous PDXs were injected with radiotracer and imaged serially out to 48 h. PET/CT showed that 89Zr-C4 clearly resolved the tumors (Figure 2B). Moreover, there was no visible accumulation of heat denatured 89Zr-C4 in the tumors from a separate mouse cohort (Figure 2B), suggesting that the tumor accumulation of 89Zr-C4 is receptor mediated. Biodistribution data showed that tumor uptake of 89Zr-C4 was ∼5% ID/g and also ∼10-fold higher than the tumor associated activity detected in mice treated with heat denatured 89Zr-C4 (Figure 2C and Supporting Information Figure 7). Moreover, the amount of 89Zr-C4 in the tumor was higher than the activity observed in blood pool, muscle, and bone, underscoring that uptake is due to specific receptor binding, and the radiotracer is stable in vivo.
Figure 2.
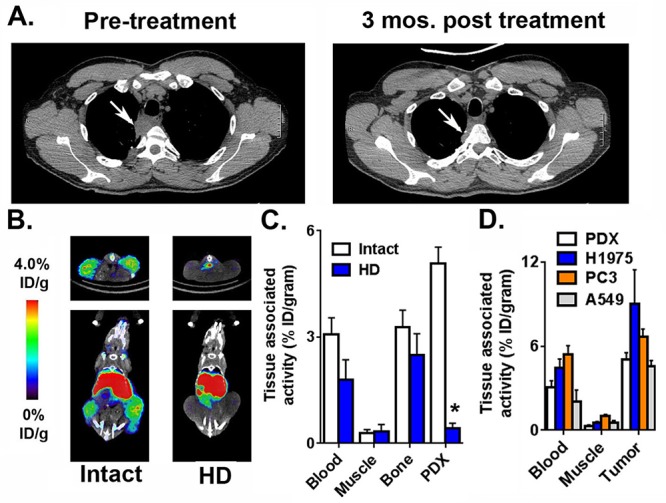
89Zr-C4 detects PD-L1 expression levels in a PDX derived from a NSCLC patient that experienced a durable clinical response to anti-PD-1 and anti-CTLA4 therapies. (A) Transaxial CT slices showing a soft tissue lesion in the lung prior to the initiation of pembrolizumab and ipilimumab (left), and a smaller mass 3 months after the start of therapy (right). The position of the tumor is indicated with a white arrow. This patient experienced a partial response for 8 months. The PDX was derived 7 months prior to the first CT scan. (B) Small animal PET/CT data showing the biodistribution of 89Zr-C4 in mice bearing bilateral PDX tumors in the flank. The tumors can be clearly resolved, and radiotracer uptake in abdominal tissues like the liver is observed, as expected for a large biomolecule. Mice treated with 89Zr-C4 that was heat denatured (HD) for 10 min prior to injection show no evidence of radiotracer uptake in the tumor. (C) Biodistribution data showing the uptake of 89Zr-C4 in the PDX tissue 48 h after injection. The uptake is higher in the tumor compared to heat denatured 89Zr-C4 (HD) and standard reference tissues like the blood and muscle. (D) Biodistribution data acquired 48 h after injection in mice bearing subcutaneous H1975, PC3, A549, and the PDX tumors show the different degree of 89Zr-C4 uptake in the tumors.
We tested specific binding of 89Zr-C4 in PC3 and A549 xenografts, two human models of prostate cancer and NSCLC that we determined expressed less PD-L1 compared to H1975 using a saturation binding assay (Supporting Information Figure 8). Biodistribution studies performed 48 h after injection showed radiotracer accumulation in the PC3 and A549 xenografts to be ∼7% ID/g and 5% ID/g, respectively (Figure 2D). In each case, a blocking study was performed and confirmed that the tumor uptake was receptor-mediated (Supporting Information Figures 9 and 10).
89Zr-C4 Detects Tumor Associated PD-L1 Expression in Immunocompetent Mice with Endogenous PD-1
To be useful clinically, a radiotracer targeting PD-L1 must be capable of competing with PD-1 antigen in the tumor microenvironment. To assess whether 89Zr-C4 can detect mouse PD-L1 in an immunocompetent background, C57 BL/6J mice were inoculated in the flank with the PD-L1 positive mouse melanoma cell line B16 F10. Tumor bearing mice were treated with 89Zr-C4 and imaged with PET/CT serially for 5 days (Figure 3A). As with the H1975 study, visual inspection of the normalized PET slices showed peak tumor uptake at 48 h after injection. Biodistribution data confirmed this trend in the tumor associated activity (Figure 3B and Supporting Information Figure 11). Significant accumulation of 89Zr-C4 was also detected in liver and the spleen, consistent with data reported for other radiotracers targeting PD-L1 (∼7% ID/g and ∼6% ID/g, respectively, 48 h after injection). 89Zr-C4 uptake was visibly suppressed in the tumor and some normal tissues (liver, spleen) at 48 h after injection with a co-injection of 10-fold molar excess unlabeled C4 (Figure 3C). Biodistribution data also showed tumor uptake was suppressed by cold C4, as was uptake in the liver and spleen (Figure 3D and Supporting Information Figure 12).
Figure 3.

89Zr-C4 can specifically detect mouse PD-L1 in tumors established in an immunocompetent background. (A) Representative coronal and transaxial PET/CT images of male C57BL/6 mice bearing subcutaneous B16 F10 tumors, a mouse model of melanoma, show that peak tumor uptake of 89Zr-C4 occurs 48 h after injection. (B) Biodistribution data also show peak tumor uptake of the radiotracer 48 h after injection. High uptake is also observed in PD-L1 positive tissues like the liver a spleen. (C) Representative data from a blocking study acquired 48 h after injection show the tumor specific uptake of 89Zr-C4. Blocking was performed with 10-fold excess C4. Radiotracer uptake exceeded that observed in the blood pool and muscle: (∗) P < 0.01.
Pharmacologically Induced Changes in PD-L1 Expression with Standard of Care Chemotherapies Can Be Quantified with 89Zr-C4 ImmunoPET
Numerous reports have disclosed that standard of care chemotherapy or radiation therapy commonly administered prior to anti-PD1/PD-L1 therapies can impact PD-L1 expression in the tumor microenvironment.8,16,17 This observation has clear clinical significance, as a standard treatment course could alter the PD-L1 status of a patient’s tumor compared to an archival biopsy that might be used to qualify a patient for immunotherapy. On this basis, we tested whether 89Zr-C4 PET can measure treatment induced changes in PD-L1 expression over time.
We first established on H1975 and B16 F10 cells that 48 h of exposure to paclitaxel (Taxol) and doxorubicin induced and repressed PD-L1 transcription and cell surface expression, respectively, as expected (Supporting Information Figures 13 and 14). We next tested whether these expression changes were sufficiently large to be quantified with 89Zr-C4 in vivo. A cohort of nu/nu mice bearing subcutaneous H1975 tumors was treated with vehicle, paclitaxel (20 mg/kg), or doxorubicin (2 mg/kg) for 3 days. At day 3, 89Zr-C4 was administered via tail vein, and treatment with vehicle or drug was continued for 2 days while the radiotracer was distributed. PET/CT and biodistribution studies revealed that 89Zr-C4 was substantially higher in the tumors of mice treated with paclitaxel compared to the other treatment arms, while 89Zr-C4 was significantly lower in tumors from mice treated with doxorubicin (Figure 4A and Figure 4B). There were no substantial differences in the biodistribution of 89Zr-C4 in normal tissues, with the exception of increased uptake in the spleens of nu/nu mice treated with paclitaxel (Supporting Information Figure 15). An additional cohort of C57BL/6 mice bearing subcutaneous B16 F10 tumors was treated using the same schema. While doxorubicin had limited effect on 89Zr-C4 uptake in the tumor, paclitaxel increased radiotracer uptake in the tumor (Figure 4C and Figure 4D; see Supporting Information Figure 16). Region of interest analysis also showed that the increase in tumor accumulation of 89Zr-C4 was statistically significant (Supporting Information Figure 17).
Figure 4.

89Zr-C4 can detect pharmacologically induced PD-L1 expression changes on the tumor cell. (A) Representative coronal and transverse PET images showing the distribution of 89Zr-C4 48 h after injection in a cohort of male nu/nu mice bearing subcutaneous H1975 xenografts and treated with vehicle, paclitaxel (Taxol), or doxorubicine. The mice were treated with 20 mg/kg paclitaxel or 2 mg/kg doxorubicine for 2 days prior to radiotracer injection. (B) Representative biodistribution data in the tumor and selected normal tissues showing that paclitaxel increases tumor PD-L1 expression levels, while doxorubicin suppresses it compared to vehicle. No impact was observed on PD-L1 expressing normal tissues like liver and spleen. (∗) P < 0.01; (#) P < 0.05. (C) Representative coronal and transverse PET images showing the distribution of 89Zr-C4 48 h after injection in a cohort of male C57BL/6 mice bearing subcutaneous B16 F10 xenografts and treated with vehicle, paclitaxel, or doxorubicine. The mice were treated with 20 mg/kg paclitaxel or 2 mg/kg doxorubicine for 2 days prior to radiotracer injection. (D) Representative biodistribution data in the tumor and selected normal tissues showing that paclitaxel increases tumor PD-L1 expression levels, while doxorubicin had no impact compared to vehicle. PD-L1 expression was upregulated in the spleen of mice treated with doxorubicin: (∗) P < 0.01.
Of the four previously described radiolabeled anti-PD-L1 antibodies, three are neither human nor humanized, which substantially diminishes the likelihood of near term clinical translation.18−20 One humanized antibody, atezolizumab, has been labeled and studied in animals.11,12 While the authors initially labeled the antibody with indium-111 for SPECT and a near-infrared dye, two imaging approaches that are far more challenging to quantify compared to PET, they have more recently disclosed data showing tumors can be detected with 64Cu-labeled antibody and PET. One aspect of the study with 64Cu-atezolizumab perhaps deserving more careful review is the high background of the radiotracer. Indeed, the authors reported ∼10% ID/g in several tumors known to be PD-L1 null. This value exceeds the specific accumulation of 89Zr-C4 in several tumor models we have shown to be PD-L1 positive, including the clinically relevant NSCLC PDX. Moreover, it exceeds the threshold for the enhanced permeability and retention effect, assigned to be ~3–4% ID/g for biomolecules.21 Blood pool values of 64Cu-atezolizumab were also quite high at late time points after injection (∼10% ID/g at 48 h), something we did not observe with 89Zr-C4 despite both being large immunoglobulins. Lastly, all of the prior studies utilized cell lines that overexpress PD-L1 endogenously or via stable genetic engineering, and among the breast cancer cell lines with endogenous overexpression, there was no evidence provided of response to anti-PD-1/PD-L1 therapies which unfortunately makes it challenging to contextualize the clinical significance of the imaging data.
Conclusions
In this manuscript, we developed and studied a new 89Zr-labeled recombinant human antibody to measure PD-L1 expression levels in vivo with immunoPET. The IgG1 C4 has low nM affinity for human PD-L1, an immunoreactive fraction of >90%, and radiolabeling the antibody did not compromise either feature. Importantly, we showed for the first time that a PDX derived from a NSCLC patient responsive to anti-PD-1 therapies expressed sufficient levels of PD-L1 to be imaged with a high quality PET radiotracer. 89Zr-C4 also specifically detected low endogenous levels of PD-L1 on a prostate cancer and NSCLC xenograft. Specific radiotracer binding to PD-L1 within melanoma tumors was observed in immunocompetent mice, suggesting that PD-1/2 positive cells in the tumor microenvironment will not preclude tumor imaging in patients. Lastly, acute changes in PD-L1 expression on the tumor cell due to standard chemotherapies were also detectable with immunoPET, underscoring the potential utility of serial imaging to measure clinically relevant expression changes over time. These data generally support that imaging PD-L1 expression may be feasible in clinical disease with 89Zr-C4.
Because we now understand that patients with as little as 5% of antigen positive cells on biopsy can experience a response to cancer immunotherapy, imaging tools with high specificity and low background in antigen-negative tissues are essential. We are optimistic that the data reported herein with 89Zr-C4 will stimulate enthusiasm for translating this tool to the clinic for assessment of PD-L1 expression in the tumor microenvironment. Importantly, the human nature of the C4 immunoglobulin precludes the need for an expensive and time consuming humanization process, which can also reduce affinity for the antigen.
Materials and Methods
General Methods
B16 F10, H1975, A549, and PC3 cells were acquired from ATCC and subcultured according to manufacturer’s recommendations. Paclitaxel (Taxol) and doxorubicin were purchased from Sigma-Aldrich and solubilized with DMSO for in vitro studies. N-Succinimidyl-DFO was obtained from Macrocyclics (Dallas, TX) and used without further purification. Zirconium-89 was purchased from 3D Imaging, LLC (Maumelle, AR). Iodine-125 was purchased from PerkinElmer.
Antibody Generation and Characterization
The protocols for biopanning, phage amplification, ELISA screening, Fab and IgG expression and purification, as well as affinity/specificity characterization of the isolated antibody clone C4, closely followed a previous publication.13 Briefly, biopanning was performed using human PD-L1 (Sino Biological) biotinylated by the EZ-Link NHS-PEG4-biotin labeling kit (Pierce). In the first two rounds of biopanning, PD-L1 was immobilized on M280 streptavidin-coated magnetic beads (Life Technologies); in the third round, biotinylated PD-L1 was immobilized on the neutravidin-coated microplate in order to avoid isolation of streptavidin magnetic beads binders. 1013 cfu phage in 1 mL of casein-PBS blocking buffer was used in the first round, and 1011 cfu phage was used in the second and third rounds. Binding was performed for 1 h at room temperature, and the beads or wells were washed with PBS, 0.1% Tween-20. Concentrations of PD-L1 used for biopanning were 100 nM, 20 nM, and 0.2 μg/mL, and the number of washes were 5, 10, and 25 times in rounds 1, 2, and 3, respectively. Bound phage were eluted by 0.1 M triethylamine for 10 min followed by addition of one-half volume of 1 M Tris-HCl, pH 8. Eluted phage were subsequently amplified according to previously described protocols.22 After three rounds of biopanning, the Fab of selected clones was expressed in E. coli TG1 cells (Stratagene) to screen for PD-L1 binders by ELISA. Unique clones were identified by DNA fingerprinting technique and confirmed by DNA sequencing. Fabs were reformatted into human IgG1 in the pTT5 vector, and the antibodies were expressed in HEK293-6E cells23 Both the vector and cells were obtained from National Research Council of Canada. Antibodies were purified from the culture supernatant using protein G resin (Merck Millipore) following standard protocols.
To characterize cell surface binding, suspension HEK6E cells were transfected with either human or mouse PD-L1 gene cloned in a CMV promoter-driven plasmid (Sino Biological, Beijing). 48 h later the cells were exposed to various concentration of C4 followed by a PE-labeled anti-human Fc-specific secondary antibody (Biolegend, San Diego, CA). Mock transfection of cells using the same plasmid lacking PD-L1 gene was used as a negative control. Binding of C4 to the cells was quantified by the geometric mean fluorescence intensity (MFI), and the half maximal effective concentration (EC50) was determined by the sigmoidal nonlinear regression equation.
Kinetic constants for C4 antibody against human and mouse PD-L1 (R&D and Sino Biological Inc.) were determined using an Octet RED384 instrument (ForteBio). Six concentrations of each antigen (250 nM, 125 nM, 62.5 nM, 31.25 nM, 15.625 nM, and 7.812 nM for human PD-L1 and 4 μM, 2 μM, 1 μM, 500 nM, 250 nM, and 125 nM for mouse PD-L1) were tested for binding to the C4 antibody immobilized on anti-human IgG Fc Capture biosensors (Fortebio). All measurements were performed at room temperature in 384-well microplates, and the running buffer was PBS with 0.5% (w/v) bovine serum albumin (BSA) and 0.05% (v/v) Tween 20.
C4 antibody was loaded for 180 s from a solution of 300 nM, baseline was equilibrated for 60 s, and then the antigens were associated for 600 s followed by 1200 s disassociation. Between each sample, the biosensor surfaces were regenerated three times by exposing them to 10 mM glycine, pH 1.5, for 5 s followed by PBS for 5 s. Data were analyzed using a 1:1 interaction model on the ForteBio data analysis software version 8.2.
Bioconjugation Chemistry
C4 (208 μL at a concentration of 9.6 mg/mL) was dispersed in 200 μL of 0.1 M sodium bicarbonate buffer (pH 9.0). The final reaction mixture was adjusted to a total volume of 0.5 mL by adding a sufficient amount of 0.1 M sodium bicarbonate buffer. p-Isothiocyanatobenzyldesferrioxamine (Df-Bz-NCS) was dissolved in DMSO at a concentration of 20 mM. Df-Bz-NCS solution was added to the antibody solution to give a 3.9 molar excess of the chelator over the molar amount of mAb. The Df-Bz-NCS was added dropwise and mixed rigorously during the addition. The concentration of DMSO was kept below 2% v/v to avoid any precipitation. After 30 min at 37 °C, the reaction mixture was purified with a PD-10 column using a gentisic acid mobile phase (5 mg/mL of gentisic acid in 0.25 M sodium acetate, pH 5.4–5.6). The pH of the eluted C4-DFO solution was adjusted to 7.0 and stored at −20 °C until time of use.
Determination of Relative Binding Affinity of DFO-C4
The binding of fixed concentration of a radioligand 125I-C4 (0.4 μM) was also measured at equilibrium on PC3 and B16F10 cells in the presence of an incrementally increasing series of concentrations of a DFO-C4 and naked C4 (a range of 10 μM to 1 pM). The cocktail was incubated at room temperature for 1 h. Following incubation, the cells were washed twice with ice cold PBS and retained for analysis (unbound fraction). The cells were lysed with 1 mL of 1 M NaOH and collected (cell associated fraction). The unbound and cell associated fractions were counted in a γ counter and expressed as a percentage of the total activity added per number of cells. The data were plotted, and the IC50 was determined using PRISM software.
Radiochemistry
A solution of 89Zr-oxalic acid (5 mCi; 10 μL) was neutralized with 2 M Na2CO3 (5 μL). After 3 min, 0.30 mL of 0.5 M HEPES (pH 7.1–7.3) and 0.5 mg of DFO-C4 (pH = 7) were added into the reaction vial. After incubation for 120 min at 37 °C, the reaction progress was monitored by iTLC using a 20 mM citric acid (pH 4.9–5.1) mobile phase. The decay corrected radiochemical yield was consistently >98.5%.
Iodination with iodine-125 was done in precoated iodination tubes (Pierce). 100 μg of C4 was dispersed in 100 μL of PBS solution and added to the precoated iodination tubes. In a separate 1.5 mL Eppendorf tube, a solution of 1 μL of HCl (0.2 M), 2.5 μL of phosphate buffer (0.5 M, pH = 8), and 10 μL of potassium iodide solution (1 mg/mL) was prepared. 1 mCi of iodine-125 was added into the Eppendorf and then added to the iodination tubes. After 15 min of reaction the solution was halted and purified via PD10 column using PBS as the mobile phase. The purity was assessed via iTLC and was consistently >98% pure.
Determination of Chelate Number
The number of DFO attached to the Ab was measured with a radiometric isotopic dilution assays. From a stock solution, aliquots of 89Zr oxalate (10 μL, 20 μCi, pH 7.7–7.9) were added to 12 solutions containing 1:2 serial dilutions of nonradioactive ZrCl4(aq) (100 μL fractions; 1000–0.5 pmol, pH 7.7). The mixture was vortexed for 30 s before adding 5 μL aliquots of C4 (5 mg/mL, 2.5 μg of mAb, sterile PBS). The reactions were incubated at room temperature for >2 h before quenching with DTPA (20 μL, 50 mM, pH 7.0). Control experiments confirmed that 89Zr complexation to DFO-conjugated proteins was complete in <2 h. The extent of complexation was assessed by iTLC and counting the activity at the baseline and solvent front. The fraction of 89Zr-radiolabeled protein (Ab) was plotted versus the amount of nonradioactive ZrCl4 added. The number of chelates was calculated by measuring the concentration of ZrCl4 at which only 50% of the protein was labeled, multiplying by a factor of 2, and then dividing by the moles of protein present in the reaction. Isotopic dilution assays revealed an average of 1.08 ± 0.3 accessible chelates per protein molecule for C4.
Immunoreactive Fraction
Five different dilutions of cells ranging from 0.5 to 10 million cells/mL were prepared in PBS solution containing BSA. 10 μCi of 89Zr-C4 was incubated for 1 h at room temperature in each cellular fraction. Following the incubation, the cell suspensions were washed twice with ice-cold PBS and centrifuged. The radioactivity associated with cell pellet (cell-bound activity) was determined by counting the tubes in a γ counter with corresponding standards and blanks (for nonspecific binding). The inverse of cell-bound radioactivity (total over bound) was plotted as a function of the inverse of cell concentration. The data were fitted to a linear fit according to a least-squares linear regression methods. The Y-intercept of the regression line represents the inverse of immunoreactive fraction.
Serum Stability Determination
In vitro stability of DFO-mAb was assessed in serum for up to 3 days. For the serum stability studies, 50 μCi 89Zr- DFO-mAb was added to 500 μL of 100% fetal bovine serum and the mixture was incubated at 37 °C. Aliquots were reserved at different time points: 1 h, 4 h, 24 h, 75 h, and 5 days and assessed by iTLC. Activity within the serum samples was resolved by iTLC, and each experiment was carried out in triplicate.
Saturation Binding Assay
The number of PD-L1 receptors per cells was determined by a saturation binding experiment performed in H1975, A549, and PC3 cells using 125I-C4. The amount of radioligand added was increased while maintaining a constant number of cells/receptors. The three saturation binding assays were done with a range of nine different concentrations between 0.65 and 120 nM of the radioligand. The nonspecific binding was determined at three different concentrations (0.65, 10, and 120 nM) by co-incubation of separate treatment arms with a 1000-fold excess over the KD of unlabeled C4. Cells were incubated at 4 °C for 1 h to achieve equilibrium. Following incubation, the cells were washed twice with ice cold PBS and retained for analysis (unbound fraction). The cells were lysed with 1 mL of 1 M NaOH and collected (bound fraction). The unbound and cell associated fractions were counted in a γ counter and expressed as a percentage of the total activity added per number of cells. Experiments were performed in triplicate. The specific binding was obtained by subtracting the nonspecific binding from total. The specific binding was plotted against the concentration of the radioligand. A Rosenthal plot was used to determine the Bmax with PRISM software.
Cellular Uptake Assays
Cells were seeded at a density of 4 × 10⁵ cells per well in 12-well plates and grown at 37 °C, 5% CO2 for 24 h. Cells were treated with vehicle or the indicated therapy for 24, 48, or 72 h. Doxorubucin was used at doses of 100 nM and 1 μM. Paclitaxel was used at 200 nM, 2 μM, and 20 μM. On the day of the experiment, cells were subjected to a PBS wash followed by incubation for 1 h at 37 °C, 5% CO2 in PBS with 125I-C4 (0.5 μCi). Following incubation, the cells were washed twice with ice cold PBS and retained for analysis (externalized fraction). The cells were lysed with 1 mL of 1 M NaOH and collected (cell associated fraction). The externalized and cell associated fractions were counted in a γ counter and expressed as a percentage of the total activity added per equal relative number of cells. Experiments were performed in triplicate. The cell associated activity was expressed as a % of total activity to which the cells were exposed. This value was further normalized to cell number to correct for treatment induced changes in cell viability (determined by treating and counting separate wells containing cells).
Small Animal PET/CT
Three- to five-week-old male nu/nu immunocompromised mice and immunocompetent C57BL/6 mice were purchased from Charles River. Nu/Nu mice were inoculated with 1 × 10⁶ H1975 or A549 cells subcutaneously into one flank in a 1:1 mixture (v/v) of PBS and Matrigel (Corning). Tumors were palpable within 8–14 days with H1975 and 14–21 days with A549 after injection. Three- to five-week-old male C57BL/6 mice (Charles River) were inoculated with 1 × 10⁶ B16F10 subcutaneously into one flank in the same mixture of Matrigel and PBS. Tumors were palpable within 3–5 days after injection. Tumor bearing mice (n = 5 per treatment arm) received between 50 and 300 μCi of solution in 100 μL saline solution volume intravenously using a custom mouse tail vein catheter with a 28-gauge needle and a 100–150 mm long polyethylene microtubing. ∼300 μCi was injected for the mice for imaging and ∼50 μCi for the mice for biodistribution. The mice were imaged on a dedicated small animal PET/CT scanner (Inveon, Siemens Healthcare, Malvern, PA). Mice were imaged at multiple time points after injection out to 5 days. Animals were scanned for 20 min for PET, and the CT acquisition was 10 min.
The co-registration between PET and CT images was obtained using the rigid transformation matrix from the manufacturer-provided scanner calibration procedure since the geometry between PET and CT remained constant for each of PET/CT scans using the combined PET/CT scanner. During the imaging procedure, animals were anesthetized with gas isoflurane at 2% concentration mixed with medical grade oxygen. The photon attenuation correction was performed for PET reconstruction using the co-registered CT-based attenuation map to ensure the quantitative accuracy of the reconstructed PET data.
Biodistribution Studies
Biodistribution studies were conducted to evaluate the uptake of 89Zr-C4 in mice bearing subcutaneous tumors. At the indicted time after radiotracer injection, animals were euthanized by CO2(g) asphyxiation, and 14 tissues (including the tumor) were removed, weighed, and counted on a γ-counter for accumulation of 89Zr radioactivity. The mass of 89Zr-C4 formulation injected into each animal was measured and used to determine the total number of counts per minute by comparison to a standard syringe of known activity and mass. The data were background- and decay-corrected, and the tissue uptake was expressed in units of percentage injected dose per gram of dry tissue (% ID/g).
Immunofluorescence
PDX tumors were harvested and snap-frozen in 2-methylbutane and stored at −80 °C. Serial sections (10 μm thickness) were collected using a cryostat (Leica CM3050). The slices were mounted on coated glass slides (Superfrost Ultra Plus, Thermo Scientific) and stored at −80 °C until assayed. Tumors sections were fixed with paraformaldehyde (4% v/v), blocked with bovine serum albumin (5% m/v) in Tween (0.5% m/v), and then incubated for 1 h at temperature room in a humidified chamber with a rabbit monoclonal primary antibody against PDL1 (E1L3N XP, rabbit mAb no. 13684, 1:500) or EGFR L858R (43B2, rabbit mAb no. 3197, cell signaling, 1/400). Then the sections were rinsed three times and incubated for 30 min at room temperature with a secondary anti-rabbit antibody (Alexa Fluor 488, 1:1000). Sections were mounted with ProLong gold antifade reagent containing 4′,6-diamidino-2-phenylindole (DAPI, Invitrogen). Slides were imaged using an AxioObserver Z1 microscope (Zeiss). The slides were counterstained with hematoxylin and eosin to show cellular morphology.
A mosaic acquisition with a magnification of 20× was performed covering entirely the tumors section using an AxioObserver Z1 microscope (Zeiss). The fusion of mosaic images was generated by AxioVision 4.6. A sequential acquisition of separate wavelength channels was used to avoid fluorescence crosstalk. Exposure times were set so that pixel brightness was never saturated and kept constant during the entire image acquisition and between different experiments.
Animal Therapy Studies
Tumor bearing mice were injected intraperitoneally with doxorubicin (Sigma, 2 mg/kg body weight; equivalent to a dose of 6.5 mg/m2 in patients). All mice were treated once per day for 6 days (4 days before the injection and 2 days following the radiotracer injection). Paclitaxel was suspended in HPMT solution (0.5% w/v hydroxypropylmethylcellulose dissolved in water plus 0.2% v/v Tween 80). Tumor bearing mice were treated once daily via oral gavage with paclitaxel (25 mg kg–1 d–1) for 6 days (4 days before the injection and 2 days following the radiotracer injection).
Statistical Analysis
Data were analyzed using the unpaired, two-tailed Student’s t-test. Differences at the 95% confidence level (P < 0.05) were considered to be statistically significant.
Acknowledgments
The authors acknowledge Dr. Youngho Seo and Sergio Wong of the Small Animal Imaging Core at UCSF for technical assistance. M.J.E. was supported by the 2013 David H. Koch Young Investigator Award from the Prostate Cancer Foundation, the National Institutes of Health (Grants R00CA172695, R01CA17661), a Department of Defense Idea Development Award (Grant PC140107), the UCSF Academic Senate, and GE Healthcare. C.T. was supported by a postdoctoral fellowship from the Department of Defense Prostate Cancer Research Program (Grant PC151060). C.S.C. and N.S. were supported by the National Cancer Institute (Grant P41CA196276). T.G.B. was supported by the National Cancer Institute (Grants DP2CA174497, R01CA169338) and the Pew-Stewart Trust. A.J.C. and L.F. were supported by a Prostate Cancer Foundation Challenge Award. Research from UCSF reported in this publication was supported in part by the National Cancer Institute of the National Institutes of Health under Award P30CA082103. The content is solely the responsibility of the authors and does not necessarily represent the official views of the National Institutes of Health. Research from Singapore Immunology Network in this publication was supported by the Category 3 Industrial Alignment Fund awarded by the Biomedical Research Council of A*STAR.
Supporting Information Available
The Supporting Information is available free of charge on the ACS Publications website at DOI: 10.1021/acs.bioconjchem.7b00631.
Additional experimental details; plots of determination of chelate number, immunoreactive fraction, biodistribution, saturation binding data, PCR data, cell surface binding, and region of interest analysis; ITLC traces; immunofluorescence results (PDF)
Author Contributions
∞ C.T. and H.L.J.O. made equal contributions.
The authors declare the following competing financial interest(s): Michael J. Evans received consulting fees and owns shares in ORIC Pharmaceuticals, Inc. Michael J. Evans received research support from GE Healthcare.
Supplementary Material
References
- Leach D. R.; Krummel M. F.; Allison J. P. (1996) Enhancement of antitumor immunity by CTLA-4 blockade. Science 271, 1734–6. 10.1126/science.271.5256.1734. [DOI] [PubMed] [Google Scholar]
- Schumacher T. N.; Kesmir C.; van Buuren M. M. (2015) Biomarkers in cancer immunotherapy. Cancer Cell 27, 12–4. 10.1016/j.ccell.2014.12.004. [DOI] [PubMed] [Google Scholar]
- Carbognin L.; Pilotto S.; Milella M.; Vaccaro V.; Brunelli M.; Calio A.; Cuppone F.; Sperduti I.; Giannarelli D.; Chilosi; et al. (2015) Differential Activity of Nivolumab, Pembrolizumab and MPDL3280A according to the Tumor Expression of Programmed Death-Ligand-1 (PD-L1): Sensitivity Analysis of Trials in Melanoma, Lung and Genitourinary Cancers. PLoS One 10, e0130142. 10.1371/journal.pone.0130142. [DOI] [PMC free article] [PubMed] [Google Scholar]
- Patel S. P.; Kurzrock R. (2015) PD-L1 Expression as a Predictive Biomarker in Cancer Immunotherapy. Mol. Cancer Ther. 14, 847–56. 10.1158/1535-7163.MCT-14-0983. [DOI] [PubMed] [Google Scholar]
- Herbst R. S.; Soria J. C.; Kowanetz M.; Fine G. D.; Hamid O.; Gordon M. S.; Sosman J. A.; McDermott D. F.; Powderly J. D.; Gettinger S. N.; et al. (2014) Predictive correlates of response to the anti-PD-L1 antibody MPDL3280A in cancer patients. Nature 515, 563–7. 10.1038/nature14011. [DOI] [PMC free article] [PubMed] [Google Scholar]
- Huang Y.; Zhang S. D.; McCrudden C.; Chan K. W.; Lin Y.; Kwok H. F. (2015) The prognostic significance of PD-L1 in bladder cancer. Oncol. Rep. 33, 3075–84. 10.3892/or.2015.3933. [DOI] [PubMed] [Google Scholar]
- Ghebeh H.; Lehe C.; Barhoush E.; Al-Romaih K.; Tulbah A.; Al-Alwan M.; Hendrayani S. F.; Manogaran P.; Alaiya A.; Al-Tweigeri T.; et al. (2010) Doxorubicin downregulates cell surface B7-H1 expression and upregulates its nuclear expression in breast cancer cells: role of B7-H1 as an anti-apoptotic molecule. Breast Cancer Res. 12, R48. 10.1186/bcr2605. [DOI] [PMC free article] [PubMed] [Google Scholar]
- Zhang P.; Su D. M.; Liang M.; Fu J. (2008) Chemopreventive agents induce programmed death-1-ligand 1 (PD-L1) surface expression in breast cancer cells and promote PD-L1-mediated T cell apoptosis. Mol. Immunol. 45, 1470–6. 10.1016/j.molimm.2007.08.013. [DOI] [PubMed] [Google Scholar]
- Peng J.; Hamanishi J.; Matsumura N.; Abiko K.; Murat K.; Baba T.; Yamaguchi K.; Horikawa N.; Hosoe Y.; Murphy S. K.; et al. (2015) Chemotherapy Induces Programmed Cell Death-Ligand 1 Overexpression via the Nuclear Factor-kappaB to Foster an Immunosuppressive Tumor Microenvironment in Ovarian Cancer. Cancer Res. 75, 5034–45. 10.1158/0008-5472.CAN-14-3098. [DOI] [PubMed] [Google Scholar]
- Ehlerding E. B.; England C. G.; McNeel D. G.; Cai W. (2016) Molecular Imaging of Immunotherapy Targets in Cancer. J. Nucl. Med. 57, 1487–1492. 10.2967/jnumed.116.177493. [DOI] [PMC free article] [PubMed] [Google Scholar]
- Lesniak W. G.; Chatterjee S.; Gabrielson M.; Lisok A.; Wharram B.; Pomper M. G.; Nimmagadda S. (2016) PD-L1 Detection in Tumors Using [(64)Cu]Atezolizumab with PET. Bioconjugate Chem. 27, 2103–10. 10.1021/acs.bioconjchem.6b00348. [DOI] [PMC free article] [PubMed] [Google Scholar]
- Chatterjee S.; Lesniak W. G.; Gabrielson M.; Lisok A.; Wharram B.; Sysa-Shah P.; Azad B. B.; Pomper M. G.; Nimmagadda S. (2016) A humanized antibody for imaging immune checkpoint ligand PD-L1 expression in tumors. Oncotarget 7, 10215–27. 10.18632/oncotarget.7143. [DOI] [PMC free article] [PubMed] [Google Scholar]
- Goh A. X.; Bertin-Maghit S.; Ping Yeo S.; Ho A. W.; Derks H.; Mortellaro A.; Wang C. I. (2014) A novel human anti-interleukin-1beta neutralizing monoclonal antibody showing in vivo efficacy. mAbs 6, 764–73. 10.4161/mabs.28614. [DOI] [PMC free article] [PubMed] [Google Scholar]
- Vosjan M. J.; Perk L. R.; Visser G. W.; Budde M.; Jurek P.; Kiefer G. E.; van Dongen G. A. (2010) Conjugation and radiolabeling of monoclonal antibodies with zirconium-89 for PET imaging using the bifunctional chelate p-isothiocyanatobenzyl-desferrioxamine. Nat. Protoc. 5, 739–43. 10.1038/nprot.2010.13. [DOI] [PubMed] [Google Scholar]
- Blakely C. M.; Pazarentzos E.; Olivas V.; Asthana S.; Yan J. J.; Tan I.; Hrustanovic G.; Chan E.; Lin L.; Neel D. S.; et al. (2015) NF-kappaB-activating complex engaged in response to EGFR oncogene inhibition drives tumor cell survival and residual disease in lung cancer. Cell Rep. 11, 98–110. 10.1016/j.celrep.2015.03.012. [DOI] [PMC free article] [PubMed] [Google Scholar]
- Deng L.; Liang H.; Burnette B.; Beckett M.; Darga T.; Weichselbaum R. R.; Fu Y. X. (2014) Irradiation and anti-PD-L1 treatment synergistically promote antitumor immunity in mice. J. Clin. Invest. 124, 687–95. 10.1172/JCI67313. [DOI] [PMC free article] [PubMed] [Google Scholar]
- Dovedi S. J.; Adlard A. L.; Lipowska-Bhalla G.; McKenna C.; Jones S.; Cheadle E. J.; Stratford I. J.; Poon E.; Morrow M.; Stewart R.; et al. (2014) Acquired resistance to fractionated radiotherapy can be overcome by concurrent PD-L1 blockade. Cancer Res. 74, 5458–68. 10.1158/0008-5472.CAN-14-1258. [DOI] [PubMed] [Google Scholar]
- Hettich M.; Braun F.; Bartholoma M. D.; Schirmbeck R.; Niedermann G. (2016) High-Resolution PET Imaging with Therapeutic Antibody-based PD-1/PD-L1 Checkpoint Tracers. Theranostics 6, 1629–40. 10.7150/thno.15253. [DOI] [PMC free article] [PubMed] [Google Scholar]
- Heskamp S.; Hobo W.; Molkenboer-Kuenen J. D.; Olive D.; Oyen W. J.; Dolstra H.; Boerman O. C. (2015) Noninvasive Imaging of Tumor PD-L1 Expression Using Radiolabeled Anti-PD-L1 Antibodies. Cancer Res. 75, 2928–36. 10.1158/0008-5472.CAN-14-3477. [DOI] [PubMed] [Google Scholar]
- Josefsson A.; Nedrow J. R.; Park S.; Banerjee S. R.; Rittenbach A.; Jammes F.; Tsui B.; Sgouros G. (2016) Imaging, Biodistribution, and Dosimetry of Radionuclide-Labeled PD-L1 Antibody in an Immunocompetent Mouse Model of Breast Cancer. Cancer Res. 76, 472–9. 10.1158/0008-5472.CAN-15-2141. [DOI] [PMC free article] [PubMed] [Google Scholar]
- Heneweer C.; Holland J. P.; Divilov V.; Carlin S.; Lewis J. S. (2011) Magnitude of enhanced permeability and retention effect in tumors with different phenotypes: 89Zr-albumin as a model system. J. Nucl. Med. 52, 625–33. 10.2967/jnumed.110.083998. [DOI] [PMC free article] [PubMed] [Google Scholar]
- de Haard H. J.; van Neer N.; Reurs A.; Hufton S. E.; Roovers R. C.; Henderikx P.; de Bruine A. P.; Arends J. W.; Hoogenboom H. R. (1999) A large non-immunized human Fab fragment phage library that permits rapid isolation and kinetic analysis of high affinity antibodies. J. Biol. Chem. 274, 18218–30. 10.1074/jbc.274.26.18218. [DOI] [PubMed] [Google Scholar]
- Durocher Y.; Perret S.; Kamen A. (2002) High-level and high-throughput recombinant protein production by transient transfection of suspension-growing human 293-EBNA1 cells. Nucleic Acids Res. 30, E9. [DOI] [PMC free article] [PubMed] [Google Scholar]
Associated Data
This section collects any data citations, data availability statements, or supplementary materials included in this article.