

ABSTRACT
Background
Fluid overload and interdialytic weight gain (IDWG) are discrete components of the dynamic fluid balance in haemodialysis patients. We aimed to disentangle their relationship, and the prognostic importance of two clinically distinct, bioimpedance spectroscopy (BIS)-derived measures, pre-dialysis and post-dialysis fluid overload (FOpre and FOpost) versus IDWG.
Methods
We conducted a retrospective cohort study on 38 614 incident patients with one or more BIS measurement within 90 days of haemodialysis initiation (1 October 2010 through 28 February 2015). We used fractional polynomial regression to determine the association pattern between FOpre, FOpost and IDWG, and multivariate adjusted Cox models with FO and/or IDWG as longitudinal and time-varying predictors to determine all-cause mortality risk.
Results
In analyses using 1-month averages, patients in quartiles 3 and 4 (Q3 and Q4) of FO had an incrementally higher adjusted mortality risk compared with reference Q2, and patients in Q1 of IDWG had higher adjusted mortality compared with Q2. The highest adjusted mortality risk was observed for patients in Q4 of FOpre combined with Q1 of IDWG [hazard ratio (HR) = 2.66 (95% confidence interval 2.21–3.20), compared with FOpre-Q2/IDWG-Q2 (reference)]. Using longitudinal means of FO and IDWG only slightly altered all HRs. IDWG associated positively with FOpre, but negatively with FOpost, suggesting a link with post-dialysis extracellular volume depletion.
Conclusions
FOpre and FOpost were consistently positive risk factors for mortality. Low IDWG was associated with short-term mortality, suggesting perhaps an effect of protein-energy wasting. FOpost reflected the volume status without IDWG, which implies that this fluid marker is clinically most intuitive and may be best suited to guide volume management in haemodialysis patients.
Keywords: bioimpedance spectroscopy, fluid overload, haemodialysis, interdialytic weight gain, mortality
INTRODUCTION
The cardiovascular risk in end-stage renal disease patients undergoing haemodialysis is neither too high [1] to be fully explained by traditional and non-traditional risk factors, nor has the modification of these factors demonstrated significant improvement in mortality [2]. Objective assessment of fluid overload (FO) by whole-body bioimpedance spectroscopy (BIS) [3, 4] has established FO as predictor of mortality in haemodialysis [5, 6] and chronic kidney disease Stages 4 and 5 patients [7], while observational studies [8, 9] and several small randomized controlled trials demonstrated benefit with FO reduction [10–13]. In a recent analysis of FO in relationship to blood pressure, cumulative 1-year FO exposure was associated with a greater mortality risk than baseline FO, across three discrete blood pressure categories [14].
In their ‘Volume First’ approach, the Chief Medical Officers of Dialysis Providers in the USA have recommended that approaching the normalization of extracellular fluid volume should be a primary goal of dialysis care [15]. Fluid management initiatives, however, historically target interdialytic weight gain (IDWG) rather than chronic FO exposure [16], perhaps because regulatory approval and validated protocols for volume assessment tools are lacking [17]. Although IDWG was previously also termed ‘fluid retention’ [18], chronic FO should not be equalized with IDWG [19, 20], a surrogate of nutritional intake [21], that only partially reflects the risk of extracellular volume (ECV) expansion.
Pre-dialysis FO (FOpre) is the combination of IDWG and any residual post-dialysis FO (FOpost) that remains in the patient’s body at the end of the preceding dialysis treatment session (Figure 1). Analyses of FO have more commonly reported on FOpre than FOpost but the superior suitability of FOpre for application in clinical practice is questionable. The extremes of high IDWG have been shown to be associated with an increased risk of mortality, when adjusted for case-mix [18, 22–24]; however, studies on FOpre [5, 6] and FOpost [25] have demonstrated a much stronger association with mortality, based on the comparison of the respective effect estimates for IDWG versus FO.
FIGURE 1.

Measurements of FO and IDWG.
Although IDWG and FO are expected to be inter-related, the relationship between these metrics has not been investigated in great detail and the relative strengths of the mortality risk have never been compared in the same dataset. Using the large dataset of the international NephroCare dialysis units, where BIS measurements are performed routinely [3, 4], we determined (i) the relationship between FOpre and FOpost with IDWG, (ii) the risk for mortality of these factors alone and in combination and (iii) tested whether IDWG modifies the relationship of FO with all-cause mortality.
MATERIALS AND METHODS
Patients and data assessment
All patients were treated in a large dialysis organization (NephroCare). BIS measurements with the Body Composition Monitor (BCM, Fresenius Medical Care, Bad Homburg, Germany [3, 4, 20, 26]) were introduced in the NephroCare centres in the year 2009 as the clinical best practice, and followed a predefined centre-specific roll-out plan. BCM measurements were performed by the nursing staff and electronically transferred into the database using a patient card connected to the BCM device. NephroCare policy mandated BCM measurements to be conducted every 6 weeks, which was modified to every 3 months in 2015, whereas additional BCM measurements could also be ordered by the Nephrologist in charge. The study period of the present analysis lasted from 1 October 2010 through 28 February 2015 (Figure 2). To avoid selection bias, centres were only included in the study if they routinely used the BCM on all patients qualifying for the measurement [27]. To study fluid status of patients from or soon after the start of dialysis, patients who had their first BCM measurement >90 days after the start of renal replacement therapy were excluded. Fluid status assessment (BCM measurement) was performed before dialysis. BCM measurements pre- and post-dialysis yield changes in ECV that are not significantly different from the intradialytic weight loss [28, 29], indicating that FOpost can be calculated reliably by subtracting the intradialytic weight loss from the BCM measurement of FOpre. BCM-derived parameters (Supplementary data, Table S1) and FO itself have also been described at greater detail in previous studies and review papers [20, 26, 30–33].
FIGURE 2.

Derivation of the study cohort.
Data collection, outcome and exposures
Data were anonymized and collected using the EuCliD5 database described elsewhere [34]. All study data were from patients who had provided written informed consent. The primary outcome investigated was all-cause mortality, as recorded in EuCliD5, and the primary exposures of interest were IDWG, FOpre and FOpost. The principal covariates are listed in Tables 1 and 2. In this study, we not only used relative values for FOpre and FOpost (= absolute values divided by ECV [6]), but also provided absolute values for the FO quartiles in Table 2. Although IDWG (the pre-dialysis weight at the dialysis session ‘x’ minus the post-dialysis weight at the previous dialysis session ‘x − 1’) was available for every dialysis treatment, we only used the IDWG value obtained on the day of the BCM measurement. Per NephroCare policy, dialysis caretakers were instructed to avoid the day directly after the long interdialytic interval for BCM measurements. Relative IDWG and body mass index (BMI) were calculated using the pre-dialysis weight.
| B. By quartile of relative FOpre | ||||
|---|---|---|---|---|
| Patient characteristic | Q1 | Q2 | Q3 | Q4 |
| (N = 9653) | (N = 9654) | (N = 9653) | (N = 9654) | |
| Mean [SD] | Mean [SD] | Mean [SD] | Mean [SD] | |
| Rel. FOpre* in % | 0.0 [5.7] | 7.9 [1.5] | 12.8 [1.5] | 21.8 [5.6] |
| (range) | (<5.3) | (5.3–10.3) | (10.3–15.6) | (>15.6) |
| Abs. FOpre* in L | 0.15 [0.94] | 1.43 [0.54] | 2.28 [0.62] | 3.97 [1.44] |
| Rel. FOpost* in % | −10.2 [8.0] | −2.6 [4.7] | 1.5 [4.4] | 9.8 [7.6] |
| Rel. IDWG* in % | 3.2 [2.3] | 3.6 [2.2] | 4.2 [2.4] | 5.0 [3.2] |
| No of meas./surv. time in days | 11.7/565.0 = 0.0207 | 13.2/584.2 = 0.0226 | 12.7/569.4 = 0.0223 | 9.03/465.6= 0.0193 |
| Age in years | 58.8 [15.9] | 62.0 [15.8] | 62.8 [15.5] | 60.2 [15.4] |
| BMI* in kg/m2 | 28.4 [6.1] | 26.6 [5.0] | 25.2 [4.6] | 23.5 [4.2] |
| Males (%) | 49.4 | 59.8 | 63.0 | 66.2 |
| Diabetics (%) | 18.3 | 22.6 | 28.4 | 34.5 |
| CHF (%) | 12.3 | 16.1 | 19.0 | 19.7 |
| PVD (%) | 7.5 | 11.2 | 13.1 | 11.8 |
| CAD (%) | 4.1 | 6.4 | 7.2 | 6.8 |
| Kt/V* | 1.6 [0.3] | 1.6 [0.3] | 1.6 [0.3] | 1.5 [0.3] |
| BPsys* in mmHg | 136.5 [17.4] | 138.6 [16.8] | 140.0 [18.2] | 142.6 [20.5] |
| BPdia* in mmHg | 72.3 [10.7] | 71.9 [10.9] | 71.8 [11.1] | 73.7 [11.4] |
| Albumin* in g/dL | 3.9 [0.4] | 3.9 [0.4] | 3.8 [0.4] | 3.7 [0.5] |
| Haemoglobin* in g/dL | 11.1 [1.2] | 11.1 [1.1] | 10.9 [1.2] | 10.4 [1.4] |
| IDWG* in kg | 2.3 [1.3] | 2.5 [1.2] | 2.8 [1.3] | 3.1 [1.7] |
| Rel. IDWG* in % | 3.2 [2.3] | 3.6 [2.2] | 4.2 [2.4] | 5.0 [3.2] |
| C. By quartile of relative FOpost | ||||
|---|---|---|---|---|
| Patient characteristic | Q1 | Q2 | Q3 | Q4 |
| (N = 9653) | (N = 9654) | (N = 9653) | (N = 9654) | |
| Mean [SD] | Mean [SD] | Mean [SD] | Mean [SD] | |
| Rel. FO post* in % | −12.0 [6.7] | −2.8 [1.5] | 2.0 [1.5] | 11.3 [6.2] |
| (range) | (<−5.5) | (−5.5 to −0.4) | (−0.4 to 4.7) | (>4.7) |
| Abs. FOpost* in L | −1.71 [1.01] | −0.37 [0.44] | 0.43 [0.45] | 2.14 [1.37] |
| Rel. FOpre* in % | 1.6 [6.9] | 8.3 [4.3] | 12.4 [4.3] | 20.3 [7.0] |
| Rel. IDWG* in % | 4.4 [2.7] | 4.0 [2.4] | 3.9 [2.5] | 3.7 [2.9] |
| No of meas./surv. time in days | 11.9/583.1 = 0.0204 | 13.8/598.9 = 0.0230 | 12.8/566.1 = 0.0226 | 21.8/436.1 = 0.0500 |
| Age in years | 57.2 [16.2] | 61.3 [15.5] | 62.7 [15.3] | 62.6 [15.3] |
| BMI* in kg/m2 | 27.8 [6.1] | 26.6 [5.2] | 25.3 [4.7] | 23.8 [4.4] |
| Males (%) | 50.0 | 59.4 | 62.48 | 66.4 |
| Diabetics (%) | 20.1 | 24.4 | 28.0 | 31.3 |
| CHF (%) | 12.5 | 16.4 | 18.6 | 19.5 |
| PVD (%) | 6.6 | 11.5 | 13.2 | 12.3 |
| CAD (%) | 4.1 | 6.6 | 6.8 | 7.0 |
| Kt/V* | 1.6 [0.3] | 1.6 [0.3] | 1.6 [0.3] | 1.5 [0.3] |
| BPsys* in mmHg | 137.9 [18.1] | 139.6 [17.1] | 140.2 [17.9] | 140.0 [20.3] |
| BPdia* in mmHg | 73.0 [11.2] | 72.2 [10.8] | 72.1 [10.8] | 72.4 [11.2] |
| Albumin* in g/dL | 4.0 [0.4] | 3.9 [0.4] | 3.8 [0.4] | 3.6 [0.5] |
| Haemoglobin* in g/dL | 11.1 [1.2] | 11.0 [1.1] | 10.9 [1.2] | 10.3 [1.5] |
Descriptive statistics of longitudinal patient and treatment characteristics of N = 38 614 patients who had their first BCM measurement within 90 days after first haemodialysis treatment. Values were evaluated at baseline, or as means over all measurements during the follow-up for longitudinally available time-varying variables (*). Comorbidities were evaluated as at least one occurrence until the end of the follow-up. Continuous variables are means [SD].
Abs, absolute; BPsys pre, pre-dialysis systolic blood pressure; BPdia pre, pre-dialysis diastolic blood pressure; CHF, congestive heart failure; PVD, peripheral vascular disease; CAD, coronary artery disease.
Table 1.
Demographics and patient characteristics of the study cohort
| Patient characteristics | n (%); mean [SD] |
|---|---|
| Total N | 38 614 |
| Deaths observed | 5640 (14.6) |
| Males, n | 23 011 (59.6) |
| Age in years | 60.9 [15.7] |
| Height in cm | 164.8 [10.5] |
| Weight pre-dialysis* in kg | 72.6 [16.5] |
| Weight post-dialysis* in kg | 70.7 [16.3] |
| BMI* in kg/m2 | 25.9 [5.3] |
| Absolute IDWG* in kg | 2.6 [1.4] |
| Relative IDWG* in % body weight | 4.0 [2.6] |
| Absolute FOpre* in L | 2.0 [1.7] |
| Relative FOpre* in % ECV | 10.6 [8.9] |
| Absolute FOpost* in L | 0.1 [1.7] |
| Relative FO post* in % ECV | −0.4 [9.6] |
| BPsys pre* in mmHg | 139.4 [18.4] |
| BPdia pre* in mmHg | 72.4 [11.0] |
| Diabetics | 10 073 (31.5) |
| Patients with congestive heart failure | 4761 (14.9) |
| Patients with coronary artery disease | 1762 (5.5) |
| Patients with peripheral vascular disease | 2920 (9.1) |
| Albumin* in g/dL | 3.8 [0.4] |
| Haemoglobin* in g/dL | 10.8 [1.3] |
| Kt/V* | 1.6 [0.3] |
Descriptive statistics of N = 38 614 patients who had their first BCM measurement within 90 days after first haemodialysis treatment. Values were evaluated at baseline or as means over all measurements during the follow-up for longitudinally available time-varying variables (*). Comorbidities were evaluated as at least one occurrence until the end of the follow-up. Continuous variables are means [SD].
BPdia pre, pre-dialysis diastolic blood pressure; BPsys pre, pre-dialysis systolic blood pressure.
Table 2.
Patient characteristics, by quartile of FO and IDWG
| A. By quartile of relative IDWG | ||||
|---|---|---|---|---|
| Patient characteristic | Q1 | Q2 | Q3 | Q4 |
| (N = 9653) | (N = 9654) | (N = 9653) | (N = 9654) | |
| Mean [SD] | Mean [SD] | Mean [SD] | Mean [SD] | |
| Rel. IDWG* in % | 1.3 [1.3] | 3.0 [0.4] | 4.4 [0.5] | 7.5 [2.3] |
| (range) | (<2.4) | (2.4–3.6) | (3.6–5.2) | (>5.2) |
| IDWG* in kg | 1.1 [0.9] | 2.3 [0.5] | 3.0 [0.5] | 4.3 [1.1] |
| Rel. FOpre* in % | 7.7 [9.2] | 9.5 [8.0] | 11.2 [8.0] | 14.0 [9.2] |
| Rel. FOpost* in % | 1.3 [9.8] | −0.6 [8.9] | −1.0 [9.0] | −1.1 [10.6] |
| No of meas./surv. time in days | 10.0/493.5 = 0.0203 | 12.9/567.3 = 0.0227 | 12.9/574.7 = 0.0197 | 10.8/548.6 = 0.0197 |
| Age in years | 63.2 [14.4] | 63.2 [14.1] | 61.5 [15.3] | 56.0 [18.0] |
| BMI* in kg/m2 | 28.7 [6.1] | 27.5 [4.8] | 25.2 [4.0] | 22.2 [3.5] |
| Males (%) | 57.4 | 63.7 | 62.9 | 54.4 |
| Diabetics (%) | 25.1 | 28.7 | 26.6 | 23.3 |
| CHF (%) | 17.0 | 18.2 | 17.5 | 14.3 |
| PVD (%) | 10.6 | 13.7 | 11.7 | 7.6 |
| CAD (%) | 6.1 | 7.0 | 6.5 | 4.9 |
| Kt/V | 1.5 [0.3] | 1.5 [0.3] | 1.6 [0.3] | 1.7 [1.4] |
| BPsys* in mmHg | 137.1 [17.7] | 138.5 [17.7] | 139.8 [18.1] | 142.3 [20.0] |
| BPdia* in mmHg | 71.5 [10.2] | 71.4 [10.6] | 72.1 [11.1] | 74.7 [11.8] |
| Albumin* in g/dL | 3.8 [0.5] | 3.9 [0.4] | 3.9 [0.4] | 3.8 [0.4] |
| Haemoglobin* in g/dL | 10.8 [1.3] | 11.0 [1.2] | 10.9 [1.2] | 10.7 [1.4] |
Statistical analysis
Analysis of mortality risk and covariate transformation
For time-to-event analysis (shown in Figures 3 and 5), we used multivariate Cox regression models with a time scale in days to analyse the association between FOpre, FOpost and/or IDWG and all-cause death. Follow-up started on the first day of dialysis treatment. Patients were censored if they were transplanted or lost to follow-up. Both exposure measures (IDWG and FO) and all continuous variables used for adjustments [BMI, serum albumin, serum phosphate, haemoglobin, high-density lipoprotein (HDL) cholesterol, triglycerides, protein catabolic rate (nPCR), Kt/V, systolic blood pressure pre-dialysis and serum sodium concentration] were transformed into time-varying covariates. All time-varying covariates were primarily summarized on a monthly grid, that is, if there were multiple measurements during a particular month we calculated the average of all measurements obtained during this month (‘1-month average measure’). Missing values of monthly time-varying measures were imputed using a ‘last observation carried forward’ imputation approach, meaning that we considered the time-varying measure from the previous month if there was no measurement during a particular month. For the exposure measures (IDWG and FO), we used the time-varying 1-month average measure for the primary analysis mortality analysis (effect of short-term exposure intensity). In addition, we calculated time-varying 12-month moving average measures for the secondary analysis of the mortality risk associated with IDWG and FO (effect of intermediate exposure intensity), using the average of the time-varying 1-month measure when the event occurred and the 11 averaged monthly measurements preceding the event. For all other time-varying variables that were not the exposure measures (but were used for adjustments, as mentioned above) we calculated 3-month moving averages, evaluated at the last month of each 3-month period. Thus, all adjustments for time-varying variables were performed using 3-month moving averages. All models were also adjusted for clustering by centre and country, using a frailty term and robust variance estimation. A detailed additional description of the Cox regression models, including the rationale for choosing quartile 2 (Q2) as the reference group, is provided in the Supplementary Material, due to restrictions of space.
FIGURE 3.

Distribution of exposure measures and their mortality effect estimates, by quartile. (A–C) Density estimates of the distribution of time-varying measurements of FO and IDWG calculated by Epanechnikov Kernel functions (719 497 repeated measurements in N = 38 614 patients). Black lines refer to the quartile cut-points. Note that IDWG is expressed in percentage of body weight, whereas FO is expressed in percentage of ECV. For absolute and relative values by quartile (means over all measurements), refer to Table 2. (D–F) Forest plots depicting estimates for the effect of IDWG, FOpre and FOpost on all-cause mortality (see also Supplementary data, Table S4). Estimates were obtained using different prognostic models that included the FO markers and IDWG as time-varying predictor variables, aggregated as 1-month or 12-month moving averages or as fixed, patient-averaged predictor variables, the latter being entitled average long-term exposure (Cox regression analyses 1A and 1B). HRs are relative hazards to the second quartile. The effect estimates of time-varying exposure was adjusted for age, sex, BMI, albumin, phosphate, haemoglobin, HDL cholesterol, triglycerides, protein catabolic rate, Kt/V, haemodialysis treatment modality, vascular access, diabetes, congestive heart failure, coronary artery disease, tumour, dementia, diuretics and treatment of hypertension. The effect estimates were additionally adjusted for IDWG (or FO, respectively); these data are shown in the lower half of each panel.
FIGURE 5.

Association between IDWG and mortality, by quartile of FO. (A, B) Cubic spline models estimating multivariate adjusted HRs relative to the IDWG concentration in the second FO quartile (IDWG = 0.06). The knots were placed using Harrell’s recommended percentiles [35]. FO quartiles were calculated based on longitudinal means over all measures of a patient during the follow-up. HRs were adjusted for age, sex, BMI, albumin, phosphate, haemoglobin, HDL cholesterol, triglycerides, protein catabolic rate, Kt/V, haemodialysis treatment modality, vascular access, diabetes, congestive heart failure, coronary artery disease, tumour, dementia, diuretics and treatment of hypertension. HRs for IDWG in FO Q1, Q3 and Q4 were multiplied by the marginal HRs of the FO quartile relative to the second FO quartile (Cox regression analysis 4). (C, D) Estimates for the combined effect of IDWG and FOpre/FOpost, obtained from Cox regression analysis 2B, which included a combination dummy variable, considering the joint bivariate exposure of time-varying IDWG and FOpre (A) and FOpost (B), aggregated as 1-month or 12-month moving averages (see also Supplementary data, Table S5). HRs were calculated relative to the subgroup with measurements in the second quartile for both FOpost and IDWG. The effect estimates were adjusted for age, sex, BMI, albumin, phosphate, haemoglobin, HDL cholesterol, triglycerides, protein catabolic rate, Kt/V, haemodialysis treatment modality, vascular access, diabetes, congestive heart failure, coronary artery disease, tumour, dementia, diuretics and treatment of hypertension.
Further to the time-varying analyses, we calculated means over all FO and the respective IDWG measurements of a patient (‘longitudinal FO and IDWG means’) to quantify the average long-term exposure during the follow-up period, subdividing the cohort into four quartiles. We used descriptive statistics to display the patient and treatment characteristics within each FO and IDWG quartile (Table 2).
We analysed the effect of time-varying FO (FOpre or FOpost) on time-varying IDWG using an extended linear regression model (Figure 4). We chose fractional polynomial regression since the pattern of association explored by a non-parametric smoothing technique indicated a continuous but non-linear relationship over the whole range of measurements (data not shown).
FIGURE 4.
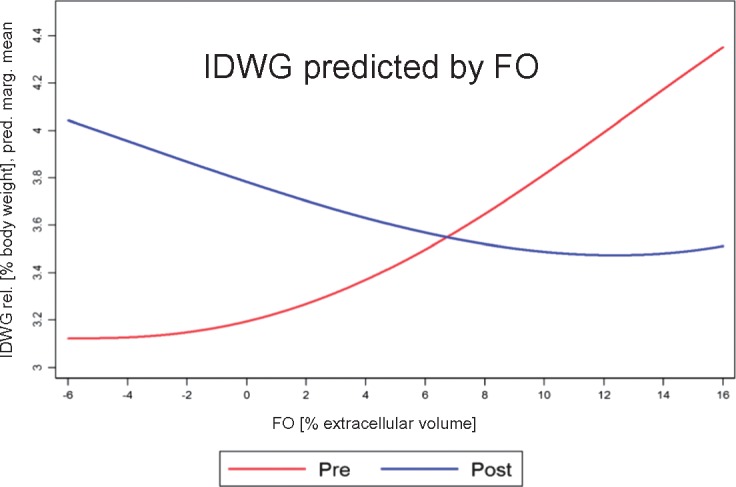
Association pattern of exposure measures. Predicted fitted marginal means of time-varying IDWG as a function of time-varying FOpre or FOpost obtained from a fractional polynomial regression model. Note that IDWG is expressed in percentage of body weight, whereas FO is expressed in percentage of ECV.
All statistical analyses were conducted using the statistical software package Stata (StataCorp 2015; Stata Statistical Software: Release 14; StataCorp LP, College Station, TX, USA).
RESULTS
Study population
Of the 72 313 patients in the dialysis clinics of NephroCare EMEALA who met the inclusion criteria, 38 614 had their first BCM measurement performed within 90 days of their first dialysis treatment and were included (Figure 2). The majority of patients (>70%) were from European countries (Supplementary data, Table S2) and 59.6% were male (Table 1). The mean number of BCM measurements per patient during the observation period was 11.7 (Supplementary data, Table S2).
IDWG versus FO status, and patient characteristics through IDWG and FO quartiles
The distribution of monthly measures of IDWG and FO is shown in Figure 3A–C. Mean FOpre of the study cohort was 10.6 ± 8.9% (absolute FOpre: 2.0 ± 1.7 L) and mean FOpost was −0.4 ± 9.6% (absolute FOpost: 0.1 ± 1.7 L). When the study population was subdivided by quartile of IDWG, FOpre and FOpost, patients in IDWG quartile 4 (Q4) had fewer comorbidities compared with patients in the other IDWG quartiles (Table 2A), whereas comorbidities increased from the lowest to the highest quartile of both FOpre and FOpost (Table 2B and C, respectively). Blood pressure increased and BMI decreased from the lowest to the highest quartile of IDWG, FOpost and FOpre (Table 2A–C, respectively).
The association between patient characteristics and quartiles of IDWG as well as FOpost combined is shown in Supplementary data, Table S3A–D. Even within the four quartiles of FOpost, BMI decreased from the lowest to the highest quartile of IDWG.
The association between IDWG and FO status
We analysed the bivariate association between the monthly measures of IDWG and FOpre as well as FOpost. Both FO markers showed a weak association with IDWG (Figure 4) but in opposite directions, as was previously observed in the quartile pattern (Table 2). IDWG ‘increased’ with increasing FOpre but ‘decreased’ with increasing FOpost (Spearman’s correlation coefficients: FOpre/IDWG = 0.24, FOpost/IDWG = −0.18). The association pattern was visualized by a fractional polynomial regression fit indicating a slightly non-linear relationship (Figure 4).
Mortality risk associated with IDWG, FOpre and FOpost
The median (interquartile range) observation period was 491 days (548 days). The 10th and 90th percentiles of the observation period were 117 and 1046 days, respectively. A total of 5640 patients (14.6%) died during the observation period (Table 1).
Prognostic effect of IDWG
When we applied time-varying 1-month average measurements of IDWG as predictors [Cox regression analysis 1A (details in the Supplementary Material), Figure 3 and Supplementary data, Table S4], the adjusted mortality risk was significantly higher for patients in quartile 1 (Q1) of IDWG in comparison with Q2 (reference). A sensitivity analysis with time-varying 12-month moving average measurements of IDWG showed no significant mortality differences between the four quartiles (Figure 3 and Supplementary data, Table S4, italic values), with the exception of a slightly decreased mortality risk in Q4 of IDWG (in the core model). Replacing time-varying IDWG measurements with longitudinal IDWG means as predictors [Cox regression analysis 1B (details in the Supplementary Material)] yielded a significantly higher adjusted mortality risk for patients in Q1 of IDWG (Figure 3 and Supplementary data, Table S4).
Prognostic effect of FO
When we applied time-varying 1-month average measurements of FOpre and FOpost as predictors [Cox regression analysis 1A (details in the Supplementary Material), Figure 3 and Supplementary data, Table S4], the adjusted mortality risks were significantly higher for patients in Q3 and Q4 of FOpre and FOpost in comparison with Q2 (reference). The adjusted mortality risk for patients in Q1 of FOpost was also significantly higher than the mortality risk for patients in the reference group. Sensitivity analyses with time-varying 12-month moving averages of FOpre and FOpost did not substantially change the results (Figure 3 and Supplementary data, Table S4, italic values). Replacing time-varying FOpre and FOpost by longitudinal FOpre and FOpost means as predictors [Cox regression analysis 1B (details in the Supplementary Material)] did not substantially change the results (Figure 3 and Supplementary data, Table S4). Additional adjustments for potential confounders only slightly altered the mortality hazard of patients (Supplementary data, Table S4).
Prognostic effect of FO and IDWG combined
The mortality effect estimates of the joint exposure of IDWG and time-varying FOpre and FOpost are shown in Figure 5 and Supplementary data, Table S5A and B [Cox regression analysis 2B (details in the Supplementary Material)]. In Cox regression analyses that employed time-varying measurements of FO and IDWG with 1-month averages as predictors, the mortality risk throughout the quartiles of FOpre and FOpost was the highest when patients were also in Q1 of IDWG. A model including an IDWG*FOpre interaction term [Cox regression analysis 3 (details in the Supplementary Material)] did not reveal evidence of effect modification of FOpre by IDWG (P-value of global Wald test of interaction terms = 0.142). A model including an IDWG*FOpost interaction term [Cox regression analysis 3 (details in the Supplementary Material)] revealed evidence of effect modification of FOpost by IDWG (P-value of global Wald test of interaction terms = 0.025), indicating that the risk associations of IDWG differed by FOpost, being the strongest in the fourth quartile of FOpost (P = 0.025).
The spline fits visualizing the functional relationship between time-varying IDWG exposure with 1-month averages for subgroups of patients with different (longitudinal) averages of FOpre and FOpost are shown in Figure 5 [Cox regression analysis 4B (details in the Supplementary Material)]. As predicted by the quartile models shown in the Tables of Figure 5 and in Supplementary data, Table S5A and B, the spline curves demonstrate a continuously increasing mortality risk with lower IDWG values. We did not observe an effect using 12-month moving averages for time-varying IDWG exposure in Cox regression analysis 4A and therefore did not fit the respective spline models for 12-month moving averages of IDWG. Figure 5 demonstrates that within each quartile of FOpre and FOpost, <5% of patients had a higher mortality risk associated with ‘higher’ IDWG.
Sensitivity analyses
Because transplantation might have been an informative event with different censoring effects across differing fluid status, we conducted a competing risk model [36] for all three primary exposure measures of interest, considering transplantation as non-independent competing event, and using the core model (i.e. the ‘total effect’ and the time-varying 1-month average exposure). The estimates obtained in the competing risk model and the classical Cox model were very similar, indicating that it was methodologically sound for patients undergoing transplantation to be censored in the classical survival setting (data not shown). Secondly, because information on residual kidney function was absent but residual kidney function might have had an important confounding effect, we conducted a sensitivity analysis in the subpopulation of subjects who were on dialysis >2 years, and therefore were more likely to have lost residual kidney function. The effect estimates obtained for the three primary exposure measures of interest (using again the core model and the time-varying 1-month average exposure) were very similar to the estimates obtained in the full analysis (data not shown). Thirdly, because a greater percentage of patients in higher FO quartiles had congestive heart failure (Table 2B and C), which might have confounded the results, we conducted a sensitivity analysis in the subpopulation without congestive heart failure. The effect estimates obtained for the three mates primary exposure measures of interest (using again the core model and the time-varying 1-month average exposure) were very similar to the estimates obtained in the full analysis (data not shown).
DISCUSSION
In this study of a large international haemodialysis population, FOpre as well as FOpost were associated with increasing patient age, a lower BMI and multiple comorbidities and strongly predicted all-cause mortality, consistent with previous smaller reports [5, 6], a study of the MONDO initiative [25] and our recent analysis of FO in relationship to blood pressure [14]. IDWG was positively associated with FOpre and negatively associated with FOpost, suggesting not only the expectable correlation between large IDWG and ECV depletion but rather directing the attention to reduced IDWG and perhaps inferior nutritional intake in patients with severe FO. Mortality analyses of IDWG and FO as time-varying covariates (using a 1-month window) and as longitudinal covariates showed that patients in the lower IDWG quartile had higher mortality than patients in IDWG Q2–Q4, consistently through lower and higher FO ranges. This unexpected finding questions the established dialysis dogma that higher IDWG is worst for outcomes and requires considerable explanation.
Previous observational studies [18, 22–24] have analysed the mortality risk associated with IDWG in prevalent dialysis patients and found elevated mortality risk with high IDWG. Kalantar-Zadeh et al. [18] also used time-varying analyses with longer intervals and mortality for 3-month follow-up. All included patients were on dialysis >15 years ago (2002 and earlier), which may be relevant since analyses from the Dialysis Outcomes and Practice Patterns Study (DOPPS) showed that IDWG had generally declined over the years 2002–14 [22]. In all four major studies, the extremes of IDWG (>4.8% of body weight [23], >5.7% of body weight [22, 24] and ≥4.0 kg [18]) were associated with an elevated mortality risk ranging from hazard ratio (HR) = 1.12 (95% confidence interval 1.00–1.26) [24] to HR = 1.25 (1.12–1.39) [18]. None of these studies showed an elevated mortality risk at low IDWG. All adjusted mortality results must be interpreted cautiously as they may depend on incident versus prevalent patients, baseline versus time-varying methods and different lengths of follow-up. The influence of these factors deserves further study and is partly addressed in our sensitivity analysis.
Among a variety of fluid status assessment practices in haemodialysis patients [37–41], BIS-derived fluid measurements using the BCM offer a numerical assessment of FO [32]. However, among BCM-users, BCM-derived measures (Supplementary data, Table S1) vary considerably when outcomes are reported and clinical studies conducted [5, 6, 12, 42, 43]. For dry weight determination, FOpost is a clinically more intuitive fluid marker than FOpre and time-averaged FO, which is why we recommend this measure to guide volume management in haemodialysis patients in clinical practice as well as in future randomized trials aimed at prospectively assessing whether BCM-based FO reduction improves outcomes.
BCM measurements in NephroCare are not blinded and the haemodialysis centres in NephroCare do not follow a standardized protocol for the management of fluid volume adjustment, sodium loading avoidance and missed treatments. The results of this study, however, may nevertheless reflect the effect of BCM measurements and (undefined) strategies subsequent to target weight adjustments enforced by the dialysis personnel at the dialysis sessions following the BCM measurement, and in consequence, patients may have moved from one FO quartile to another and back. Patients with a clinical conundrum (hyper/hypotension, symptoms after treatment) might also have been targeted for BIS and this selection could have created a situation where more ‘extreme’ values might have been recorded, introducing confounding. Together, these uncertainties presented a challenge for this study. The statistical approach we chose contrasted our previous analysis [14], where we had determined the mortality risk associated with baseline and cumulative 1-year FO exposure in relationship to blood pressure.
Here we calculated 1-month averages of time-varying FO and IDWG measurements as predictors for visualization of the distribution (Figure 3) and for most of the mortality analyses in the Cox models (Cox regression analyses 1A, 2A and 3). However, as a sensitivity analysis, we also employed 12-month moving averages of time-varying FO and IDWG measurements as predictors (Cox regression analysis 1A), and also determined longitudinal patient means (Cox regression analyses 1B and 4). Interestingly, the difference between the 1-month versus 12-month moving averages in the time-varying analyses was greater than between 1-month averages and the longitudinal means. As the 1-month averages encompass a much shorter period prior to death than the 12-month moving averages, these sensitivity analyses emphasize that low IDWG may be a short-term signal [44], in that patients may move into the lowest IDWG quartile as a precursor to death due to inflammation and/or decreasing nutritional intake [21]. Usvyat et al. have shown that IDWG decreases in the 3 months prior to death [44]. On the contrary, FO continues to be a risk factor at baseline [14], per cumulative (1-year) exposure [14], longitudinally (chronically), as well as 12 months and 1 month prior to death.
In the primary analysis (Figure 3, Supplementary data, Table S4), HRs for all-cause mortality were analysed using two models with differing levels of adjustment. The core model was not adjusted for C-reactive protein (CRP) levels, systolic blood pressure and serum sodium concentrations, based on the rationale that previous studies had shown an association between CRP [25], blood pressure [14], serum sodium [20] and FO. Thus we wanted to separate our adjustment levels to distinguish between potential confounders versus mediators, implying that the adverse effects of CRP, blood pressure and serum sodium might have been mediated by FO but not entirely caused by other states of disease. The ‘non-mediated’ mortality association for FO analysed in the second Cox model did not differ substantially from the mortality effect that had not adjusted for these potential mediators of an FO effect on mortality.
This study has several limitations. Due to the observational nature of the study, we are neither able to determine the causative link between fluid status and mortality, nor the effect of any intervention on that association. The NephroCare dataset does not contain information on residual kidney function (urine volume) and ultrafiltration rates, which might be important modifiers of the associations analysed herein. Additional sources of uncontrolled confounding include inaccuracy of weighing scales and of weight itself (i.e. clothing), changes in body composition, equilibration between fluid compartments during dialysis, patient comorbidities, patient adherence to diet and dialysis regimen, all of which could contribute to the observed findings re IDWG. However, our new finding of higher mortality for incident haemodialysis patients with lower IDWG when using longitudinal means and time-varying analyses with 1-month averages may alter the perception of IDWG, specifically that higher IDWG is feared but lower IDWG may be overlooked, particularly as a short-term mortality risk indicator of frailty and malnutrition, often preluding a patient’s demise.
CONCLUSION
This analysis shows the importance of separating the issue of IDWG from FO. As higher FOpre and FOpost is associated with poorer survival, ∼50% of patients may benefit from lower target weight prescriptions based on the FOpost reading of the BIS-measurement, which has intuitive meaning for clinicians and is fundamental for a definition of FO based on outcomes. In clinical practice as well as prospective interventional trials aimed at showing that BIS-guided optimization of volume status may improve outcomes, low IDWG and changes in IDWG should receive additional attention.
Supplementary Material
ACKNOWLEDGEMENTS
We acknowledge the work of all the NephroCare clinical staff that performed the BCM measurements and to the complete EuCliD5 team. We thank Volker Schoder who helped as a consultant for the statistical analysis and Rainer Oberbauer as well as Connie Rhee for thoroughly reviewing the manuscript.
FUNDING
B.G. was partially funded by Fresenius Medical Care for conducting the statistical analysis of this study. Routinely performed BCM measurements are not refunded in the NephroCare dialysis centres, but the centres purchase the BCM device and also the electrodes that are necessary for the BCM measurement.
CONFLICT OF INTEREST STATEMENT
U.M. and P.W. are employees of Fresenius Medical Care, which produces the BCM. S.S., C.C., A.S. and B.C. are employees of Fresenius Medical Care/NephroCare. F.W.M. is an employee of Fresenius Medical Care, North America. M.H. has received a financial remuneration for three talks that were held for Fresenius Medical Care during the years 2015–17 as well as for chairing one symposium, organized by Fresenius Medical Care, at the ERA-EDTA 2017.
REFERENCES
- 1. Ortiz A, Covic A, Fliser D. et al. Epidemiology, contributors to, and clinical trials of mortality risk in chronic kidney failure. Lancet 2014; 383: 1831–1843 [DOI] [PubMed] [Google Scholar]
- 2. Kendrick J, Chonchol MB.. Nontraditional risk factors for cardiovascular disease in patients with chronic kidney disease. Nat Clin Pract Nephrol 2008; 4: 672–681 [DOI] [PubMed] [Google Scholar]
- 3. Wabel P, Chamney P, Moissl U. et al. Importance of whole-body bioimpedance spectroscopy for the management of fluid balance. Blood Purif 2009; 27: 75–80 [DOI] [PMC free article] [PubMed] [Google Scholar]
- 4. Chamney PW, Wabel P, Moissl UM. et al. A whole-body model to distinguish excess fluid from the hydration of major body tissues. Am J Clin Nutr 2007; 85: 80–89 [DOI] [PubMed] [Google Scholar]
- 5. Chazot C, Wabel P, Chamney P. et al. Importance of normohydration for the long-term survival of haemodialysis patients. Nephrol Dial Transplant 2012; 27: 2404–2410 [DOI] [PubMed] [Google Scholar]
- 6. Wizemann V, Wabel P, Chamney P. et al. The mortality risk of overhydration in haemodialysis patients. Nephrol Dial Transplant 2009; 24: 1574–1579 [DOI] [PMC free article] [PubMed] [Google Scholar]
- 7. Tsai YC, Chiu YW, Tsai JC. et al. Association of fluid overload with cardiovascular morbidity and all-cause mortality in stages 4 and 5 CKD. Clin J Am Soc Nephrol 2014; 10: 39–46 [DOI] [PMC free article] [PubMed] [Google Scholar]
- 8. Ozkahya M, Ok E, Toz H. et al. Long-term survival rates in haemodialysis patients treated with strict volume control. Nephrol Dial Transplant 2006; 21: 3506–3513 [DOI] [PubMed] [Google Scholar]
- 9. Charra B, Chazot C, Jean G. et al. Long, slow dialysis. Miner Electrolyte Metab 1999; 25: 391–396 [DOI] [PubMed] [Google Scholar]
- 10. Onofriescu M, Hogas S, Voroneanu L. et al. Bioimpedance-guided fluid management in maintenance hemodialysis: a pilot randomized controlled trial. Am J Kidney Dis 2014; 64: 111–118 [DOI] [PubMed] [Google Scholar]
- 11. Huan-Sheng C, Yeong-Chang C, Ming-Hsing H. et al. Application of bioimpedance spectroscopy in Asian dialysis patients (ABISAD-III): a randomized controlled trial for clinical outcomes. Int Urol Nephrol 2016; 48: 1897–1909 [DOI] [PubMed] [Google Scholar]
- 12. Hur E, Usta M, Toz H. et al. Effect of fluid management guided by bioimpedance spectroscopy on cardiovascular parameters in hemodialysis patients: a randomized controlled trial. Am J Kidney Dis 2013; 61: 957–965 [DOI] [PubMed] [Google Scholar]
- 13. Luo YJ, Lu XH, Woods F. et al. Volume control in peritoneal dialysis patients guided by bioimpedance spectroscopy assessment. Blood Purif 2011; 31: 296–302 [DOI] [PubMed] [Google Scholar]
- 14. Zoccali C, Moissl U, Chazot C. et al. Chronic fluid overload and mortality in ESRD. J Am Soc Nephrol 2017; 28: 2491–2497 [DOI] [PMC free article] [PubMed] [Google Scholar]
- 15. Weiner DE, Brunelli SM, Hunt A. et al. Improving clinical outcomes among hemodialysis patients: a proposal for a “Volume First” approach from the chief medical officers of US dialysis providers. Am J Kidney Dis 2014; 64: 685–695 [DOI] [PubMed] [Google Scholar]
- 16.FluidWise Clinical Pathway 2.0 for Fluid Management Nephrologist Memo. http://www.falconehr.com/wp-content/uploads/2016/01/FluidWise-Program-Update-OCMO-Memo.pdf
- 17. Perl J, Dember LM, Bargman JM. et al. The use of a multidimensional measure of dialysis adequacy-moving beyond small solute kinetics. Clin J Am Soc Nephrol 2017; 12: 839–847 [DOI] [PMC free article] [PubMed] [Google Scholar]
- 18. Kalantar-Zadeh K, Regidor DL, Kovesdy CP. et al. Fluid retention is associated with cardiovascular mortality in patients undergoing long-term hemodialysis. Circulation 2009; 119: 671–679 [DOI] [PMC free article] [PubMed] [Google Scholar]
- 19. Agarwal R. Volume overload in dialysis: the elephant in the room, no one can see. Am J Nephrol 2013; 38: 75–77 [DOI] [PubMed] [Google Scholar]
- 20. Hecking M, Karaboyas A, Antlanger M. et al. Significance of interdialytic weight gain versus chronic volume overload: consensus opinion. Am J Nephrol 2013; 38: 78–90 [DOI] [PubMed] [Google Scholar]
- 21. Sherman RA, Cody RP, Rogers ME. et al. Interdialytic weight gain and nutritional parameters in chronic hemodialysis patients. Am J Kidney Dis 1995; 25: 579–583 [DOI] [PubMed] [Google Scholar]
- 22. Wong MM, McCullough KP, Bieber BA. et al. Interdialytic weight gain: trends, predictors, and associated outcomes in the international Dialysis Outcomes and Practice Patterns Study (DOPPS). Am J Kidney Dis 2017; 69: 367–379 [DOI] [PubMed] [Google Scholar]
- 23. Foley RN, Herzog CA, Collins AJ.. Blood pressure and long-term mortality in United States hemodialysis patients: USRDS Waves 3 and 4 Study. Kidney Int 2002; 62: 1784–1790 [DOI] [PubMed] [Google Scholar]
- 24. Saran R, Bragg-Gresham JL, Rayner HC. et al. Nonadherence in hemodialysis: associations with mortality, hospitalization, and practice patterns in the DOPPS. Kidney Int 2003; 64: 254–262 [DOI] [PubMed] [Google Scholar]
- 25. Dekker MJ, Marcelli D, Canaud BJ. et al. Impact of fluid status and inflammation and their interaction on survival: a study in an international hemodialysis patient cohort. Kidney Int 2017; 91: 1214–1223 [DOI] [PubMed] [Google Scholar]
- 26. Davies SJ, Davenport A.. The role of bioimpedance and biomarkers in helping to aid clinical decision-making of volume assessments in dialysis patients. Kidney Int 2014; 86: 489–496 [DOI] [PubMed] [Google Scholar]
- 27.FreseniusMedicalCare. BCM - Body Composition Monitor http://www.bcm-fresenius.com/index.html
- 28. Wabel P, Rode C, Moissl U. et al. Accuracy of bioimpedance spectroscopy (BIS) to detect fluid status changes in hemodialysis patients (abstract). Nephrol Dial Transplant 2007; 22 (Suppl 6): VI129 [Google Scholar]
- 29. Jeong H, Lim CW, Choi HM. et al. The source of net ultrafiltration during hemodialysis is mostly the extracellular space regardless of hydration status. Hemodial Int 2016; 20: 129–133 [DOI] [PubMed] [Google Scholar]
- 30. Antlanger M, Hecking M, Haidinger M. et al. Fluid overload in hemodialysis patients: a cross-sectional study to determine its association with cardiac biomarkers and nutritional status. BMC Nephrol 2013; 14: 266. [DOI] [PMC free article] [PubMed] [Google Scholar]
- 31. Antlanger M, Josten P, Kammer M. et al. Blood volume-monitored regulation of ultrafiltration to decrease the dry weight in fluid-overloaded hemodialysis patients: a randomized controlled trial. BMC Nephrol 2017; 18: 238. [DOI] [PMC free article] [PubMed] [Google Scholar]
- 32. Hecking M, Rayner H, Wabel P.. What are the consequences of volume expansion in chronic dialysis patients?: defining and measuring fluid overload in hemodialysis patients. Semin Dial 2015; 28: 242–247 [DOI] [PubMed] [Google Scholar]
- 33. Hecking M, Antlanger M, Winnicki W. et al. Blood volume-monitored regulation of ultrafiltration in fluid-overloaded hemodialysis patients: study protocol for a randomized controlled trial. Trials 2012; 13: 79. [DOI] [PMC free article] [PubMed] [Google Scholar]
- 34. Rosati A, Tetta C, Merello JI. et al. Cumulative iron dose and resistance to erythropoietin. J Nephrol 2014; 28: 603–613 [DOI] [PubMed] [Google Scholar]
- 35. Harrell FE. Regression Modeling Strategies: With Applications to Linear Models, Logistic Regression, and Survival Analysis. New York, NY: Springer, 2001 [Google Scholar]
- 36. Fine JP, Gray RJ.. A proportional hazards model for the subdistribution of a competing risk. J Am Statist Ass 1999; 94: 496–509 [Google Scholar]
- 37. Sinha AD, Light RP, Agarwal R.. Relative plasma volume monitoring during hemodialysis AIDS the assessment of dry weight. Hypertension 2010; 55: 305–311 [DOI] [PMC free article] [PubMed] [Google Scholar]
- 38. Lopot F, Kotyk P, Blaha J. et al. Use of continuous blood volume monitoring to detect inadequately high dry weight. Int J Artif Organs 1996; 19: 411–414 [PubMed] [Google Scholar]
- 39. Picano E, Frassi F, Agricola E. et al. Ultrasound lung comets: a clinically useful sign of extravascular lung water. J Am Soc Echocardiogr 2006; 19: 356–363 [DOI] [PubMed] [Google Scholar]
- 40. Mallamaci F, Benedetto FA, Tripepi R. et al. Detection of pulmonary congestion by chest ultrasound in dialysis patients. JACC Cardiovasc Imaging 2010; 3: 586–594 [DOI] [PubMed] [Google Scholar]
- 41. Piera L, Cruz JM, Braga-Gresham JL. et al. [DOPPS estimate of patient life years attributable to modifiable hemodialysis practices in Spain]. Nefrologia 2007; 27: 496–504 [PubMed] [Google Scholar]
- 42. Machek P, Jirka T, Moissl U. et al. Guided optimization of fluid status in haemodialysis patients. Nephrol Dial Transplant 2010; 25: 538–544 [DOI] [PMC free article] [PubMed] [Google Scholar]
- 43. Moissl U, Arias-Guillen M, Wabel P. et al. Bioimpedance-guided fluid management in hemodialysis patients. Clin J Am Soc Nephrol 2013; 8: 1575–1582 [DOI] [PMC free article] [PubMed] [Google Scholar]
- 44. Usvyat LA, Barth C, Bayh I. et al. Interdialytic weight gain, systolic blood pressure, serum albumin, and C-reactive protein levels change in chronic dialysis patients prior to death. Kidney Int 2013; 84: 149–157 [DOI] [PMC free article] [PubMed] [Google Scholar]
Associated Data
This section collects any data citations, data availability statements, or supplementary materials included in this article.