

Summary
Diffuse large B cell lymphoma (DLBCL) is traced to a mature B malignance carrying abnormal activation‐induced cytidine deaminase (AID) expression. AID activity initially focuses on deamination of cytidine to uracil to generate somatic hypermutation and class‐switch recombination of the immunoglobulin (Ig), but recently it has been implicated in DNA demethylation of genes required for B cell development and proliferation in the germinal centre (GC). However, whether AID activity on mutation or demethylation of genes involves oncogenesis of DLBCL has not been well characterized. Our data demonstrate that the proto‐oncogene Fanconi anaemia complementation group A (FANCA) is highly expressed in DLBCL patients and cell lines, respectively. AID recruits demethylation enzyme ten eleven translocation family member (TET2) to bind the FANCA promoter. As a result, FANCA is demethylated and its expression increases in DLBCL. On the basis of our findings, we have developed a new therapeutic strategy to significantly inhibit DLBCL cell growth by combination of the proteasome inhibitor bortezomib with AID and TET2 depletion. These findings support a novel mechanism that AID has a crucial role in active demethylation for oncogene activation in DLBCL.
Keywords: activation‐induced cytidine deaminase, active demethylation, diffuse large B cell lymphoma, Fanconi anaemia complementation group A, 10–11 translocation‐2
Introduction
Diffuse large B cell lymphomas (DLBCL) are the most common lymphoid neoplasms and thought to arise from normal antigen‐exposed B cells in the germinal centres (GCs) of peripheral lymphoid organs in adults 1. During progression of DLBCL, the alterations in gene expression of oncogenes and/or tumour suppressors provide DLBCL cells with gene expression plasticity, escape from apoptosis and enhanced growth 2, 3, 4, 5, 6. The identification of gene expression profiling not only increases our understanding of the molecular mechanism of DLBCL, but also helps to define molecular subsets of DLBCL and rational targets for drug interventions that may allow for subtype/subset‐specific molecularly targeted precision medicine and personalized combinations to both prevent and treat relapsed/refractory DLBCL.
Numerous antigens and infections challenge the human immune system daily. In response to the stimulation, mature B cells possess two physiological gene‐editing systems, somatic hypermutation (SHM) and class‐switch recombination (CSR), which targets the immunoglobulin genes to promote affinity for antigens and change the isotype of the B cell receptor, respectively. Both reactions are mediated by activation‐induced cytidine deaminase (AID), an enzyme expressed in normal germinal centre B cells 7. AID initiates the SHM process through deamination of cytidine to uridine in the recombined variable region, followed by removal of the uracil base by uridine DNA glycosylase and DNA repair by several error‐prone base‐excision repair (BER) and mismatch‐repair enzymes 8, 9. AID further induces the CSR through deamination of bases in the switch region, causing double‐strand breaks (DSBs) and recombination 8, 9. In addition to the favourable role of AID in immune system, its mutation activity‐mediated chromosomal translocation introduces uncontrolled transcriptional expression of some oncogenes, which is important in lymphomagenesis 10, 11. It has been reported that AID is highly expressed in DLBCL 12. Recent whole‐genome/RNA sequencing studies identified many DLBCL cancer genes that are recurrently mutated and deregulate the expression 4, 13. It is well known that the mutation activity of AID‐mediated chromosomal translocations introduces uncontrolled transcriptional expression of oncogenes, which is important in lymphomagenesis of DLBCLs 14, 15. However, whether or not AID is directly involved in controlling gene expression has not previously been characterized in DLBCLs.
Epigenetic reprogramming of chromatin structure results in transcriptional regulation of some oncogenes associated with lymphomas 16, 17. The role of AID in DNA epigenetic reprogramming has recently received a great deal of focus 18, 19, 20, 21. Recent studies in cell culture and mice have shown a genomewide recruitment of AID in GCB 22, 23, 24. Moreover, AID involves demethylation of genes required for B cell development and proliferation 24, 25. It is thought to occur via deaminase activity followed by base excision DNA repair and replacement with unmethylated C 10. In addition, TET2, a member of ten eleven translocation (TET) family enzymes, has been reported to be closely related to AID in the process of DNA demethylation 26. It is proposed that TET family enzymes hydroxylate 5‐methylcytosine (5mC) to 5‐hydroxymethylcytosine (5hmC); AID then catalyses deamination of 5hmC to 5‐hydroxymethyluracil (5hmU) 26. TET2 plays an important role in many haematopoiesis and haematopoietic malignancies 27, 28. Thus, we presumed that the interaction between AID and TET2 controls DNA demethylation and that, in turn, mediates the expression of gene associated with the pathogenesis in DLBCL.
Here, we established the AID knock‐out DLBCL cell line by using CRISPR‐Cas9 technology. Our data demonstrate that the FANCA is highly expressed in DLBCL patients and cell line, respectively. We performed immunoprecipitation (IP) and chromatin immunoprecipitation (ChIP) to elucidate that AID recruits TET2 to bind FANCA promoter. As a result, FANCA is demethylated and its expression increase in DLBCL. We develop a new therapeutic strategy to significantly inhibit DLBCL cell growth by combination of proteasome inhibitor bortezomib with AID and TET2 depletion. These findings support the surprising mechanism that AID has a novel role for active demethylation to control FANCA expression in DLBCL.
Materials and methods
DLBCL patients and cell lines
Three non‐neoplastic lymphatic tissue and eight neoplastic lymph node (LN) samples from DLBCL patients were obtained from the Second Affiliated Hospital of Xi’an Jiaotong University. The diagnosis of diffuse large B cell lymphoma was based on the World Health Organization (WHO) criteria, characterized by diffuse infiltrates of large lymphoid cells. All the specimens were first examined on serial haematoxylin and eosin (H&E) sections (Supporting information, Fig. S1). Samples were embedded in paraffin. The study protocol was approved by the ethics committee of our institution and patient consent was obtained in accordance with the Declaration of Helsinki.
The OCI‐LY7 DLBCL cell line was purchased from BeNa Culture Collection. Cells were cultured at 37°C with 5% CO2 in Iscove’s modified Dulbecco’s medium (IMDM) (Hyclone, Thermo Scientific, Waltham, MA, USA) supplemented with 10% fetal bovine serum (FBS) (Sigma, St Louis, MO, USA), non‐essential amino acids and penicillin–streptomycin (1%) and β‐mercaptoethanol (50 μm). 293T cells were stored in our laboratory and cultured in Dulbecco’s modified Eagle’s medium (DMEM) (Hyclone) supplemented with 10% FBS, non‐essential amino acids and penicillin–streptomycin (Thermo Scientific) at 37°C with 5% CO2.
Cell treatment
Cells were treated by culturing in FBS‐free IMDM (Hyclone) supplemented with 1% penicillin–streptomycin. Dimethyloxaloylglycine (DMOG) (S7483; Selleckchem, Houston, TX, USA) and bortezomib (S1013; Selleckchem) were purchased from Selleckchem. OCI‐LY7 cells were treated with DMOG (1·5 mM) for 96 h or with bortezomib (5 nM) for 5 h. A combination treatment involved administration of bortezomib (5 nM) for 5 h following DMOG (1·5 mM) for 91 h.
Lentivirus production and stable cell line generation
The pL‐CRISPR.EFS.PAC was a gift from Dr Junjie Zhang at the University of Southern California. pCas9‐AID with gRNAs for AID were constructed, respectively. The gRNA sequences were listed in Supporting information, Table S1, and sequenced commercially (Sunny, Shanghai, China). To generate stable cell lines with integrated pCas9‐AID transgenes, the plasmids pCas9‐AID were transfected into 293T cells at a density of 1 × 10⁶ cells per 5‐cm plate and were seeded 24 h before transfection. The cells were then co‐transfected with the ΔR9 and pVSVG helper plasmids using the X‐tremeGENE HP DNA transfection reagent (Roche, Mannheim, Germany). Supernatants were collected after 72 h of transfection. DLBCL cells (1 × 10⁶) were infected with a freshly prepared AID knock‐out lentivirus by performing a 1000 × g spin inoculation at room temperature for 90 min in the presence of 10 μg/ml polybrene. Stably integrated DLBCL cells were selected with puromycin (0·6 µg/ml) for 5 days.
RNA extraction and quantitative reverse transcription–polymerase chain reaction (RT–PCR)
Total RNA of paraffin‐embedded non‐neoplastic lymphatic tissue and neoplastic lymph node tissues of DLBCL patients was extracted using the GenEluteTM formalin‐fixed paraffin‐embedded (FFPE0 RNA Purification Kit (RNB400‐50RXN; Sigma). The RNA of DLBCL cell pellets was extracted with TRIzol (Invitrogen, Carlsbad, CA, USA), according to the manufacturer’s instructions. cDNA was then synthesized with PrimeScriptTM RT reagent Kit (TaKaRa, Shiga, Japan), according to the manufacturer’s protocol. Quantitative PCR was performed with real‐time PCR with a Mx3000P (Agilent Technologies, Santa Clara, CSA, USA). Primers are listed in Supporting information, Table S2.
Genomic DNA isolation and bisulphite sequencing
Genomic DNA was extracted from 1–5 × 10⁶ cells using the Genomic DNA Extraction Kit (TaKaRa; D824A), according to the manufacturer’s protocol. The genomic DNA was converted by bisulphite treatment using the EZ DNA Methylation‐Gold Kit (D5006; Zymo Research, Irvine, CA, USA) and amplified by PCR with the EpiTaq™ HS Kit (TaKaRa; R110A). The primer sequences used for analysing the methylation status of FANCA promoter regions are listed in Supporting information, Table S3. Amplicons were observed on a 1·0% agarose gel. They were then excised, purified with the Omega Gel Extraction Kit (D2500‐01; Omega, Norwalk, CT, USA) and cloned into the pMD® 18‐T vector (TaKaRa; 6011). DNA containing amplicon inserts were identified by digestion with Xbal and SalI restriction enzymes and sequenced commercially (Sunny, Shanghai, China).
The –920 base pair (bp) from TSS of FANCA gene was amplified from genomic DNA and cloned into the pMD® 18‐T vector (TaKaRa; 6011). After being confirmed by Xbal and SalI restriction enzymes, the vector with the target fragments were sequenced commercially (Sunny). The primers are shown in Supporting information, Table S4.
Flow cytometry
To measure the proliferation and apoptosis ability of DLBCL cells, cells were prepared and stained according to standard procedures. To measure the proliferation ability of cells, anti‐carboxyfluorescein succinimidyl ester (CFSE) (C34554; eBioscience, Waltham, MA, USA) was used to stain the cells in advance for 3 h. The cells were then washed twice with 1 × phosphate‐buffered saline (PBS) at 4°C and analysed by flow cytometry. Starvation treatment was performed to measure apoptosis. Cells were collected and washed twice with 1 × PBS at 4°C, incubated with anti‐annexin V and anti‐7‐aminoactinomycin D (7‐AAD) (559763; BD, Sparks, MD, USA) for 15 min at room temperature. Finally, the cells were resuspended in flow cytometry buffer and analysed by flow cytometry. All data were collected using a CytoFLEX Flow Cytometer (Beckman Coulter, Brea, CA, USA).
Immunoblot analysis
Cell pellet was lysed in RIPA buffer [50 mM Tris‐HCl (pH 8.0)], 0·15 M NaCl, 1% Triton X‐100, 0·5% NaDoc, 0·1% sodium dodecyl sulphide (SDS), 1 mM ethylenediamine tetraacetic acid (EDTA), 1 mM ethylene glycol tetraacetic acid (EGTA), 1 m M phenylmethane sulphonyl fluoride (PMSF) (Amresco, Solon, OH, USA) and 1 μg/ml Pepstatin A (Sigma) protease inhibitors. After a low‐speed sonication using BioruptorTMUCD‐200 (Diagenode, Seraing, Belgium) for 15 min, cell lysates were centrifuged for 20 min at 15 000 g and 4°C, and the protein supernatants were finally collected. Protein samples were loaded onto 12% (w/v) Tris‐HCl sodium dodecyl sulphate‐polyacrylamide gel electrophoresis (SDS‐PAGE) for electrophoresis, transferred to polyvinylidene difluoride (PVDF) membrane (Millipore, Billerica, MA, USA) and blotted. It was then probed with anti‐AID (#4959; CST, Danvers, MA, USA), anti‐TET2 (#18950; CST) and anti‐FANCA (#14657; CST) antibodies. Anti‐ glyceraldehyde 3‐phosphate dehydrogenase (GAPDH) (ab9485; Abcam, Cambridge, MA, USA) was used as a loading control. The signal was further detected using the secondary antibody of goat anti‐rabbit, goat anti‐rat and goat anti‐mouse immunoglobulin (Ig)G conjugated with horseradish peroxidase (Thermo Scientific). Band signal was visualized by ImmobilonTM Western Chemiluminescent HRP substrate (Millipore).
Immunoprecipitation
Briefly, the whole cell extract was obtained as described in the immunoblot analysis. After preclearing the chromatin with Dynabeads Protein G beads (×2) (Invitrogen), a part of the aliquot was used as the input sample. Proteins from 5 × 10⁶ cells were then incubated with 5 μg specific antibody or normal goat IgG (#sc2346; Santa Cruz, Dallas, TX, USA) overnight at 4°C. Anti‐AID (ab59361; Abcam), anti‐TET2 (#18950; CST) immune complexes were pulled down by incubating with Dynabeads Protein G beads (×2) (Invitrogen) for 3 h. The beads were washed at 4°C with radioimmunoprecipitation assay (RIPA) buffer containing different concentrations of NaCl. The pulldown proteins were denatured at 100°C, and loaded onto the SDS‐PAGE gels to perform the immunoblot assay.
Chromatin immunoprecipitation
ChIP experiments were performed as described previously 29, 30. Briefly, 30 × 106 cells were cross‐linked with 1% formalin (HCHO) (Sigma) for 15 min at room temperature, and the reaction was terminated with 0·125 M glycine. The precipitate was washed, resuspended in RIPA buffer and sonicated to obtain DNA fragments of 300–500 bp. After preclearing the chromatin with Dynabeads Protein G beads (×2) (Invitrogen), approximately a tenth of the aliquot (approximately 5 × 10⁵ cell equivalents) was taken as the input sample. Then the left chromatin was incubated with 5 μg specific antibody or normal IgG overnight at 4°C. Immune complexes were pulled down with Dynabeads Protein G beads (2×) (Invitrogen). After reversal of cross‐links and purification of the DNA, quantitative PCR (qPCR) was performed using SYBR Premix Ex TaqTM (TaKaRa) with Mx3000 thermocycler (Agilent Technologies). The primer sequences used for qPCR are listed in the Supporting information, Table S5. Input samples were diluted so that each IP and input sample would give approximately equal qPCR signals. Using standard curves generated for each region analysed in each experiment, the amount of DNA recovered in immunoprecipitates and the input chromatin was calculated. ChIP‐qPCR signals were expressed as the following equation: [(IP/Inputcorr)/positive control = (IPspecific antibody − IPIgG)/Input) × 1000)/positive control]. ChIP experiments were performed with antibodies for anti‐AID (ab59361; Abcam), anti‐TET2 (#18950; CST) and normal goat IgG (#sc2346; Santa Cruz). The PCR of the DNA from ChIP was performed for 30 cycles. The bands were observed and pictured on 1·5% agarose gels.
In‐vivo tumour cell engraftment
Non‐obese diabetic/severe combined immunodeficiency (NOD/SCID) mice were maintained in specific pathogen‐free facilities at the Xi’an Jiaotong University Laboratory Animal Center. A murine model of human DLBCL was established by subcutaneous injection of 2 × 10⁷ AIDWT and AIDKO OCI‐LY7 cells into the left and right flanks of male NOD/SCID mice (n = 5), respectively. The tumour growth was monitored by measuring tumour size in two orthogonal dimensions. Tumour volume was calculated using the formula ½(long dimension) (short dimension)2. The tumour volume was monitored every week. Tumours were weighed following the euthanasia of all mice on day 42. All animal procedures were approved by the Institutional Animal Care and Use Committee of Xi’an Jiaotong University.
Statistical analysis
Unpaired t‐test and analysis of variance (anova) multiple test were performed with GraphPad Prism 6.0 (GraphPad Software, La Jolla, CA, USA). Data were considered statistically significant if P‐values were less than 0·05, as indicated.
Results
AID promotes DLBCL cell survival in vitro
AICDA is one of the few germinal centre B cell‐associated genes that is expressed in normal germinal centre B cells. To verify that AID played a fundamental role in the pathogenesis of DLBCL, we performed RT–PCR assay to detect AID expression in non‐neoplastic lymphatic tissue and neoplastic lymph node from DLBCL patients. We observed that AID expression was sixfold higher in neoplastic lymph node of DLBCL patients than in non‐neoplastic lymphatic tissue (control) (P < 0·05) (Fig. 1a), indicating that AID was deregulated in DLBCL patients. To elucidate whether AID involved the progression of DLBCL directly, the AIDKO DLBCL cell line OCI‐LY7 (AIDKO) was generated by transducing a transgene including CRISPR‐Cas9 targeting AID. The mRNA and protein levels of AID were significantly reduced in AIDKO cells compared with the OCI‐LY7 cell lines (AIDWT) (Fig. 1b,c). Cell division was monitored by labelling cells with CFSE and tracking dye dilution by flow cytometry. AIDKO cells slowed down division compared to AIDWT cells (Fig. 1d), indicating that AID deficiency impairs proliferation or survival of DLBCL cells. As a result, AIDKO cells were prone to undergo apoptosis through analysis by annexin V staining (P < 0·001) (Fig. 1e). In addition, the transcripts of pro‐apoptosis‐associated genes (such as FAS, BIMEI, BMF, BAK, PUMA, BAD, BID, BIK and BOK) increased in AIDKO cells (all P < 0·05) (Supporting information, Fig. S1a). Meanwhile, anti‐apoptosis‐associated gene (namely BCL2, BCL‐XL, BCLW, CLAP1, CLAP2, CFLIP, A1 and MCL1) expression dropped in AIDKO cells (all P < 0·05) (Supporting information, Fig. S1b). Taken together, these results suggest that AID promotes proliferation and inhibits apoptosis in DLBCL cells.
Figure 1.

Activation‐induced cytidine deaminase (AID) promotes DLBCL cell survival in vitro. (a) mRNA level of AID in non‐neoplastic lymphatic tissue (control) (n = 3) and neoplastic lymph node diffuse large B cell lymphoma (DLBCL) patients (n = 8) were measured by real‐time polymerase chain reaction (PCR). (b,c) AID depletion by transducing a transgene including CRISPR‐Cas9 targeting AID into OCI‐LY7 cells was confirmed by real‐time PCR (b) and immunoblot (c). (d) The cell divisions of AIDWT and AIDKO OCI‐LY7 cells were detected by flow cytometry detecting carboxyfluorescein succinimidyl ester (CFSE)‐stained DLBCL cells. (e) AIDWT (left) and AIDKO (right) OCI‐LY7 cells were treated by starvation culture in vitro. Cell apoptosis was assessed by flow cytometry detecting the apoptosis maker annexin V and 7‐aminoactinomycin D (7‐AAD) signals (left); statistical charts for percentages of apoptosis cells (right). Small horizontal lines indicate the mean [± standard deviation (s.d.)]. P‐values were analysed by two‐tailed t‐test with 95% confidence intervals. ***P < 0·001; *P < 0·05 compared with the AIDWT group.
AID contributes to tumorigenesis in the DLBCL cell engraftment mouse model
To gain more insight into the AID‐mediated survival leading to tumorigensis in vivo, we injected NOD/SCID mice subcutaneously with individually AIDWT or AIDKO cells. Tumour growth was monitored by measuring tumour volume every week after inoculation. The AIDWT DLBCL cell engraftment tumours grew faster than AIDKO tumours from the third week (P < 0·001) (Fig. 2a). After mice euthanasia on day 42, the tumours were dissected and the average tumour weight derived from AIDWT DLBCL cell engraftment mice was bigger than that from AIDKO DLBCL cells (P < 0·001) (Fig. 2b). These results confirm that AID has a significant role in promoting pathogenesis of DLBCL disease in vivo.
Figure 2.

Activation‐induced cytidine deaminase (AID) contributes to tumorigenesis in the diffuse large B cell lymphoma (DLBCL) cell engraftment mouse model. (a) Tumour volumes were monitored every week (n = 5). (b) Tumour weight measurement following tumour excision from the euthanized mice (n = 5). Small horizontal lines indicate the mean [± standard deviation (s.d.)]. P‐values were analysed by two‐tailed t‐test with 95% confidence intervals. ***P < 0·001 compared with the AIDWT group.
AID establishes FANCA demethylation in DLBCL cells
Previous studies have been shown that the Fanconi anaemia complementation group A gene (FANCA) is specifically increased in GC B cells, which associates with AID to produce high levels of SHM and CSR 31. Moreover, the deregulation of FANCA protein has been proved to be involved in cancer predisposition 32, including haematological malignancies 33. Thus, we hypothesized FANCA might also be involved in AID‐related DLCBL pathogenesis. As expected, we found that the FANCA mRNA level showed an increasing trend in neoplastic lymph node of DLBCL patients compared with the non‐neoplastic lymphatic tissue (control) (Fig. 3a), Moreover, FANCA dropped to almost one‐third after AID knock‐out in DLBCL cells (Fig. 3b,c). These data argue that AID enhances FANCA expression in DLBCL cells.
Figure 3.
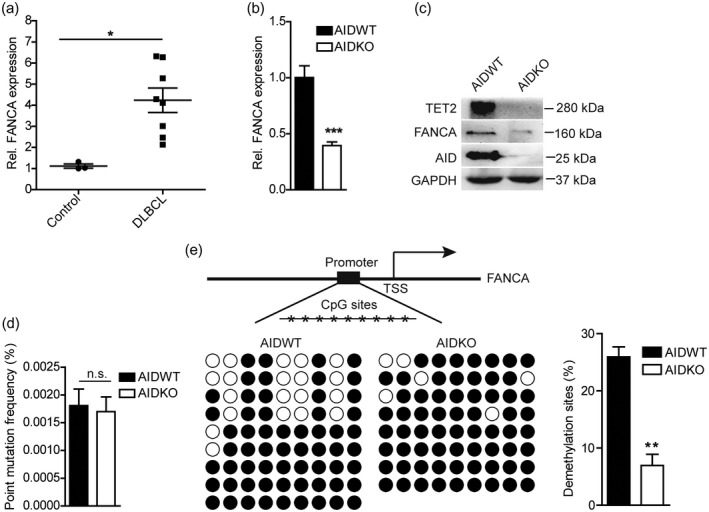
Activation‐induced cytidine deaminase (AID) establishes FANCA demethylation in diffuse large B cell lymphoma (DLBCL) cells. (a) mRNA level of Fanconi anaemia complementation group A (FANCA) in non‐neoplastic lymphatic tissue (control) (n = 3) and neoplastic lymph node DLBCL patients (DLBCL) (n = 8) were measured by real‐time polymerase chain reaction (PCR). (b) FANCA expression following AID deficiency was detected by immunoblot. (c) 10–11 translocation‐2 (TET2), FANCA and AID expression in AIDWT and AIDKO OCI‐LY7 cells were detected by immunoblot. (d) Statistical percentage of point mutation in AIDWT and AIDKO OCI‐LY7 cells by single clone sequencing for T vector with FANCA promoter sequences. (e) The methylation status of FANCA promoter in AIDWT and AIDKO OCI‐LY7 cells by single clone sequencing for T vector with FANCA promoter sequence after bisulphite treatment. The graph of methylation or demethylation CpG sites (left) were indicated in the schematic diagram (right). Black circles signify methylated cytosine–phosphate–guanosine (CpG) and white circles indicate demethylated CpG. Small horizontal lines indicate the mean [± standard deviation (s.d.)]. P‐values were analysed by two‐tailed t‐test with 95% confidence intervals. ***P < 0·001; *P < 0·05 compared with the AIDWT group.
To evaluate whether AID mutation activity contributed to FANCA expression, genomic DNA was purified from AIDWT and AIDKO DLBCL cells, respectively. A 960‐bp segment of FANCA, located in the 1·5‐kb region downstream of the major transcription start site (TSS) was amplified, sequenced and analysed for point mutations, with 36 480 nucleotides of sequence. The mutation frequency for FANCA analysed from AIDWT cells provided 1·8 × 10–3 mutations per bp. Conversely, AIDKO cells yielded FANCA a mutation frequency of approximately 1·7 × 10–3 mutations per bp. Comparing these data, we conclude that FANCA mutation frequency shows an insignificant difference between AIDKO cells and AIDWT cells (Fig. 3d), suggesting that there is no close link between AID activity and FANCA expression in DLCBL cells.
Many experiments have reported that DNA methylation of cis‐elements comprised of promoters and enhancers controls gene expression 34, 35. We speculated that the FANCA promoter underwent demethylation in AIDWT cells which, in turn, regulated its expression. To test that this was the case, we analysed the methylation status of nine cytosine–phosphate–guanosine (CpG) sites located in –341 to –84 bp of the FANCA promoter. We showed that the demethylation level of these CpG sites clearly decreased in AIDKO DLBCL cells (Fig. 3e), indicating that the declined FANCA expression was associated with AID‐driven demethylation, but not to the mutation function of AID.
AID recruits TET2 to bind to FANCA promoter
Previous studies have shown AID‐mediated active DNA demethylation via TET2 26. To verify that AID associated with TET2 to control FANCA demethylation, we first examined whether TET2 affected FANCA expression. DMOG, a TET2 inhibitor, was used to deplete levels of TET2 of DLBCL cells (Fig. 4c, Supporting information, Fig. S2a). The mRNA and protein levels of FANCA were significantly decreased after DMOG treatment in DLBCL cells (P < 0·05) (Fig. 4a,b), indicating that TET2 involves FANCA expression. However, the AID level was not affected by TET2 depletion, in contrast to the decrease in TET2 following AID (Fig. 4b, Supporting information, Fig. S2b). These results imply that AID‐mediated FANCA demethylation might be through TET2.
Figure 4.

Activation‐induced cytidine deaminase (AID) recruits TET2 to bind to its promoter. (a) TET2 expression following AID deficiency was detected by immunoblot. (b) OCI‐LY7 cells were treated with DMOG (1500 µm) for 96 h in vitro; Fanconi anaemia complementation group A (FANCA) expression was detected by real‐time polymerase chain reaction (PCR). (c) OCI‐LY7 cells were treated as in (b), 10–11 translocation‐2 (TET2), AID and FANCA expression were detected by immunoblot. (d,e) Immunoblotting of TET2 and AID in purified extracts immunoprecipitation (IP) by anti‐AID (d) and anti‐TET2 (e). (f) DNA recovery in immunoprecipitates from chromatin immunoprecipitation (ChIP) experiments was measured by quantitative polymerase chain reaction (PCR) using primers that detect the FANCA promoter. (g) DNA recovery obtained as (f) was measured by PCR using primers that detect the FANCA promoter. Small horizontal lines indicate the mean [± standard deviation (s.d.)]. P‐values were analysed by two‐tailed t‐test with 95% confidence intervals. **P < 0·01 compared with the AIDWT group.
To designate whether AID and TET2 co‐resided in complexes, we performed IP experiments to reveal the association of AID and TET2. Preclearing of nuclear extracts using anti‐AID or anti‐TET2 removed the complexes without AID or TET2. The complexes hosted by anti‐AID showed the existence of TET2 (Fig. 4c). Furthermore, the TET2‐containing complexes hosted by anti‐TET2 revealed the existence of AID (Fig. 4d). The results suggest that AID and TET2 co‐reside in DLBCL cells to form complexes.
To investigate that AID and TET2 bound to FANCA promoter directly, ChIP assays were performed using antibodies against H3K4me3, AID and TET2. Immunoprecipitated and input DNA were analysed by qPCR with primers that amplify fragments in the FANCA promoter. It was noted that there was an obvious abundance of AID and TET2 in the H3K4me3 marked promoter of FANCA, which was consistent with AID targeting active chromatin. Following AID knock‐out, the enrichments of AID on the FANCA promoter reduced 16‐fold (P < 0·01), and TET2 dropped nearly 50‐fold (Fig. 4e,f). Taken together, we conclude that AID recruits TET2 to bind to the FANCA promoter.
Combination treatment by bortezomib, DMOG and AID depletion enhances DLBCL cell apoptosis
The proteasome inhibitor bortezomib is commonly used to inhibit tumour cell growth and was once reported to treat DLBCL 36, 37. Our data already suggest that deletion of AID and TET2 permit DLBCL cells to undergo apoptosis (Supporting information, Fig. S3), implying that these two proteins were probably to be new therapeutic targets for DLBCL. AIDWT and AIDKO cells were treated with DMOG for 91 h and bortezomib for 5 h, respectively. The cell apoptosis of both AIDWT and AIDKO DLBCL showed a gradient increase by DMOG, bortezomib and DMOG combined with bortezomib (P < 0·05) (Fig. 5a). However, the effect of these treatments on AIDKO cells was better than that on AIDWT cells (P < 0·05) (Fig. 5a). FANCA expression dropped with the decrease of AID and TET2 (P < 0·05) (Fig. 5b,c). Moreover, it was noted from the heat‐map that the expression of these apoptosis‐associated genes (namely: BOK, BID, BIK, BAD, BAK, PUMA, BIMEI, PMF and FAS) increased 10–17‐fold in AIDKO DLBCL cells treated by DMOG and bortezomib, while the decrease of the anti‐apoptosis gene (such as BCLW, BCL‐XL, BCL2, BCL6, A1, CFLIP, CLAP1, CLAP2 and MCL1) level varied 4–14‐fold (Fig. 5c). These results indicate significant treatment efficiency by combination treatment using DMOG, bortezomib and AID deficiency.
Figure 5.

In‐vitro‐cultured diffuse large B cell lymphoma (DLBCL) cells tend to be apoptotic after combination treatment with activation‐induced cytidine deaminase (AID) deficiency, dimethyloxaloylglycine (DMOG) and bortezomib. (a) OCI‐LY7 cells were cultured with DMOG (1·5 mM) treatment for 96 h, bortezomib (5 nM), with combined treatment by bortezomib (5 nM) for another 5 h, after being pretreated with DMOG (1·5 mM) for 91 h. Apoptosis of AIDWT (upper) and AIDKO (lower) was assessed by detecting signals of the apoptosis maker annexin V and 7‐aminoactinomycin D (7‐AAD) (left); and statistical diagram of percentage for apoptosis cells (right). Bor = bortezomib. (b) Relative Fanconi anaemia complementation group A (FANCA) mRNA expression in OCI‐LY7 cells treated as in (a) was detected by real time polymerase chain reaction (PCR). (c) Heat‐map for relative mRNA expression of AID, 10–11 translocation‐2 (TET2), anti‐apoptosis and apoptosis‐associated genes in OCI‐LY7 cells treated as in (a). Small horizontal lines indicate the mean [± standard deviation (s.d.)]. P‐values were analysed by two‐tailed t‐test with 95% confidence intervals; ***P < 0·001; **P < 0·01; *P < 0·05 compared with the AIDWT group.
Discussion
The mechanism of AID‐mediated lymphomagenesis is focused on chromosome translocations, which could be depicted as a highly active promoter or cis‐regulatory element, and can be juxtaposed to a proto‐oncogene, thereby deregulating its expression leading to malignant transformation 38, 39, 40, 41, 42. However, no direct assessment of AID protein‐activating proto‐oncogene has previously been performed in DLBCLs. In this study, our data demonstrate that the FANCA is highly expressed in DLBCL patients and cell lines, respectively. AID recruits TET2 to bind FANCA promoter to modulate demethylation. As a result, FANCA expression is increased in DLBCL. We develop a new therapeutic strategy to maximally induce DLBCL cell apoptosis by a combination of proteasome inhibitor bortezomib with AID and TET2 depletion. These findings identify a surprising and novel role for AID in active demethylation, but beyond AID mutation activity that involves oncogene activation in DLBCL.
Fanconi anaemia is a rare genetic disorder that can lead to bone marrow failure, congenital abnormalities and increased risk for leukaemia and cancer 32, 33, 43, 44. Fanconi anaemia is genetically heterogeneous, with 16 FANC genes (named A–Q) identified to date 45, 46. Cells with loss‐of‐function mutations in the FANC pathway are characterized by chromosome instability, which has the greatest potential to lead to oncogenic transformation 32, 43. Our results demonstrate that AID controls the expression of FANCA (one member of the FANC family) in the DLBCL cell line and patients (Fig. 3), consistent with the interpretation that over‐expressed AID not only increases the rates of physiological SHM and CSR, but also generates oncogenic gene activation and associated malignant transformation.
DNA methylation is understood to play a key role in regulation of gene expression specific to cell lineage and developmental stage of B cells and plays an important role in B cell lymphomagenesis 19, 20, 21. Previous studies have shown that changes in methylation are required for the successful formation of the GC and that such modifications are dependent on DNMT1, a methyltransferase highly expressed in the GCB 41, 42. The mechanism of DNA methylation gain is well understood. However, the mechanism of demethylation, the factors responsible for the loss of methylation in GCB and its biological significance remain almost completely unknown. As AID is highly expressed in the GCB and has been implicated in DNA demethylation during embryonic development and epigenetic reprogramming 18, 21, 45, 46, we examined the methylation status of FANCA promoter in AIDWT and AIDKO DLCBL cell lines, respectively. The level of demethylation is significantly higher in AIDWT than that in AIDKO DLCBL cell lines (Fig. 3e), but the point mutation frequency within –1 kb away from TSS sites on FANCA gene shows no difference between AIDKO and AIDWT cells. These data exclude that AID mutation activity contribute to FANCA demethylation in DLCBL cells (Fig. 3d). We argue that AID regulates FANCA demethylation beyond AID mutation activity.
Our data demonstrate that TET2 is also required for FANCA expression in DLBCL (Fig. 4a,b) because TET2 serves as a possible catalyst of the active demethylation process of tissue‐specific genes in post‐mitotic human monocytes. Additionally, TET2 has been found to bind PU.1 and EBF1 in the haematopoietic system 47, 48, 49. This information provides us with the clues to examine whether AID induced FANCA demethylation via TET2. Our immunoprecipitation (IP) experiments identify the co‐occupation of AID and TET2 in DLBCL (Fig. 4d,e). ChIP strongly confirms the direct binding of AID and TET2 to the FANCA promoter (Fig. 4f,g). On the basis of our findings and those of others, we propose the following model for AID regulating FANCA expression in DLBCL. First, AID recruits TET2 to the FANCA promoter to induce demethylation (Fig. 6a). Secondly, demethylated FANCA promoter increases its expression (Fig. 6b).
Figure 6.
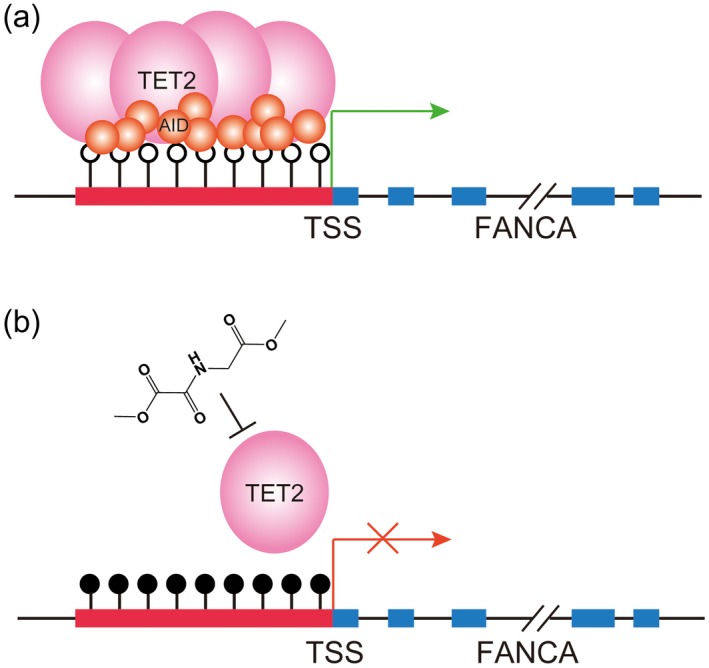
Model of activation‐induced cytidine deaminase (AID) recruiting 10–11 translocation‐2 (TET2) to bind to the Fanconi anaemia complementation group A (FANCA) promoter to mediate demethylation. (a) AID recruits TET2 to bind to the FANCA promoter and sequentially drive its demethylation and enhance FANCA expression. (b) AID deficiency and TET2 inhibition by dimethyloxaloylglycine (DMOG) compromise the demethylation of AID and TET2 to the FANCA promoter; the methylation status indicates the down‐regulation of FANCA expression.
DLBCL patients with relapsed/refractory disease failed to respond to traditional treatments such as R‐CHOP 50. Clinical therapeutic strategies for DLBCL by inhibiting or catalyzing degradation of cancer‐related proteins are well known 51, 52, 53. Our data indicate that up‐regulation of FANCA may be a driver to the pathogenesis of DLBCL. Taking FANCA as a target for gene therapy for DLBCL, we adopt the method to deplete the FANCA by inhibiting its regulator AID and TET2 simultaneously. The combination treatment of AID depletion, TET2 inhibition and bortezomib clearly down‐regulates the FANCA level and induces the apparent apoptosis of DLBCL cells (Fig. 5). Therefore, blocking several crucial proteins such as AID and TET2 together would be a potentially efficient treatment of DLBCL patients.
In conclusion, our data clearly demonstrate that AID and TET2 co‐operation regulates FANCA expression by active demethylation. In addition, compound AID and TET2 blockade and bortezomib treatment induces DLBCL cell apoptosis. Our findings provide a novel functional role for AID‐mediated active demethylation involved oncogenic FANCA expression in DLBCL and help to develop a new therapeutic strategy for DLBCL patients.
Disclosures
The authors have no conflicts of interest.
Supporting information
Fig. S1. Hematoxylin‐eosin staining of lymph nodes from three DLBCL patients.
Fig. S2. AID depletion up‐regulates pro‐apoptosis genes, while down‐regulates anti‐apoptosis gene expression.
Fig. S3. TET2 inhibition after DMOG treatment. OCI‐LY7 cells were treated with DMOG (1500um) for 96 hours in vitro, the inhibition of TET2 expression was detected by real time PCR. Small horizontal lines indicate the mean (±SD). P values were analyzed with two‐tailed t‐test with 95% confidence intervals. *P < 0·05 compared with the AIDWT group.
Fig. S4. AID and TET2 collaboration promote BCL6 and PIM1 expression by binding to their promoter in OCI‐LY7 cells. (a) OCI‐LY7 cells were culture with DMOG (1.500 mM) treatment for 96 hours. Apoptosis of AIDWT OCI‐LY7 cells was assessed by detecting signals of the apoptosis maker annexin V and 7‐AAD. (b) Statistical diagram of percentage for apoptosis cells as treated in (a). Small horizontal lines indicate the mean (±SD). P values were analyzed with two‐tailed t‐test with 95% confidence intervals. ***P < 0·001 compared with the AIDWT group.
Table S1. The sequence of gRNAs for Crispr/Cas9 targeting AID.
Table S2. The sequences of primers used for quantity real time.
Table S3. The primer sequences used in PCR for amplifying FANCA promoter fragments from genome DNA being treated by bisulfite.
Table S4. The primer sequences used in PCR for amplifying ‐920 bp fragments away from TSS on from FANCA genome DNA.
Table S5. The primer sequences used in qPCR for ChIP.
Acknowledgements
This work was supported in part by the grants from the National Natural Science Foundation of China (31170821, 31370874 and 81670157) and the Natural Scientific Foundation of Shaanxi (no. 2016JZ030). We thank Dr Junjie Zhang (University of Southern California) for providing pL‐CRISPR.EFS.PAC plasmids. Y. J. designed the experiments. J. J. and Y. J. performed the experiments. M. Z., H. Z. and M. Y. collected and stored the materials. Z. L. assisted the animal experiment. X. Y., P. Z. and C. L. provided the analysis software. W. O. and Y. M. corrected the manuscript. Y. J. and J. J. wrote the manuscript.
References
- 1. Skrabek P, Turner D, Seftel M. Epidemiology of non‐Hodgkin lymphoma. Transfus Apher Sci 2013; 49:133–8. [DOI] [PubMed] [Google Scholar]
- 2. Iqbal J, Shen Y, Huang X et al Global microRNA expression profiling uncovers molecular markers for classification and prognosis in aggressive B‐cell lymphoma. Blood 2015; 125:1137–45. [DOI] [PMC free article] [PubMed] [Google Scholar]
- 3. Lenz G, Davis RE, Ngo VN et al Oncogenic CARD11 mutations in human diffuse large B cell lymphoma. Science 2008; 319:1676–9. [DOI] [PubMed] [Google Scholar]
- 4. Rosenwald A, Wright G, Chan WC et al The use of molecular profiling to predict survival after chemotherapy for diffuse large‐B‐cell lymphoma. N Engl J Med 2002; 346:1937–47. [DOI] [PubMed] [Google Scholar]
- 5. Compagno M, Lim WK, Grunn A et al Mutations of multiple genes cause deregulation of NF‐kappaB in diffuse large B‐cell lymphoma. Nature 2009; 459:717–21. [DOI] [PMC free article] [PubMed] [Google Scholar]
- 6. Mandelbaum J, Bhagat G, Tang H et al BLIMP1 is a tumor suppressor gene frequently disrupted in activated B cell‐like diffuse large B cell lymphoma. Cancer Cell 2010; 18:568–79. [DOI] [PMC free article] [PubMed] [Google Scholar]
- 7. Muramatsu M, Sankaranand VS, Anant S et al Specific expression of activation‐induced cytidine deaminase (AID), a novel member of the RNA‐editing deaminase family in germinal center B cells. J Biol Chem 1999; 274:18470–6. [DOI] [PubMed] [Google Scholar]
- 8. Methot SP, Di NJM. Molecular mechanisms of somatic hypermutation and class switch recombination. Adv Immunol 2017; 133:37–87. [DOI] [PubMed] [Google Scholar]
- 9. Alt FW, Zhang Y, Meng FL, Guo C, Schwer B. Mechanisms of programmed DNA lesions and genomic instability in the immune system. Cell 2013; 152:417–29. [DOI] [PMC free article] [PubMed] [Google Scholar]
- 10. Alvarez‐Prado AF, Perez‐Duran P, Benguria A et al A broad atlas of somatic hypermutation allows prediction of activation‐induced deaminase targets. J Exp Med 2018; 215:761–71. [DOI] [PMC free article] [PubMed] [Google Scholar]
- 11. Liu M, Duke JL, Richter DJ et al Two levels of protection for the B cell genome during somatic hypermutation. Nature 2008; 451:841–5. [DOI] [PubMed] [Google Scholar]
- 12. Lossos IS, Levy R, Alizadeh AA. AID is expressed in germinal center B‐cell‐like and activated B‐cell‐like diffuse large‐cell lymphomas and is not correlated with intraclonal heterogeneity. Leukemia 2004; 18:1775–9. [DOI] [PubMed] [Google Scholar]
- 13. Cerchietti LC, Hatzi K, Caldas‐Lopes E et al BCL6 repression of EP300 in human diffuse large B cell lymphoma cells provides a basis for rational combinatorial therapy. J Clin Invest 2010; 120:4569–82. [DOI] [PMC free article] [PubMed] [Google Scholar]
- 14. Yang X, Lee K, Said J, Gong X, Zhang K. Association of Ig/BCL6 translocations with germinal center B lymphocytes in human lymphoid tissues: implications for malignant transformation. Blood 2006; 108:2006–12. [DOI] [PMC free article] [PubMed] [Google Scholar]
- 15. Yamamoto K, Okamura A, Inui Y et al IGH@/BCL6 rearrangement on the der(3)t(3;14)(q27;q32) in primary mediastinal large B‐cell lymphoma. Leuk Res 2012; 36:e218–21. [DOI] [PubMed] [Google Scholar]
- 16. Inbar‐Feigenberg M, Choufani S, Butcher DT, Roifman M, Weksberg R. Basic concepts of epigenetics. Fertil Steril 2013; 99:607–15. [DOI] [PubMed] [Google Scholar]
- 17. Kanwal R, Gupta K, Gupta S. Cancer epigenetics: an introduction. Methods Mol Biol 2015; 1238:3–25. [DOI] [PubMed] [Google Scholar]
- 18. Rai K, Huggins IJ, James SR, Karpf AR, Jones DA, Cairns BR. DNA demethylation in zebrafish involves the coupling of a deaminase, a glycosylase, and gadd45. Cell 2008; 135:1201–12. [DOI] [PMC free article] [PubMed] [Google Scholar]
- 19. Wahlfors J, Hiltunen H, Heinonen K et al Genomic hypomethylation in human chronic lymphocytic leukemia. Blood 1992; 80:2074–80. [PubMed] [Google Scholar]
- 20. Kulis M, Heath S, Bibikova M et al Epigenomic analysis detects widespread gene‐body DNA hypomethylation in chronic lymphocytic leukemia. Nat Genet 2012; 44:1236–42. [DOI] [PubMed] [Google Scholar]
- 21. Chambwe N, Kormaksson M, Geng H et al Variability in DNA methylation defines novel epigenetic subgroups of DLBCL associated with different clinical outcomes. Blood 2014; 123:1699–708. [DOI] [PMC free article] [PubMed] [Google Scholar]
- 22. Qian J, Wang Q, Dose M et al B cell super‐enhancers and regulatory clusters recruit AID tumorigenic activity. Cell 2014; 159:1524–37. [DOI] [PMC free article] [PubMed] [Google Scholar]
- 23. Meng FL, Du Z, Federation A et al Convergent transcription at intragenic super‐enhancers targets AID‐initiated genomic instability. Cell 2014; 159:1538–1548. [DOI] [PMC free article] [PubMed] [Google Scholar]
- 24. Dominguez PM, Teater M, Chambwe N et al DNA methylation dynamics of germinal center B cells are mediated by AID. Cell Rep 2015; 12:2086–98. [DOI] [PMC free article] [PubMed] [Google Scholar]
- 25. Tsai AG, Lu H, Raghavan SC, Muschen M, Hsieh CL, Lieber MR. Human chromosomal translocations at CpG sites and a theoretical basis for their lineage and stage specificity. Cell 2008; 135:1130–42. [DOI] [PMC free article] [PubMed] [Google Scholar]
- 26. Ito S, D’Alessio AC, Taranova OV, Hong K, Sowers LC, Zhang Y. Role of Tet proteins in 5mC to 5hmC conversion, ES‐cell self‐renewal and inner cell mass specification. Nature 2010; 466:1129–33. [DOI] [PMC free article] [PubMed] [Google Scholar]
- 27. Solary E, Bernard OA, Tefferi A, Fuks F, Vainchenker W. The ten‐eleven translocation‐2 (TET2) gene in hematopoiesis and hematopoietic diseases. Leukemia 2014; 28:485–96. [DOI] [PubMed] [Google Scholar]
- 28. Nakajima H, Kunimoto H. TET2 as an epigenetic master regulator for normal and malignant hematopoiesis. Cancer Sci 2014; 105:1093–9. [DOI] [PMC free article] [PubMed] [Google Scholar]
- 29. Ji Y, Resch W, Corbett E, Yamane A, Casellas R, Schatz DG. The in vivo pattern of binding of RAG1 and RAG2 to antigen receptor loci. Cell 2010; 141:419–31. [DOI] [PMC free article] [PubMed] [Google Scholar]
- 30. Ji Y, Little AJ, Banerjee JK et al Promoters, enhancers, and transcription target RAG1 binding during V(D)J recombination. J Exp Med 2010; 207:2809–16. [DOI] [PMC free article] [PubMed] [Google Scholar]
- 31. Nguyen TV, Riou L, Aoufouchi S, Rosselli F. Fanca deficiency reduces A/T transitions in somatic hypermutation and alters class switch recombination junctions in mouse B cells. J Exp Med 2014; 211:1011–8. [DOI] [PMC free article] [PubMed] [Google Scholar]
- 32. Joenje H, Patel KJ. The emerging genetic and molecular basis of Fanconi anaemia. Nat Rev Genet 2001; 2:446–57. [DOI] [PubMed] [Google Scholar]
- 33. Nalepa G, Clapp DW. Fanconi anaemia and cancer: an intricate relationship. Nat Rev Cancer 2018; 8:168–85. [DOI] [PubMed] [Google Scholar]
- 34. De Carvalho DD, You JS, Jones PA. DNA methylation and cellular reprogramming. Trends Cell Biol 2010; 20:609–17. [DOI] [PMC free article] [PubMed] [Google Scholar]
- 35. Deaton AM, Bird A. CpG islands and the regulation of transcription. Genes Dev 2011; 25:1010–22. [DOI] [PMC free article] [PubMed] [Google Scholar]
- 36. Offner F, Samoilova O, Osmanov E et al Frontline rituximab, cyclophosphamide, doxorubicin, and prednisone with bortezomib (VR‐CAP) or vincristine (R‐CHOP) for non‐GCB DLBCL. Blood 2015; 126:1893–901. [DOI] [PMC free article] [PubMed] [Google Scholar]
- 37. Bu R, Hussain AR, Al‐Obaisi KA, Ahmed M, Uddin S, Al‐Kuraya KS. Bortezomib inhibits proteasomal degradation of IkappaBalpha and induces mitochondrial dependent apoptosis in activated B‐cell diffuse large B‐cell lymphoma. Leuk Lymph 2014; 55:415–24. [DOI] [PubMed] [Google Scholar]
- 38. Lu Z, Tsai AG, Akasaka T et al BCL6 breaks occur at different AID sequence motifs in Ig‐BCL6 and non‐Ig‐BCL6 rearrangements. Blood 2013; 121:4551–4. [DOI] [PMC free article] [PubMed] [Google Scholar]
- 39. Robbiani DF, Bunting S, Feldhahn N et al AID produces DNA double‐strand breaks in non‐Ig genes and mature B cell lymphomas with reciprocal chromosome translocations. Mol Cell 2009; 36:631–41. [DOI] [PMC free article] [PubMed] [Google Scholar]
- 40. Akay OM, Aras BD, Isiksoy S et al BCL2, BCL6, IGH, TP53, and MYC protein expression and gene rearrangements as prognostic markers in diffuse large B‐cell lymphoma: a study of 44 Turkish patients. Cancer Genet 2014; 207:87–93. [DOI] [PubMed] [Google Scholar]
- 41. Reik W, Dean W, Walter J. Epigenetic reprogramming in mammalian development. Science 2001; 293:1089–93. [DOI] [PubMed] [Google Scholar]
- 42. Surani MA. Reprogramming of genome function through epigenetic inheritance. Nature 2001; 414:122–8. [DOI] [PubMed] [Google Scholar]
- 43. Kottemann MC, Smogorzewska A. Fanconi anaemia and the repair of Watson and Crick DNA crosslinks. Nature 2013; 493:356–63. [DOI] [PMC free article] [PubMed] [Google Scholar]
- 44. Dokal I. Fanconi's anaemia and related bone marrow failure syndromes. Br Med Bull 2006; 77–78:37–53. [DOI] [PubMed] [Google Scholar]
- 45. Bhutani N, Brady JJ, Damian M, Sacco A, Corbel SY, Blau HM. Reprogramming towards pluripotency requires AID‐dependent DNA demethylation. Nature 2010; 463:1042–7. [DOI] [PMC free article] [PubMed] [Google Scholar]
- 46. Popp C, Dean W, Feng S et al Genome‐wide erasure of DNA methylation in mouse primordial germ cells is affected by AID deficiency. Nature 2010; 463:1101–5. [DOI] [PMC free article] [PubMed] [Google Scholar]
- 47. Lio CW, Zhang J, González‐Avalos E et al Tet2 and Tet3 cooperate with B‐lineage transcription factors to regulate DNA modification and chromatin accessibility. Elife 2016; 5:e18290. [DOI] [PMC free article] [PubMed] [Google Scholar]
- 48. Guilhamon P, Eskandarpour M, Halai D et al Meta‐analysis of IDH‐mutant cancers identifies EBF1 as an interaction partner for TET2. Nat Commun 2013; 4:2166. [DOI] [PMC free article] [PubMed] [Google Scholar]
- 49. Hajkova P, Erhardt S, Lane N et al Epigenetic reprogramming in mouse primordial germ cells. Mech Dev 2002; 117:15–23. [DOI] [PubMed] [Google Scholar]
- 50. Parekh S, Prive G, Melnick A. Therapeutic targeting of the BCL6 oncogene for diffuse large B‐cell lymphomas. Leuk Lymph 2008; 49:874–82. [DOI] [PMC free article] [PubMed] [Google Scholar]
- 51. Cerchietti LC, Ghetu AF, Zhu X et al A small‐molecule inhibitor of BCL6 kills DLBCL cells in vitro and in vivo . Cancer Cell 2010; 7:400–11. [DOI] [PMC free article] [PubMed] [Google Scholar]
- 52. Kerres N, Steurer S, Schlager S et al Chemically induced degradation of the oncogenic transcription factor BCL6. Cell Rep 2017; 20:2860–75. [DOI] [PubMed] [Google Scholar]
- 53. Wagner SD, Ahearne M, Ko FP. The role of BCL6 in lymphomas and routes to therapy. Br J Haematol 2011; 152:3–12. [DOI] [PubMed] [Google Scholar]
Associated Data
This section collects any data citations, data availability statements, or supplementary materials included in this article.
Supplementary Materials
Fig. S1. Hematoxylin‐eosin staining of lymph nodes from three DLBCL patients.
Fig. S2. AID depletion up‐regulates pro‐apoptosis genes, while down‐regulates anti‐apoptosis gene expression.
Fig. S3. TET2 inhibition after DMOG treatment. OCI‐LY7 cells were treated with DMOG (1500um) for 96 hours in vitro, the inhibition of TET2 expression was detected by real time PCR. Small horizontal lines indicate the mean (±SD). P values were analyzed with two‐tailed t‐test with 95% confidence intervals. *P < 0·05 compared with the AIDWT group.
Fig. S4. AID and TET2 collaboration promote BCL6 and PIM1 expression by binding to their promoter in OCI‐LY7 cells. (a) OCI‐LY7 cells were culture with DMOG (1.500 mM) treatment for 96 hours. Apoptosis of AIDWT OCI‐LY7 cells was assessed by detecting signals of the apoptosis maker annexin V and 7‐AAD. (b) Statistical diagram of percentage for apoptosis cells as treated in (a). Small horizontal lines indicate the mean (±SD). P values were analyzed with two‐tailed t‐test with 95% confidence intervals. ***P < 0·001 compared with the AIDWT group.
Table S1. The sequence of gRNAs for Crispr/Cas9 targeting AID.
Table S2. The sequences of primers used for quantity real time.
Table S3. The primer sequences used in PCR for amplifying FANCA promoter fragments from genome DNA being treated by bisulfite.
Table S4. The primer sequences used in PCR for amplifying ‐920 bp fragments away from TSS on from FANCA genome DNA.
Table S5. The primer sequences used in qPCR for ChIP.