

Abstract
Background
Past reports suggested that total‐body irradiation at 0.5 to 1.0 Gy could be responsible for atherosclerosis. Peripheral artery disease (PAD) is a manifestation of systematic atherosclerosis. Whether the consequences of a low‐to‐moderate dose of radiation include increased risk of PAD remains to be determined. The purpose of this study was to examine the association between radiation exposure and prevalence of PAD among Japanese atomic bomb survivors.
Methods and Results
Radiation exposure from the atomic bombing was assessed in 3476 participants (41.1% men, mean age 74.8 years with SD 6.4 years) with a cross‐sectional survey in 2010 to 2014. Left‐ and right‐side ankle‐brachial indexes and upstroke time (UT) were obtained using oscillometric VP‐2000. PAD was defined as an ankle‐brachial index of 1.0 or less or a prior history related to revascularization. UT was considered a sensitive marker of early‐stage PAD. Association between radiation exposure and PAD or UT was assessed using multivariable regression analyses with adjustment for potential confounding factors. Of 3476 participants, 79 (2.3%) were identified as having prevalent PAD. Multivariate logistic regression analysis indicated that radiation dose was unrelated to PAD prevalence (odds ratio, 0.83; 95% confidence interval [0.57‐1.21]). UT appeared to increase with radiation dose, but the increase was not statistically significant (1.09 ms/Gy; 95% confidence interval [−0.17 to 2.36]).
Conclusions
We found no clear association of radiation dose with PAD, but it remains to be determined whether UT is associated with radiation dose.
Keywords: peripheral artery disease, radiation risk
Subject Categories: Epidemiology, Cardiovascular Disease
Clinical Perspective
What Is New?
Our study of Japanese atomic‐bomb survivors with <4 Gy whole‐body radiation exposures is the first to investigate the long‐term risk of peripheral artery disease after irradiation.
A relationship between radiation exposure and the prevalence of peripheral artery disease was not evident.
Prolonged upstroke time, a sensitive marker for stenosis, was correlated with radiation dose, but the association was not statistically significant (P=0.091).
What Are the Clinical Implications?
Widespread use of radiographic procedures in medicine has led to concerns over possible cardiovascular effects.
Whether there is a risk of peripheral artery disease after low‐to‐moderate irradiation has been unclear.
A radiation dose response for upstroke time could not be ruled out and warrants further study.
Epidemiological studies of the atomic bomb survivors have reported that low‐to‐moderate high‐dose‐rate radiation exposures are associated with an elevated risk of cardiovascular disease.1, 2 In contrast, inconsistent results have been reported from studies of low‐to‐moderate irradiated populations in low‐dose‐rate occupational and environmental settings,3, 4 so the effects of lower doses of radiation on cardiovascular disease outcomes are not yet clear. Estimated disease risks do not directly address questions regarding radiation‐related tissue effects, knowledge of which is important for establishing a causal association.
Peripheral artery disease (PAD), together with coronary artery disease and cerebrovascular disease, develops as polyvascular atherosclerosis. Atherosclerosis is an inflammatory process associated with endothelial damage and dysfunction, and it is the major cause of vascular death. One pathway leading to atherosclerosis development might be shared with radiation‐related tissue effects in the circulatory system.5 Development of systemic atherosclerosis or PAD subsequent to radiation exposure may be plausible,6 although such an association has not been investigated thoroughly. It has been demonstrated that a more sensitive tool is needed to assess population rates of lower‐extremity PAD.
Our aim was to examine the association between radiation dose and PAD prevalence among atomic bomb survivors in the AHS (Adult Health Study) from the Radiation Effects Research Foundation between 2010 and 2014. This is the first clinical survey of survivors, made with noninvasive ankle‐brachial blood pressure index, allowing us to properly investigate radiation‐related PAD prevalence.
Methods
The data, analytic methods, and study materials will not be made available to other researchers for purposes of reproducing the results or replicating the procedure.
Participants
The Radiation Effects Research Foundation established in 1958 the AHS cohort of 19 961 survivors of the atomic bombings of Hiroshima and Nagasaki. Along with complete follow‐up with respect to death (based on vital statistics data), health examinations have been performed biennially, and >70% of the cohort continue to reside in areas accessible to our facilities and continue to participate. Participants in this study were divided into 2 groups: the primary cohort, which consists of the original‐ and extended‐AHS cohort members whose health examinations started from 1958 or 1977, respectively, and an expansion of the cohort comprising 1961 survivors exposed to atomic‐bomb radiation at less than 10 years of age, which was added in 2008 to augment the study of effects of low‐to‐moderate doses.7, 8 In addition to the summary of all participants (Table 1), the features of the two groups are compared (Table 2).
Table 1.
Baseline Characteristics Across Radiation Dose Categories: The Adult Health Study (N=3476)
| Covariates | Overall | DS02 R1 Skin Dose [Gy] | P Value for Homogeneity Testa | |||||
|---|---|---|---|---|---|---|---|---|
| Dose unknown | 0 to <0.005 | 0.005 to <0.5 | 0.5 to <1 | 1 to <2 | 2+ | |||
| (n=3476) | (n=259) | (n=1136) | (n=1512) | (n=242) | (n=228) | (n=99) | ||
| Mean (SD) | Mean (SD) | Mean (SD) | Mean (SD) | Mean (SD) | Mean (SD) | Mean (SD) | ||
| Age, y | 74.8 (6.4) | 80.4 (5.8) | 75.2 (6.3) | 72.6 (5.3) | 76.9 (7.0) | 77.8 (6.5) | 76.4 (7.0) | <0.001 |
| Age at radiation exposure, y | 8.5 (6.2) | 14.5 (5.6) | 8.9 (6.1) | 6.3 (5.1) | 10.7 (6.8) | 11.5 (6.5) | 10.0 (6.8) | <0.001 |
| Body mass index, kg/m2 | 22.9 (3.4) | 22.3 (3.35) | 23.0 (3.5) | 23.1 (3.3) | 22.9 (3.0) | 22.2 (3.7) | 22.2 (3.1) | <0.001 |
| Systolic blood pressure, mm Hg | 132.1 (17.4) | 134.4 (17.7) | 132.5 (17.0) | 131.0 (17.1) | 132.4 (17.8) | 132.3 (19.3) | 136.3 (17.3) | 0.0034 |
| Diastolic blood pressure, mm Hg | 73.9 (10.4) | 71.4 (10.1) | 74.2 (10.6) | 74.9 (10.2) | 73.0 (9.9) | 70.2 (11.1) | 71.3 (10.2) | <0.001 |
| Total cholesterol, mm Hg | 203.8 (34.1) | 199.7 (30.9) | 202.4 (34.9) | 207.5 (34.2) | 198.5 (33.0) | 199.2 (32.3) | 199.5 (34.8) | <0.001 |
| HDL‐cholesterol, mg/dL | 59.5 (15.4) | 58.8 (15.2) | 59.4 (15.3) | 60.4 (15.5) | 57.3 (14.5) | 59.4 (15.2) | 56.4 (16.1) | 0.0137 |
| LDL‐cholesterol, mg/dL | 115.2 (28.9) | 111.9 (26.1) | 114.1 (28.9) | 118.0 (29.3) | 112.3 (28.0) | 111.5 (28.5) | 112.2 (28.2) | <0.001 |
| Triglyceride, g/dL | 122.0 (69.3) | 111.7 (55.4) | 118.3 (63.3) | 124.7 (73.4) | 128.2 (65.3) | 119.0 (70.2) | 142.9 (91.9) | <0.001 |
| White blood cell, ×100/dL | 55.3 (15.7) | 53.0 (13.4) | 54.7 (15.5) | 55.6 (16.0) | 56.4 (14.8) | 56.0 (18.2) | 57.8 (15.6) | 0.0372 |
| C‐reactive protein, μg/L | 0.18 (0.65) | 0.19 (0.54) | 0.18 (0.55) | 0.16 (0.36) | 0.28 (1.77) | 0.22 (0.53) | 0.17 (0.36) | 0.1856 |
| HbA1c, % | 6.13 (0.75) | 6.07 (0.64) | 6.08 (0.71) | 6.15 (0.78) | 6.18 (0.85) ( | 6.14 (0.7) | 6.32 (0.94) | 0.0139 |
| Upstroke time, ms | 144.3 (23.9) | 146.2 (23.1) | 143.0 (23.0) | 143.8 (23.2 ) | 146.9 (26.7) | 147.9 (27.8 ) | 150.7 (29.5) | 0.0036 |
| Ankle‐brachial index | 1.13 (0.07) | 1.14 (0.08) | 1.14 (0.07) | 1.13 (0.07) | 1.14 (0.07) | 1.13 (0.07) | 1.13 (0.08) | 0.1956 |
| Estimated GFR, mL/min per 1.73 m2 | 67.5 (16.9) | 62.9 (17.1) | 67.0 (17.0) | 69.3 (15.9) | 65.9 (18.1) | 64.8 (17.8) | 66.4 (20.8) | <0.001 |
| n (%) | n (%) | n (%) | n (%) | n (%) | n (%) | n (%) | n (%) | |
| Male sex | 1427 (41.1) | 84 (32.4) | 457 (40.2) | 661 (43.7 ) | 87 (36.0) | 96 (42.1) | 42 (42.4) | 0.0085 |
| Diabetes mellitus | 754 (21.7) | 51 (19.7) | 228 (20.1) | 339 (22.4) | 53 (21.9) | 51 (22.4) | 32 (32.3) | 0.0908 |
| Hypertension | 2288 (65.8) | 183 (70.7) | 761 (67.0) | 933 (61.7) | 178 (73.6) | 161 (70.6) | 72 (72.7) | <0.001 |
| Dyslipidemia | 2264 (65.1) | 149 (57.5) | 716 (63.0) | 1032 (68.3) | 161 (66.5) | 138 (60.5) | 68 (68.7) | 0.0027 |
| Smoking status | ||||||||
| Never | 2044 (59.0) | 173 (66.8) | 669 (59.1) | 868 (57.5) | 150 (62.2) | 129 (57.3) | 55 (55.6) | 0.0184 |
| Past | 1130 (32.6) | 74 (28.6) | 370 (32.7) | 495 (32.8) | 71 (29.5) | 78 (34.7) | 42 (42.4) | |
| Current | 291 (8.4) | 12 (4.6) | 93 (8.2) | 146 (9.7) | 20 (8.3) | 18 (8.0) | 2 (2.0) | |
Continuous variables are summarized by the mean (SD); categorical data are summarized by participant number and proportion (%). GFR indicates glomerular filtration rate; HbA1c, hemoglobin A1c; HDL, high‐density lipoprotein; LDL, low‐density lipoprotein.
P values are from χ2 tests for the equality of proportions or t tests for the equality of means.
Table 2.
Variable Distributions in the Primary Cohort and the Expansion Group
| Primary Cohort | Expansion Group | P Value for Homogeneity testa | |
|---|---|---|---|
| (n=1788) | (n=1688) | ||
| Mean (SD) | Mean (SD) | ||
| Total cholesterol, mg/dL | 200.05 (34.45) | 207.93 (33.87) | <0.001 |
| HDL‐cholesterol, mg/dL | 58.28 (15.08) | 60.77 (15.55) | <0.001 |
| LDL‐cholesterol, mg/dL | 112.77 (28.61) | 118.02 (29.28) | <0.001 |
| Triglyceride | 120.97 (66.11) | 124.54 (73.27) | 0.0429 |
| White blood cell count, ×100/dL | 55.48 (15.79) | 55.38 (15.96) | 0.6708 |
| hsCRP, μg/L | 0.19 (0.49) | 0.18 (0.77) | 0.5564 |
| HbA1c, % | 6.10 (0.75) | 6.16 (0.77) | 0.0194 |
| Age at examination, y | 78.24 (6.57) | 70.72 (2.69) | <0.001 |
| Age at radiation exposure, y | 11.80 (6.40) | 4.53 (2.60) | <0.001 |
| Body mass index, kg/m2 | 22.69 (3.46) | 23.22 (3.28) | <0.001 |
| Upstroke time | 147.87 (26.60) | 141.19 (21.15) | <0.001 |
| Ankle‐brachial index | 1.13 (0.07) | 1.14 (0.07) | 0.092 |
| Systolic blood pressure, mm Hg | 133.55 (17.94) | 130.32 (16.58) | <0.001 |
| Diastolic blood pressure, mm Hg | 72.25 (10.93) | 75.75 (9.69) | <0.001 |
| estimate GFR, mL/min per 1.73 m2 | 65.09 (17.89) | 70.29 (15.36) | <0.001 |
| Hiroshima, % | 54.2 | 68.1 | <0.001 |
| Diabetes mellitus, % | 21.5 | 21.9 | 0.8147 |
| Hypertension, % | 70.9 | 60.5 | <0.001 |
| Dyslipidemia, % | 63.4 | 67.0 | 0.0246 |
| Never, % | 61.5 | 56.3 | <0.001 |
| Ever, % | 32.0 | 33.3 | |
| Current, % | 6.5 | 10.4 |
Continuous variables are summarized by the mean and SD; categorical data are summarized by the participant number and proportion (%). GFR indicates glomerular filtration rate; HbA1c, hemoglobin A1c; HDL, high‐density lipoprotein; hsCRP, high‐sensitivity C‐reactive protein; LDL, low‐density lipoprotein.
P values are from χ2 tests for the equality of proportions or t tests for the equality of means.
During the period 2010 to 2014, 3757 participants were scheduled for inclusion in this study, where 8 people known to be undergoing hemodialysis were not invited to participate because placing cuffs on their upper extremities in the conduct of the study might result in vascular access‐related complications. Because 281 invited people refused, there were 3476 people who participated (92.5% participation). Because radiation dose estimates were missing for 259 participants, 3217 participants were available for analyses. The study protocol was approved by the institutional review board of the Radiation Effects Research Foundation, and all participants gave written informed consent.
Ankle‐Brachial Index, Upstroke Time, and Prevalent PAD
Ankle‐brachial index (ABI) is the ratio of systolic blood pressure in the ankle to that in the arm. A randomly assigned technician obtained the ABI by using an automated oscillometric device, VP‐2000 (Omron Healthcare, Kyoto, Japan). The measurement protocol and data validation for ABI are described elsewhere.9 Prevalent PAD was declared if a participant met either of 2 criteria: (1) ABI≤1.0, including borderline ABI (0.91–0.9910); and (2) a self‐reported prior history of revascularization identified by International Classification of Diseases, Tenth Revision (ICD‐10) codes I70.2 and I70.9 stored in our clinical‐examination database. Leg symptoms were not considered in the PAD diagnosis. Because prolonged upstroke time (UT) from pulse wave analysis using VP‐2000 has not been established as a diagnostic criteria for PAD,11 in the current study we considered prolonged UT merely as a marker of arterial damage.
Atherosclerosis Risk Factors and Cardiovascular Disease
Potential confounding variables included smoking history, systolic and diastolic blood pressure, high‐sensitivity C‐reactive protein, white blood cell count, body mass index, nonfasting total cholesterol, low‐density lipoprotein cholesterol, high‐density lipoprotein cholesterol, triglycerides, estimated glomerular filtration rate (based on serum creatinine level), and indicators of 3 existing clinical conditions: hypertension, diabetes mellitus, and dyslipidemia. People with any of the latter 3 clinical conditions were also surveyed as to whether or not they were taking medication for treatment of these disorders. Smoking status was defined as never, past, or current. Body mass index (kg/m2) was calculated from the participant's height and weight at the examination. The high‐sensitivity C‐reactive protein and serum creatinine levels were determined by using a chemiluminescent ELISA (Nissui, Tokyo, Japan); all measurements were made according to an automated procedure (Hitachi 7170S; Hitachi Ltd, Tokyo, Japan) under defined quality control criteria. Estimated glomerular filtration rate was derived from serum creatinine level using the formula [194×creatinine−1.094×Age−0.287 (×0.739 only for women)].12 Hypertension was defined as having auscultatory systolic blood pressure ≥140 mm Hg, having diastolic blood pressure ≥90 mm Hg, or being under treatment for high blood pressure. Diabetes mellitus was diagnosed according to the American Diabetes Association criteria, which are as follows: a fasting plasma glucose level ≥126 mg/dL (or ≥200 mg/dL after a fasting period of <10 hours); a hemoglobin A1c level ≥6.5%; the use of diabetes medications; or a history of diabetic retinopathy, neuropathy, or nephropathy.13 Dyslipidemia was defined as having a nonfasting serum total cholesterol level ≥220 mg/dL, low‐density lipoprotein cholesterol level ≥140 mg/dL, high‐density lipoprotein cholesterol level <40 mg/dL, triglyceride level ≥150 mg/dL under fasting condition (or ≥300 mg/dL after <10‐hour fast), or being under treatment.
Radiation Dose
The estimated radiation dose received by each participant was based on the updated dosimetry system (DS02R1), which takes into account physical location and orientation at the time of the bombing as well as body shielding by terrain and organ shielding by the body.14, 15 For all analyses, skin dose (shielded kerma, or whole‐body, dose) was used in units of weighted gray (Gy), where the dose to an individual is the sum of γ ray dose plus 10 times the smaller neutron dose. Skin dose was selected a priori, assuming that total body irradiation may affect the entire vascular system, so that it is difficult to identify a single organ dose that is appropriate. A similar systemic effect is assumed for atherosclerosis risk factors.
Statistical Analysis
The χ2 test was used to compare demographic characteristics across dose categories. The relationship of PAD to covariates was assessed with logistic regression. That of UT was analyzed with a bivariate linear regression model fit with the generalized estimating equation approach allowing for correlation between UT in left and right lower legs. Covariates were centered at their sample means and scaled to reflect clinically meaningful units of change. Multivariate regression models for both outcomes were selected by stepwise elimination of the least‐significant effect with P≤0.05 at each step. After we arrived at the final model, we re‐tested each removed covariate one‐by‐one and found that none should be re‐entered. A nonparametric dose–response curve, the fractional polynomial plot, was constructed for radiation dose with predicted values of mean UT (mean of left and right measurements) and residuals from an ordinary linear‐regression model with adjustment for all other relevant covariates. Predicted values were also examined based on dose groups defined with cut points of 0, 0.001, 0.01, 0.1, 0.2, 0.5, 1.0, and 2.0 Gy. To determine whether the effect of a clinical condition on outcome is modified by therapeutic intervention, interaction variables were added to the regression analyses. The interaction variables were products of an indicator of each clinical condition (yes [1] or no [0] for hypertension, diabetes mellitus, and dyslipidemia) and history of medication (yes [1] or no [0]) for that condition. We performed 2 types of analysis: 1 a complete‐record analysis, where participants with missing values of variables in the regression model were excluded, and the other an analysis using as participants with multiple imputation. Missing values of covariates were imputed with fully conditional specification based on the method of sequential regression (chained equations)16; 20 imputed data sets were created. We included all covariates (age, sex, examination city, and clinical conditions), as well as PAD, in the imputation model, which was based on ordinary regression for imputing values of continuous variables and a log‐linear model for imputing smoking status. Missing radiation doses were not imputed because radiation dose estimates depend on auxiliary variables used for dose reconstruction that, if missing, make it difficult to impute a dose estimate. All statistical tests were 2‐sided, and statistical significance was considered as P<0.05, although effects were also judged based on their magnitude and 95% confidence intervals (CI). Analyses were performed with Stata (version 14.0, College Station, TX).
Results
Among the 3476 participants, 79 (2.3%) were identified as having PAD based on prior surgery (n=10) or ABI ≤1.0 (69) at the time of measurement in the study. Participant characteristics across dose categories are summarized in Table 1. The difference in distribution of age across dose strata reflects the expansion group added in 2008, which comprises people who are younger and have lower doses of radiation (mean age 70.7 years, mean dose 0.10 Gy) than the primary cohort (mean age 78.2 years, mean dose 0.52 Gy) (Table 2). Participants in higher dose groups tended to be hypertensive, dyslipidemic, and former smokers. For example, hypertension proportion is 67.0% in the 0 to 0.005 Gy group and 72.7% in the 2+ Gy group; dyslipidemia proportion is 63.0% and 68.7%, respectively; and current (ever) smoker proportion is 8.2% (32.7%) and 2.0% (42.4%), respectively. Heterogeneity in age by dose group, as explained above, can explain the differences, across dose categories, in blood pressure level and hypertension status, lipid data and dyslipidemia, and smoking status. Trends with dose were not apparent in any covariates except UT.
Age‐adjusted univariate odds ratios (OR) and multivariate OR of PAD for the individual covariates are shown in Table 3. Radiation was not associated with PAD: age‐adjusted univariate OR (response: OR has been defined in the earlier line) was 0.89 (95% CI 0.61–1.30, P=0.56) and multivariate adjusted OR was 0.83 (CI 0.57–1.21, P=0.35). The age‐adjusted univariate analysis indicated that UT was associated with radiation dose (slope coefficient 2.02 ms/Gy CI 0.66–3.37, P=0.004) (Table 4). After we adjusted for other covariates, this association was not statistically significant (1.09 ms/Gy CI −0.17–2.36, P=0.091) (Table 4), but the fractional polynomial plot of mean UT versus radiation dose (adjusted for other covariates) indicated possibly increasing UT with increasing dose level and appeared to be upwardly curving, without evidence of a threshold (Figure). A sensitivity analysis in which radiation dose was also imputed (using an ordinary regression imputation model based only on the covariates and outcomes observed in the present study) produced qualitatively similar results and so did not suggest any strong bias caused by excluding data on participants with missing radiation dose.
Table 3.
Age‐Adjusted Univariate and Multivariable Analyses of Prevalent PADa: The Adult Health Study (n=3476)b
| Variable | Prevalent PAD | |||||||
|---|---|---|---|---|---|---|---|---|
| Age‐Adjusted Univariate OR | Multivariable ORc | |||||||
| OR | 95% CI | P Value | OR | 95% CI | P Value | |||
| Lower | Upper | Lower | Upper | |||||
| Sex (females) | 0.53 | 0.34 | 0.84 | 0.007 | Not included | |||
| Age, 5 y | 1.62 | 1.38 | 1.89 | <0.001 | 1.53 | 1.26 | 1.85 | <0.001 |
| Age squared, 5 y2 | 1.02 | 0.92 | 1.13 | 0.92 | Not included | |||
| Radiation dose, Gy | 0.89 | 0.61 | 1.30 | 0.56 | 0.83 | 0.57 | 1.22 | 0.347 |
| Smoking | ||||||||
| Current | 5.27 | 2.62 | 10.60 | <0.001 | 5.14 | 2.41 | 10.94 | <0.001 |
| Past | 2.49 | 1.52 | 4.10 | <0.001 | 2.11 | 1.21 | 3.67 | 0.008 |
| Never | (reference) | (reference) | ||||||
| Body mass index, kg/m2 | 1.04 | 0.97 | 1.11 | 0.27 | Not included | |||
| Systolic blood pressure, 10 mm Hg | 1.09 | 0.96 | 1.23 | 0.19 | Not included | |||
| Diastolic blood pressure, 5 mm Hg | 0.97 | 0.88 | 1.08 | 0.59 | Not included | |||
| Total cholesterol, 10 mg/dL | 0.96 | 0.90 | 1.03 | 0.26 | Not included | |||
| HDL cholesterol, 5 mg/dL | 0.88 | 0.81 | 0.96 | 0.002 | Not included | |||
| LDL cholesterol, 5 mg/dL | 0.99 | 0.95 | 1.03 | 0.69 | Not included | |||
| log Triglyceride, log mg/dL | 1.71 | 1.08 | 2.71 | 0.023 | Not included | |||
| White blood cell count, 100/dL | 1.13 | 1.00 | 1.27 | 0.054 | Not included | |||
| log CRP, log μg/L | 1.32 | 1.10 | 1.59 | 0.002 | 1.21 | 0.99 | 1.49 | 0.065 |
| Estimated GFR, 10 mL/min per 1.73 m2 | 0.71 | 0.62 | 0.82 | <0.001 | 0.77 | 0.67 | 0.89 | <0.001 |
| HbA1c, % | 1.05 | 1.02 | 1.07 | <0.001 | Not included | |||
| Hypertension | 1.40 | 0.57 | 3.42 | 0.46 | 1.41 | 0.73 | 2.70 | 0.309 |
| Hypertension medicationd | 2.34 | 1.27 | 4.33 | 0.007 | Not included | |||
| Diabetes mellitus | 1.41 | 0.63 | 3.15 | 0.41 | 1.83 | 1.09 | 3.07 | 0.021 |
| Diabetes mellitus medicationd | 2.98 | 1.79 | 4.98 | <0.001 | Not included | |||
| Dyslipidemia | 0.97 | 0.46 | 2.05 | 0.93 | 0.88 | 0.38 | 2.02 | 0.754 |
| Dyslipidemia medicationd | 2.32 | 1.36 | 3.98 | 0.002 | 2.66 | 1.27 | 5.59 | 0.010 |
ABI indicates ankle‐brachial index; CI, confidence interval; CRP, C‐reactive protein; GFR, glomerular filtration rate; HbA1c, hemoglobin A1c; HDL, high‐density lipoprotein; LDL, low‐density lipoprotein; OR, odds ratio; PAD, peripheral artery disease.
Prevalent cases of PAD were defined as participants who had ABI≤1.0 in either the right or left lower leg or who had had prior surgical or percutaneous revascularization procedures in the leg arteries.
Of 3476 participants, only 3217 were available for analyses focusing on radiation effects because of missing radiation dose estimates for the other participants.
OR of radiation exposure per Gy for PAD prevalence was calculated with adjustment for age at examination, smoking status, estimated GFR, CRP, diabetes mellitus, dyslipidemia, and hypertension, by using multivariable regression.
To determine whether the effect of a clinical condition on outcome is modified by therapeutic intervention, interaction variables were added to the regression analyses. The interaction variable for each condition was the product of an indicator of the condition (yes [1] or no [0] for hypertension, diabetes mellitus, and dyslipidemia) and history of medication (yes [1] or no [0]) for that condition.
Table 4.
Age‐Adjusted Univariate and Multivariable Analyses of UT: The Adult Health Study (n=3476)a
| Variable | UT [ms] | |||||||
|---|---|---|---|---|---|---|---|---|
| Age‐Adjusted Univariate Model | Multivariable Modelb | |||||||
| Coef | 95% CI | P Value | Coef | 95% CI | P Value | |||
| Lower | Upper | Lower | Upper | |||||
| Sex (female) | 4.33 | 2.74 | 5.93 | <0.001 | 10.81 | 8.60 | 13.03 | <0.001 |
| Age, 5 y | 3.14 | 2.42 | 3.87 | <0.001 | 1.03 | 0.24 | 1.83 | 0.011 |
| Age squared, 5 y2 | 0.70 | 0.18 | 1.22 | 0.008 | 0.78 | 0.27 | 1.30 | 0.003 |
| Radiation dose, Gy | 2.02 | 0.66 | 3.37 | 0.004 | 1.09 | −0.17 | 2.36 | 0.091 |
| Smoking | ||||||||
| Current smoker | 3.34 | 0.42 | 6.27 | 0.025 | 8.97 | 5.81 | 12.13 | <0.001 |
| Past smoker | 0.14 | −1.58 | 1.85 | 0.87 | 5.83 | 3.58 | 8.08 | <0.001 |
| Never smoker | (reference) | (reference) | ||||||
| Body mass index, kg/m2 | 0.74 | 0.50 | 0.98 | <0.001 | 0.70 | 0.44 | 0.95 | <0.001 |
| Systolic blood pressure, 10 mm Hg | −0.16 | −0.63 | 0.31 | 0.50 | 1.97 | 1.43 | 2.52 | <0.001 |
| Diastolic blood pressure, 5 mm Hg | −2.71 | −3.10 | −2.32 | <0.001 | −3.55 | −4.03 | −3.08 | <0.001 |
| Total cholesterol, 10 mg/dL | −0.17 | −0.40 | 0.07 | 0.16 | 0.75 | −0.19 | 1.70 | 0.118 |
| HDL cholesterol, 5 mg/dL | −0.93 | −1.18 | −0.67 | <0.001 | −1.47 | −2.08 | −0.85 | <0.001 |
| LDL cholesterol, 5 mg/dL | 0.09 | −0.05 | 0.22 | 0.22 | −0.34 | −0.82 | 0.15 | 0.174 |
| Triglyceride, Log | 4.68 | 3.04 | 6.32 | <0.001 | −1.57 | −4.14 | 1.00 | 0.230 |
| White blood cell count, 100/dL | 0.33 | −0.18 | 0.83 | 0.21 | −0.58 | −1.11 | −0.05 | 0.032 |
| CRP, log μg/L | 1.10 | 0.39 | 1.81 | 0.003 | 0.21 | −0.54 | 0.96 | 0.586 |
| Estimated GFR, 10 mL/min per 1.73 m2 | −0.94 | −1.44 | −0.44 | <0.001 | −1.03 | −1.52 | −0.54 | <0.001 |
| HbA1c, % | 0.29 | 0.19 | 0.40 | <0.001 | 0.07 | −0.04 | 0.18 | 0.207 |
| Hypertension | −2.47 | −5.02 | 0.07 | 0.057 | Not included | |||
| Hypertension medicationc | 2.92 | 1.18 | 4.65 | 0.001 | Not included | |||
| Diabetes mellitus | 3.17 | 0.31 | 6.02 | 0.030 | Not included | |||
| Diabetes mellitus medicationc | 7.03 | 4.67 | 9.38 | <0.001 | Not included | |||
| Dyslipidemia | 2.31 | 0.23 | 4.39 | 0.029 | Not included | |||
| Dyslipidemia medicationc | 4.38 | 2.57 | 6.19 | <0.001 | Not included | |||
CI indicates confidence interval; Coef, coefficient; CRP, C‐reactive protein; GEE, generalized estimating equation; HbA1c, hemoglobin A1c; HDL, high‐density lipoprotein; HT, hypertension; LDL, low‐density lipoprotein; UT, upstroke time.
Of 3476 participants, only 3217 were available for analyses focusing on radiation effects because of missing radiation dose estimates for the other participants.
The GEE regression method was used with UT in right and left legs as a bivariate outcome. Change in UT with 1 Gy radiation exposure was calculated with adjustment for age at examination, smoking status, body mass index, systolic blood pressure, diastolic blood pressure, total cholesterol, HDL cholesterol, LDL cholesterol, triglyceride, white blood cell count, CRP, and estimated GFR.
To determine whether the effect of a clinical condition on outcome is modified by therapeutic intervention, interaction variables were added to the regression analyses. The interaction variable for each condition was the product of an indicator of the condition (yes [1] or no [0] for hypertension, diabetes mellitus, and dyslipidemia) and history of medication (yes [1] or no [0]) for that condition.
Figure 1.
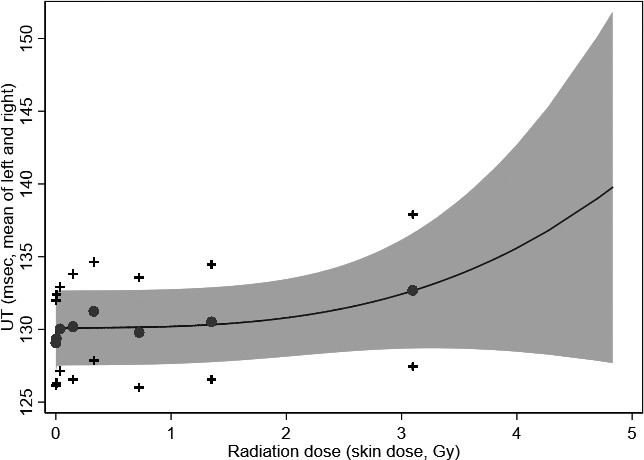
Upstroke time (UT) by radiation dose—The Adult Health Study (n=3476).* A nonparametric dose–response curve based on fractional‐polynomial smoothing, with predicted mean values of UT obtained from the generalized estimating equation model using dose groups. Dose groups were defined by the cut points 0, 0.001, 0.01, 0.1, 0.2, 0.5, 1.0, and 2.0. Both the estimated dose response and its lower confidence band give the suggestion of a trend with increasing dose level, consistent with the regression term for continuous dose (Tables 2 and 3). Mean UT ( ) and 95% confidence intervals (+) for dose group are illustrated. *Of 3476 participants, 3217 were available for analyses focusing on radiation effects because of missing radiation dose estimates.
Current smoking had the strongest influence on PAD prevalence (multivariate adjusted OR 5.14, CI 2.41–10.9); past smoking had a lower effect (OR 2.11, CI 1.21–3.67, P<0.001) (Table 3). As for the clinical conditions, diabetes mellitus (OR 1.83, CI 1.09–3.07, P=0.008) and medication for dyslipidemia (OR 2.66, CI 1.27–5.59, P=0.010) had large effects on PAD. Although hypertensive status was associated with an increase in UT (Table 4), the effects of clinical covariates mostly disappeared during the stepwise‐elimination regression procedure. Instead, multivariate adjusted coefficients of systolic blood pressure and diastolic blood pressure were statistically significant for UT: multivariate adjusted coefficients were 1.97 (CI 1.43–2.52, P<0.001) for systolic blood pressure and −3.55 (CI −4.03 to −3.08, P<0.001) for diastolic blood pressure. Smoking markedly prolonged UT: multivariate adjusted coefficient for current smoking was 8.97 (CI 5.81–12.1, P<0.001) and that for past smoking was 5.83 (CI 3.58–8.08, P<0.001).
Discussion
In this cross‐sectional clinical study, we did not find a relationship between radiation exposure and PAD prevalence based on low and borderline ABI (≤1.0) or a history of revascularization among the Japanese atomic‐bomb survivors with <4 Gy whole body exposures. Prolonged UT, a sensitive marker for stenosis, was correlated with radiation dose but was not statistically significant (P=0.091). An apparent radiation dose response for UT could not be ruled out and warrants further study.
Past studies indicated an excess risk of circulatory disease in Japanese atomic‐bomb survivors (<5 Gy),1, 2 and a 14% per Gy excess risk of death because of all heart disease was observed in the Life Span Study cohort with follow‐up from 1950 to 2008.1 Results of several other studies of radiation‐exposed groups (with doses <0.5 Gy) remain controversial3, 4; significant associations between external radiation exposure and ischemic heart disease risk were indicated in the Russian Federation Mayak nuclear workers study (mortality and incidence), Chernobyl emergency workers study (mortality), and INWORKS (mortality), whereas significant radiation risks of ischemic heart disease mortality were not found in the German uranium miner study, French nuclear worker study, studies of Eldorado uranium miners and processing workers, the third analysis from the UK national registry for radiation workers, or the International Agency for Research on Cancer 15‐country nuclear worker study. The controversy may stem from differences in radiation risk estimates based on different ethnic groups and different exposure settings. The Japanese atomic‐bomb survivors, our study population, had a single acute exposure, unlike nuclear workers, who had protracted chronic low‐dose‐rate exposures. In addition, background risk factors in our population differ from those in Western populations. Mechanisms of atherosclerosis might include radiation‐related tissue effects,6 but the lack of strong evidence of atherosclerosis risk at low radiation doses prevents a clear conclusion about the causal association.
PAD, together with coronary artery disease and cerebrovascular disease, is a polyvascular disease. Radiation‐exposed subjects may be at excess risk of developing subsequent PAD, but a long‐term risk after exposure to low‐to‐moderate doses has not been reported. Onset of PAD more than 65 years after the time of atomic‐bomb radiation exposure may be especially meaningful with regard to the increased use of radiotherapy at younger ages and increased likelihood of developing PAD in later life.
Given that an association between radiation dose and risk of peripheral arteriosclerosis is plausible, an explanation for such association is needed but is far from clear. At high doses—≈30 to 40 Gy—there is well‐established evidence of direct damage to the circulatory system, predominantly because of the corresponding response to excessive cell killing.17 In contrast, epidemiological and clinical evidence indicates that the mechanisms associated with low‐to‐moderate doses of ionizing radiation (<500 mGy) are different.17 In studies of the AHS cohort, radiation exposure has been associated with vascular calcification but not with intima‐media thickness.18 A potential mechanism of arterial alteration after low‐to‐moderate‐dose irradiation remains unclear. Long‐lasting immune dysfunction, perturbed T‐cell homeostasis, or pro‐inflammatory status in the atomic‐bomb survivors19, 20 may contribute to subsequent vascular damage.21 Furthermore, elevated blood pressure22 or hypertension23 among the atomic‐bomb survivors might further promote arterial changes linked with atherosclerotic changes.
In the current study, 2.3% of participants were identified as PAD cases on the basis of low or borderline ABI (ABI ≤1.0) or postrevascularization, but those with lower ABI (ABI <0.9) constituted only 0.5% of our study participants, whereas they constitute 1.7% to 4.3% of the general Japanese population24, 25, 26 and 3.6% to 14% of the Western population27, 28, 29 (Table 5). Prevalence in Japanese groups is lower than that in Western countries, which may be linked with the fact that lower body mass index in Japanese might be associated with a lower prevalence of atherosclerosis. PAD prevalence is strongly age related,30 but elderly participants in our study had lower prevalence than other Japanese groups. Although a clear explanation was not found, this could be attributable to 3 reasons. First, it is plausible that healthy survivors were more likely to attend our clinical examination. In other words, because of the high mortality from PAD,31, 32 PAD patients may have died before our cross‐sectional survey. Indeed, age‐specific rates in the AHS were lower in the elderly group: prevalence at 60 to 69 years of age was 1.2% in the KOPS (Kyushu and Okinawa Population Study)26 versus 0.9% in the AHS, 2.3% versus 1.9% at 70 to 79 years of age, and 6.7% versus 4.7% at 80+ years of age. Second, our study included very few smokers because females are over‐represented relative to males in our cohort (58.9%), whereas the sex distribution was 40% men and 10% women in the 2007 Japan National Health and Nutrition Survey.33 Third, the atomic‐bomb survivors have received social services including periodic health examinations and cancer screening, which should encourage improved lifestyles and help reduce the risk of developing PAD.
Table 5.
Studies of PAD and its Risk Factors in Japan and Western Countries
| Characteristic | Adult Health Studya | Tanno‐Sobetsu Study25 | The Kyusyu and Okinawa Population Survey (KOPS)26 | Cardiovascular Risk Survey24 | Multi‐Ethnic Study of Atherosclerosis (MESA)27 | Rotterdam Study28 | Framingham Offspring Study29 | |||
|---|---|---|---|---|---|---|---|---|---|---|
| (Oscillometric‐ABI) | (Doppler‐ABI) | |||||||||
| Countries | ||||||||||
| Japan | Japan | Japan | Japan | United States | Netherlands | United States | ||||
| ABI cutoff | ≤1.0 | <0.9 | <0.9 | ≤0.9 | ≤0.9 | <0.9 | ≤0.9 | <0.9 | <0.9 | 0.9 to 1.0 |
| PAD prevalence | 2.3 | 0.5 | 2.7 | 1.71 | 4.3 | 6.5 | 4.1 | 19 | 3.6 | 7.1 |
| N | 3476 | 1398 | 2402 | 726b | 6653 | 6450c | 3313 | |||
| Age (mean, y) | 74.8 | 64.2 | 64.9 | 66.8 | 62.2 | 69.5 | 59.1 | |||
| Diabetes mellitus [%] | 21.7 | 9.2 | … | 12.5 | 14.0 | 8.1 | 10.1 | |||
| Hypertension [%] | 65.8 | 51.6 | 49.3 | 56.5 | 44.2 | 52.8 | 42.1 | |||
| Current smoker [%] | 8.4 | 35.8 | 11.5 | 41.5 | 13.1 | 20.1 | 15.8 | |||
| BMI [kg/m2] | 22.9 | 23.8 | 22.9 | 23.5 | 28.2 | 26.3 | 28.0 | |||
Mean age, mean BMI, and percentages with risk factors were extracted from several reports that had different levels of adjustment: sex‐specific data from the Tanno‐Sobetsu study25 and the Rotterdam Study,28 age‐sex adjusted data by ethnic group from the MESA study,27 and data stratified by ABI level from the Cardiovascular Risk Study24 and the Framingham Offspring Study.29 ABI indicates ankle‐brachial blood pressure index; BMI, body mass index; PAD, peripheral artery disease.
Participants of the current study derive from the Adult Health Study cohort7, 8 of Japanese survivors of the atomic bombing.
Men aged 60 to 79 years.
Excluding people with ABI>1.4.
Such low prevalence as was observed in our participants can cause lack of power to detect the impact of radiation exposure on long‐term PAD prevalence. Small numbers of atomic‐bomb survivors exposed to high doses further reduces power. In light of these issues, the potential association between low‐to‐moderate doses of radiation exposure and PAD deserves further consideration.
Our investigation also failed to find a strong association between UT and radiation dose (Table 4), but there was an upward tendency in UT with dose (Figure). In the multiple regression equation for UT change, the stepwise procedure selected blood pressure measurements as explanatory variables but not hypertension history. This can be explained by the fact that UT is acquired from the pulse wave technique: UT is more likely to depend on hemodynamics or high blood pressures than on hypertension (a dichotomous variable) per se. Furthermore, the estimated coefficients were positive for systolic pressure and negative for diastolic pressure, which agrees with evidence that lowering diastolic pressure34 and elevating systolic pressure35 are a consequence of reduced aortic elasticity. This evidence indicates that prolonged UT might be related to relatively mild atherosclerosis, and this feature of UT could identify patients at high risk but missed by the ABI method.11 Our findings with UT suggest that the atomic‐bomb survivors may be at risk of vascular damage even if not severe occlusion. The advanced method for measuring UT has been available only for a decade, and factors that might affect UT are not yet fully clear. Considering both of our findings—no significant association between radiation dose and PAD prevalence but a suggestive radiation dose‐response pattern in UT—low‐to‐moderate radiation doses may promote stenotic changes in arteries but not such severe changes as would lead to clinically apparent ischemia in the lower extremities. These end points were not confirmed with angiography as the AHA guidelines recommend, so careful interpretation of the current findings is needed.
Radiation dose and age are confounded because their joint distribution differs according to whether participants belong to the younger expansion group added in 2008. In the primary cohort, mean age was 78.2 years and mean dose was 0.52 Gy (n=1788), but in the younger expansion group, mean age was 70.7 years and mean dose was 0.10 Gy (n=1688) (Table 2). This is the reason why we adjusted for age when estimating the univariate effects reported in Tables 2 and 3. We also conducted analogous multivariate analyses with data from only the primary cohort, excluding the 2008 expansion group; the values of radiation‐related OR for PAD and radiation‐related change in UT were similar to those shown in Tables 2 and 3 (results not shown).
We note several strengths and limitations of our study. The primary limitation is that diagnosis of PAD and assessment of UT was not confirmed by angiography, but American Heart Association guidelines recommend angiography as a PAD evaluation method. The use of oscillometric ABI may underestimate the prevalence of PAD,36 particularly in our elderly cohort.9 The pulse wave recording technique used in our study may be influenced by factors other than vessel patency, such as heart rate. The small number of PAD cases might be cause for concern about bias in the logistic regression maximum likelihood estimates, although a comparison between crude and multivariable estimates in Table 3 does not reveal any obvious problems; furthermore, a separate multivariable fit with Firth's logistic regression37 (data not shown) produced estimates virtually identical to those in Table 3, which suggests that small‐sample bias is not likely present. Finally, our sample size of 99 in the high‐dose group (>2 Gy) could be insufficient to provide adequate power for finding a dose response with PAD, but the estimated odds ratio for 1 Gy is <1.0 and the upper bound of the 95% CI (1.22), the highest value of the OR compatible with the data, is not large. Despite these limitations, this study is the first report of long‐lasting risk of PAD after exposure to low‐to‐moderate doses of radiation. The primary strength of our study is that data on ABI and pulse wave were collected in a clinical setting with the VP‐2000 device, which provides accurate measurements with minimal need for examiner technical skill.9, 36, 38 Dose reconstruction is another strength; estimation of radiation doses follows a system of quantification based on theoretical physics and interviews of many survivors regarding location and shielding.14, 15 Among large cohort studies, exposure reconstruction in the atomic‐bomb survivor cohort is unusually precise.
In conclusion, a radiation‐related change in PAD prevalence was not evident, although stenotic changes were suggested. Further investigation is needed to determine whether prolonged UT reflects radiation‐induced vascular damage.
Sources of Funding
The Radiation Effects Research Foundation (RERF), Hiroshima and Nagasaki, Japan is a public interest incorporated foundation funded by the Japanese Ministry of Health, Labour and Welfare (MHLW) and the US Department of Energy (DOE). This publication was supported by RERF Research Protocol 7‐09. The views of the authors do not necessarily reflect those of the 2 governments.
Disclosures
None.
(J Am Heart Assoc. 2018;7:e008921 DOI: 10.1161/JAHA.118.008921.)
References
- 1. Takahashi I, Shimizu Y, Grant EJJ, Cologne J, Ozasa K, Kodama K. Heart disease mortality in the life span study, 1950–2008. Radiat Res. 2017;187:319–332. [DOI] [PubMed] [Google Scholar]
- 2. Shimizu Y, Kodama K, Nishi N, Kasagi F, Suyama A, Soda M, Grant EJ, Sugiyama H, Sakata R, Moriwaki H, Hayashi M, Konda M, Shore RE. Radiation exposure and circulatory disease risk: Hiroshima and Nagasaki atomic bomb survivor data, 1950–2003. BMJ. 2010;340:b5349. [DOI] [PMC free article] [PubMed] [Google Scholar]
- 3. Little MP, Azizova TV, Bazyka D, Bouffler SD, Cardis E, Chekin S, Chumak VV, Cucinotta FA, de Vathaire F, Hall P, Harrison JD, Hildebrandt G, Ivanov V, Kashcheev VV, Klymenko SV, Kreuzer M, Laurent O, Ozasa K, Schneider T, Tapio S, Taylor AM, Tzoulaki I, Vandoolaeghe WL, Wakeford R, Zablotska LB, Zhang W, Lipshultz SE. Systematic review and meta‐analysis of circulatory disease from exposure to low‐level ionizing radiation and estimates of potential population mortality risks. Env Health Perspect. 2012;120:1503–1511. [DOI] [PMC free article] [PubMed] [Google Scholar]
- 4. Gillies M, Richardson DB, Cardis E, Daniels RD, O'Hagan JA, Haylock R, Laurier D, Leuraud K, Moissonnier M, Schubauer‐Berigan MK, Thierry‐Chef I, Kesminiene A. Mortality from circulatory diseases and other non‐cancer outcomes among nuclear workers in France, the United Kingdom and the United States (INWORKS). Radiat Res. 2017;188:276–290. [DOI] [PMC free article] [PubMed] [Google Scholar]
- 5. Bhargavan M. Trends in the utilization of medical procedures that use ionizing radiation. Health Phys. 2008;95:612–627. [DOI] [PubMed] [Google Scholar]
- 6. Bhatti P, Sigurdson AJ, Mabuchi K. Can low‐dose radiation increase risk of cardiovascular disease? Lancet. 2008;372:697–699. [DOI] [PubMed] [Google Scholar]
- 7. Akahoshi M, Yamada M, Hida A, Ohishi W, Ozasa K, Kasagi F, Suyama A, Furukawa K, Cullings HM, Hayashi T, Nakach K, Kodama Y, Katayama H, Kodama K, Nakamura N, Fujiwara S. Clinical health study for expanded group of younger A‐bomb survivors. Radiation Effects Research Foundation Research Protocol 3‐07. 2007.
- 8. Radiation Effects Research Foundation . A Brief Description of the Radiation Effects Research Foundation (revised in April 2016). Available at: https://www.rerf.or.jp/uploads/2017/09/briefdescript_e.pdf. Accessed October 25, 2018.
- 9. Takahashi I, Furukawa K, Ohishi W, Takahashi T, Matsumoto M, Fujiwara S. Comparison between oscillometric‐ and Doppler‐ABI in elderly individuals. Vasc Health Risk Manag. 2013;9:89–94. [DOI] [PMC free article] [PubMed] [Google Scholar]
- 10. Gerhard‐Herman MD, Gornik HL, Barrett C, Barshes NR, Corriere MA, Drachman DE, Fleisher LA, Fowkes FGR, Hamburg NM, Kinlay S, Lookstein R, Misra S, Mureebe L, Olin JW, Patel RAG, Regensteiner JG, Schanzer A, Shishehbor MH, Stewart KJ, Treat‐Jacobson D, Walsh ME. 2016 AHA/ACC guideline on the management of patients with lower extremity peripheral artery disease: executive summary: a report of the American College of Cardiology/American Heart Association Task Force on Clinical Practice Guidelines. Circulation. 2017;135:e686–e725. [DOI] [PMC free article] [PubMed] [Google Scholar]
- 11. Sheng CS, Li Y, Huang QF, Kang YY, Li FK, Wang JG. Pulse waves in the lower extremities as a diagnostic tool of peripheral arterial disease and predictor of mortality in elderly Chinese. Hypertension. 2016;67:527–534. [DOI] [PubMed] [Google Scholar]
- 12. Matsuo S, Imai E, Horio M, Yasuda Y, Tomita K, Nitta K, Yamagata K, Tomino Y, Yokoyama H, Hishida A; Collaborators developing the Japanese equation for estimated GFR . Revised equations for estimated GFR from serum creatinine in Japan. Am J Kidney Dis. 2009;53:982–992. [DOI] [PubMed] [Google Scholar]
- 13. Gabir MM, Hanson RL, Dabelea D, Imperatore G, Roumain J, Bennett PH, Knowler WC. The 1997 American Diabetes Association and 1999 World Health Organization criteria for hyperglycemia in the diagnosis and prediction of diabetes. Diabetes Care. 2000;23:1108–1112. [DOI] [PubMed] [Google Scholar]
- 14. Cullings HM, Fujita S, Funamoto S, Grant EJ, Kerr GD, Preston DL. Dose estimation for atomic bomb survivor studies: its evolution and present status. Radiat Res. 2006;166:219–254. [DOI] [PubMed] [Google Scholar]
- 15. Cullings HM, Pierce DA, Kellerer AM. Accounting for neutron exposure in the Japanese atomic bomb survivors. Radiat Res. 2014;182:587–598. [DOI] [PubMed] [Google Scholar]
- 16. Azur MJ, Stuart EA, Frangakis C, Leaf PJ. Multiple imputation by chained equations: what is it and how does it work? Int J Methods Psychiatr Res. 2011;20:40–49. [DOI] [PMC free article] [PubMed] [Google Scholar]
- 17. Stewart FA, Seemann I, Hoving S, Russell NS. Understanding radiation‐induced cardiovascular damage and strategies for intervention. Clin Oncol (R Coll Radiol). 2013;25:617–624. [DOI] [PubMed] [Google Scholar]
- 18. Yamada M, Naito K, Kasagi F, Masunari N, Suzuki G. Prevalence of atherosclerosis in relation to atomic bomb radiation exposure: an RERF Adult Health Study. Int J Radiat Biol. 2005;81:821–826. [DOI] [PubMed] [Google Scholar]
- 19. Hayashi T, Kusunoki Y, Hakoda M, Morishita Y, Kubo Y, Maki M, Kasagi F, Kodama K, Macphee DG, Kyoizumi S. Radiation dose‐dependent increases in inflammatory response markers in A‐bomb survivors. Int J Radiat Biol. 2003;79:129–136. [PubMed] [Google Scholar]
- 20. Kusunoki Y, Hayashi T. Long‐lasting alterations of the immune system by ionizing radiation exposure: implications for disease development among atomic bomb survivors. Int J Radiat Biol. 2008;84:1–14. [DOI] [PubMed] [Google Scholar]
- 21. Hansson GK. Immune mechanisms in atherosclerosis. Arterioscler Thromb Vasc Biol. 2001;21:1876–1890. [DOI] [PubMed] [Google Scholar]
- 22. Sasaki H, Wong FL, Yamada M, Kodama K. The effects of aging and radiation exposure on blood pressure levels of atomic bomb survivors. J Clin Epidemiol. 2002;55:974–981. [DOI] [PubMed] [Google Scholar]
- 23. Yamada M, Wong FL, Fujiwara S, Akahoshi M, Suzuki G. Noncancer disease incidence in atomic bomb survivors, 1958–1998. Radiat Res. 2004;161:622–632. [DOI] [PubMed] [Google Scholar]
- 24. Cui R, Kitamura A, Yamagishi K, Tanigawa T, Imano H, Ohira T, Sato S, Shimamoto T, Iso H. Ankle‐arm blood pressure index as a correlate of preclinical carotid atherosclerosis in elderly Japanese men. Atherosclerosis. 2006;184:420–424. [DOI] [PubMed] [Google Scholar]
- 25. Fujiwara T, Saitoh S, Takagi S, Ohnishi H, Ohata J, Takeuchi H, Isobe T, Chiba Y, Katoh N, Akasaka H, Shimamoto K. Prevalence of asymptomatic arteriosclerosis obliterans and its relationship with risk factors in inhabitants of rural communities in Japan: Tanno‐Sobetsu study. Atherosclerosis. 2004;177:83–88. [DOI] [PubMed] [Google Scholar]
- 26. Ohnishi H, Sawayama Y, Furusyo N, Maeda S, Tokunaga S, Hayashi J. Risk factors for and the prevalence of peripheral arterial disease and its relationship to carotid atherosclerosis: the Kyushu and Okinawa Population Study (KOPS). J Atheroscler Thromb. 2010;17:751–758. [DOI] [PubMed] [Google Scholar]
- 27. Criqui MH, McClelland RL, McDermott MM, Allison MA, Blumenthal RS, Aboyans V, Ix JH, Burke GL, Liu K, Shea S. The ankle‐brachial index and incident cardiovascular events in the MESA (Multi‐Ethnic Study of Atherosclerosis). J Am Coll Cardiol. 2010;56:1506–1512. [DOI] [PMC free article] [PubMed] [Google Scholar]
- 28. Meijer WT, Hoes AW, Rutgers D, Bots ML, Hofman A, Grobbee DE. Peripheral arterial disease in the elderly: the Rotterdam Study. Arterioscler Thromb Vasc Biol. 1998;18:185–192. [DOI] [PubMed] [Google Scholar]
- 29. Murabito JM, Evans JC, Nieto K, Larson MG, Levy D, Wilson PW. Prevalence and clinical correlates of peripheral arterial disease in the Framingham Offspring Study. Am Heart J. 2002;143:961–965. [DOI] [PubMed] [Google Scholar]
- 30. Criqui MH, Aboyans V. Epidemiology of peripheral artery disease. Circ Res. 2015;116:1509–1526. [DOI] [PubMed] [Google Scholar]
- 31. Hirsch AT, Haskal ZJ, Hertzer NR, Bakal CW, Creager MA, Halperin JL, Hiratzka LF, Murphy WR, Olin JW, Puschett JB, Rosenfield KA, Sacks D, Stanley JC, Taylor LM Jr, White CJ, White J, White RA, Antman EM, Smith SC Jr, Adams CD, Anderson JL, Faxon DP, Fuster V, Gibbons RJ, Hunt SA, Jacobs AK, Nishimura R, Ornato JP, Page RL, Riegel B; American Association for Vascular S, Society for Vascular S, Society for Cardiovascular A, Interventions, Society for Vascular M, Biology, Society of Interventional R, Disease AATF on PGWC to DG for the M of PWPA, American Association of C, Pulmonary R, National Heart L, Blood I, Society for Vascular N, TransAtlantic Inter‐Society C, Vascular Disease F . ACC/AHA 2005 Practice Guidelines for the management of patients with peripheral arterial disease (lower extremity, renal, mesenteric, and abdominal aortic): a collaborative report from the American Association for Vascular Surgery/Society for Vascular Sur. Circulation. 2006;113:e463–e654. [DOI] [PubMed] [Google Scholar]
- 32. Norgren L, Hiatt WR, Dormandy JA, Nehler MR, Harris KA, Fowkes FG, Group TIW . Inter‐society consensus for the management of peripheral arterial disease (TASC II). J Vasc Surg. 2007;45(suppl S):S5–S67. [DOI] [PubMed] [Google Scholar]
- 33. Ministry of Health, Labour and Welfare, Japan . Outline of Results from 2007 National Health and Nutrition Survey. Available at: http://www.mhlw.go.jp/english/wp/wp-hw3/dl/2-064_065.pdf. Accessed October 25, 2018.
- 34. Quinn U, Tomlinson LA, Cockcroft JR. Arterial stiffness. JRSM Cardiovasc Dis. 2012;1:1–8. [DOI] [PMC free article] [PubMed] [Google Scholar]
- 35. Pinto E. Blood pressure and ageing. Postgrad Med J. 2007;83:109–114. [DOI] [PMC free article] [PubMed] [Google Scholar]
- 36. Guo X, Li J, Pang W, Zhao M, Luo Y, Sun Y, Hu D. Sensitivity and specificity of ankle‐brachial index for detecting angiographic stenosis of peripheral arteries. Circ J. 2008;72:605–610. [DOI] [PubMed] [Google Scholar]
- 37. Graham J, McNeney B, Platt R. Small sample methods In: Borgan Ø, Breslow NE, Chatterjee N, Gail MH, Scott A, Wild CJ, eds. Handbook of Statistical Methods for Case‐Control Studies. Boca Raton, FL: CRC Press; 2018:133–162. [Google Scholar]
- 38. Richart T, Kuznetsova T, Wizner B, Struijker‐Boudier HA, Staessen JA. Validation of automated oscillometric versus manual measurement of the ankle‐brachial index. Hypertens Res. 2009;32:884–888. [DOI] [PubMed] [Google Scholar]