

ABSTRACT
TGF-β is a pleiotropic cytokine with multiple roles in immunity. Apart from its suppressive activity, TGF-β is a driving cytokine in the differentiation of induced regulatory T cells (iTreg) but also in the polarization of interleukin-9 (IL-9) producing T helper 9 (Th9) T cells. Human Vδ2 expressing γδ T cells exert potent cytotoxicity towards a variety of solid tumor and leukemia/lymphoma target cells and thus are in the focus of current strategies to develop cell-based immunotherapies. Here we report that TGF-β unexpectedly augments the cytotoxic effector activity of short-term expanded Vδ2 T cells when purified γδ T cells are activated with specific pyrophosphate antigens and IL-2 or IL-15 in the presence of TGF-β. TGF-β up-regulates the expression of CD54, CD103, interferon-γ, IL-9 and granzyme B in γδ T cells while CD56 and CD11a/CD18 are down-regulated. Moreover, we show that CD103 (αE/β7 integrin) is recruited to the immunological synapse in γδ T cells. Increased cytotoxic activity of TGF-β-exposed γδ T cells is reduced by anti-CD103 and further diminished upon additional anti-CD11a antibody treatment, pointing to a role of cellular adhesion in the enhanced cytolytic activity. Furthermore, magnetically sorted CD103-positive Vδ2 T cells exhibit superior cytolytic activity. In view of the importance of CD103 for tissue homing of lymphocytes, our results suggest that adoptive transfer of CD103-expressing Vδ2 T cells might favor their homing to solid tumors.
KEYWORDS: TGF-beta, Vdelta2, gamma/delta T cells, IFN-gamma, CD103
Introduction
γδ T cells are a minor subgroup of T cells in the peripheral blood but occur at increased frequencies in mucosal tissue. The major population of γδ T cells in the peripheral blood of healthy adults expresses a Vγ9Vδ2 T-cell receptor (hereafter termed Vδ2 T cells). Vδ2 T cells recognize via their T-cell receptor in a butyrophilin 3A (BTN3A)-dependent manner pyrophosphates of microbial origin or produced by tumor cells due to a frequently dysregulated mevalonate pathway.1 Vδ2 T cells recognize and kill many different tumors and therefore have been considered for cancer immunotherapy, albeit so far with limited success.2 Due to their HLA-independent antigen recognition, adoptive transfer of γδ T cells from healthy donors into cancer patients can be considered with minimal risk for graft-versus-host disease. γδ T cells are present among tumor infiltrating T cells in various human cancers including pancreatic cancer,3,4 where they can constitute up to ~ 40% of the T cells.5 Multiple other studies also identified γδ T cells as part of the tumor infiltrating lymphocytes (TIL), albeit with different prognostic implications. Whereas γδ T-cell frequencies among the TIL positively correlated with a more favorable prognosis in melanoma, a negative correlation was found in breast- and colo-rectal cancer.6 However, in a recent transcriptome study performed in a colorectal cancer cohort, the γδ T-cell abundance correlated positively with disease free survival7, and in a recent meta-analysis of 39 cancer types the abundance of intra-tumoral γδ T cells was identified as the most important prognostic factor associated with a positive outcome.8
A major issue of immunotherapy by adoptive transfer of T cells is how to bring the effector cells into proximity of the targeted tumor cells. The recruitment of lymphocytes into tissues is orchestrated by chemo-attractants and adhesion molecules. LFA-1 (Integrin αL/β2; CD11a/CD18) is the best-characterized molecule of the integrin family and is essential for lymphocyte homing to lymphoid and non-lymphoid tissues as well as for the formation and maintenance of the immunological and cytolytic synapse.9 The integrin αE (CD103)/β7, which interacts with the epithelial cell marker E-cadherin, is known to be important for the retention of lymphocytes within epithelial tissues,10 but is only expressed on about 2% of the peripheral blood mononuclear cells (PBMC) of healthy individuals.11 Moreover, αE (CD103)/β7 activity is important for the acquisition of a dendritic phenotype and the motility of intraepithelial T cells.12
Vδ2 T cells display a high functional plasticity. Similar to αβ T cells, Vδ2 T cells can be differentiated into various subsets depending on the local cytokine milieu.13 In this regard, TGF-β has been shown to be required for human Vδ2 T cells to acquire a regulatory or IL-17-producing phenotype.14–16 In addition, we recently reported that Vδ2 T cells expanded in the presence of TGF-β and IL-15 differentiate into Th9-like cells with strong IL-9-production.17 This pathway of Vδ2 T-cell differentiation is of particular interest for cancer immunotherapy, since it has been reported that IL-9-producing T cells can promote anti-tumor immunity against solid tumors, either by direct cytotoxicity or by indirect mechanisms.18,19 In this study, we observed that TGF-β-expanded Vδ2 T cells not only produce high amounts of IL-9 and up-regulate specific adhesion molecules like CD103, but also show a remarkably increased cytotoxic activity. These properties make ex vivo TGF-β-expanded CD103+ Vδ2 T cells a promising tool for adoptive transfer to treat aggressive cancer diseases with poor prognosis such as pancreatic ductal adenocarcinoma (PDAC).
Material & methods
Cell culture
This study was approved by the Institutional Review Board of the Medical Faculty of the University of Kiel (D404/14 and D405/10). PBMC were separated by Ficoll-Hypaque density gradient centrifugation from leukocyte concentrates obtained from healthy adult blood donors (provided by the Institute of Transfusion Medicine, UKSH). Total γδ T cells (typically comprising 70 to > 95% Vδ2 and < 5 to 25% Vδ1 T cells) were positively isolated by magnetic sorting (anti-TCRγ/δ MicroBead kit; Miltenyi Biotec, Bergisch-Gladbach, Germany). Optimized separation conditions (i.e., usage of two consecutive MACS columns) resulted in a γδ T-cell purity of > 98%. Purified T cells were cultured for 22 h at 37 °C prior to activation. Cell culture was performed in serum-free X-VIVO 15 medium (Lonza, Cologne, Germany) at 37 °C in a humidified atmosphere of 5% CO2. 35 × 103 γδ T cells were stimulated with 300 nmol/L bromohydrin pyrophosphate (BrHPP; kindly provided by Innate Pharma, Marseille, France) in 96-well round-bottom plates in the presence of 50 × 103 irradiated (40 Gray) PBMC. Cell cultures were supplemented with IL-2 (50 IU/mL; Novartis, Basel, Switzerland) or IL-15 (10 ng/mL; R&D Systems/Bio-Techne, Minneapolis, USA) which were combined with TGF-β1 (1.7 ng/mL; R&D Systems/Bio-Techne) and 10 IU/mL IL-2 (IL-2 low) as indicated. In some experiments, the activin receptor-like kinases (ALK)-inhibitor SB431542 (Sigma-Aldrich/Merk, Darmstadt, Germany) was added to the cell culture. The cytokines and SB431542 were also added on day 4 and 12; on day 8 the cells were transferred into fresh medium supplemented with the respective substances and seeded in 24-well plates. For cell sorting according to CD103 surface expression, Vδ2 [IL-15 + TGF-β] T cells were labeled using anti-CD103-PE (clone: Ber-ACT8, BD Biosciences) after 12 days of expansion. Subsequent to the incubation with anti-PE MicroBeads (Miltenyi Biotec) Vδ2 T cells were separated into CD103-positive and -negative fractions by magnetic cell sorting. Optimized separation conditions (i.e., usage of two consecutive MACS columns) resulted in a purity of > 98% for both populations. The CD103 sorted populations were cultured in the presence of IL-15 and TGF-β for three more days to allow the anti-CD103 labeling to wear off before using the cells in functional assays.
After 15 days of expansion, the purity of the expanded Vδ2 T cells was > 98%. For activation and expansion of Vδ2 T cells within the PBMC, zoledronic acid (Novartis) was added at 2.5 µM together with 50 IU IL-2, which was replenished every 2 days. After 15 days of expansion the purity of the expanded Vδ2 T cells was > 92%. Tumor cell lines generated from PDAC (Colo357, MiaPaCa2, Panc1 and Panc89) were kindly provided by the Institute of Experimental Tumor Research, UKSH, Kiel, Germany. The mammary gland adenocarcinoma cell line (MCF7) was purchased from ATCC. The identity of the tumor cell lines was validated by Short Tandem Repeat analysis. Tumor cells were cultured in RPMI with 10% fetal calf serum and antibiotics. To detach adherent tumor cells lines 0.05% trypsin and 0.2% EDTA were used.
Assessment of the cytotoxic activity
Co-cultures of Vδ2 T-cell lines with tumor cells were performed in the presence of IL-2 (10 IU/mL) and absence or presence of BrHPP (300 nmol/L). In some experiments, Vδ2 T cells were incubated with the following monoclonal antibodies (mAb): IgG2b (clone: 20116, R&D Systems/Bio-Techne) and anti-CD103 (clone: 2G5, Beckman Coulter) at 50 µg/mL for 30 min before the co-culture was initiated. IgG1 (clone: 11711.11), IgG2 (clone: MG2b-57), anti-IL-9 (clone: MH9D1) and anti-IFN-γ (clone: B27; all from Biolegend), as well as anti-CD11a (clone: HI111, BD Biosciences) and anti-CD103 (clone: 2G5) were added to the Vδ2 T-cell culture medium at a final concentration of 5 µg/mL 1 h before the co-culture was initiated and remained present throughout the course of the experiment. The cytotoxic activity was measured by the Real Time Cell Analyzer (RTCA) single-plate system (ACEA, San Diego, USA), which allows for time-resolved analysis.20 In brief, 15 × 103 (MCF7 cells), 7.5 × 10³ (MiaPaCa2 cells), 7.5 × 10³ (Panc1 cells) or 6.5 × 10³ (Panc89 cells, Colo357 cells) adherent tumor cells were seeded in 96-well E-plates with electronic sensors (ACEA) on the bottom of each well. Changes of the impedance were measured by the RTCA system in arbitrary units termed cell index. The cell index was measured in 5 min steps until the addition of the effector cells, which were added in the linear growth phase of the tumor cells about 24 h after the start of the assay. After the addition of the Vδ2 T cells to the tumor cells, at the indicated effector/target (E/T) ratios, the impedance was normalized within all wells. Further on, the cell index was measured every 3 min. The target cell lysis, which correlates with the loss of impedance, was calculated as percentage of the maximum lysis (MaxLys) and the corresponding control of untreated tumor cells (Untr) at the respective time point using the formula 100 – [(X – MaxLys)/(Untr – MaxLys)]/100. Maximal lysis was achieved by addition of 1% Triton X-100 (Sigma). The cell index was analyzed using the RTCA data analysis software 1.0 (ACEA).
The mobilization of CD107a to the surface as a marker for degranulation was detected by flow cytometry. 62.5 × 10³ effector cells were cultured alone or together with 5 × 10³ tumor cells for 4 h at a E/T of 12.5:1 in the presence of anti-CD107a mAb (clone: H4A3; BD Biosciences) and monensin (3 µM; added after 1 h). Subsequently, CD107a was quantified on Vδ2 T cells (labeled by specific antibody) by flow cytometry.
Flow cytometry
For cell surface staining, the following mAb were used: anti-CCR4 (clone: 1G1), anti-CCR10 (clone: 1B5), anti-CD11a (clone: HI111), anti-CD18 (clone: 6.7), anti-CD27 (clone: M-T271), anti-CD45RA (clone: HI100), anti-CD103 (clone: Ber-ACT8), anti-Vδ2 (clone: B6; all from BD Biosciences), anti-CD54 (clone: 84H10, Beckman Coulter), anti-CCR6 (clone: G034E3), anti-CCR7 (clone: G043H7), anti-CXCR3 (clone: G025H7), anti-CXCR4 (clone: 12G5), anti-CD56 (clone: CMSSB, eBioscience), anti-CD106 (clone: STA) and anti-E-Cadherin (67A4; all from Biolegend), as well as anti-CCR2 (clone: 48607,221) and anti-CCR9 (clone: 112509, both from R&D Systems/Bio-Techne). For the surface labeling of adherent tumor cells, the cells were detached by accutase. For intracellular staining the following mAb were used: anti-granzyme A (clone: CB9), anti-granzyme B (clone: GB11), anti-IFN-γ (clone: 4S.B3), anti-IL-9 (clone: MH9A3), anti-TNF-α (clone: 359–81-11), anti-perforin (clone: dG9), IgG1 (clone: MOPC-21) and IgG2b (clone: 27–35) isotype controls (all from BD Biosciences). For intracellular staining, cells were stimulated for 6 h with 10 ng/mL 12-O-tetradecanoylphorbol-13-acetate (TPA; Sigma Aldrich, Missouri, USA) and 1 µg/mL ionomycin (EMD Millipore/Calbiochem, Darmstadt, Germany) as indicated; 3 µM monensin (EMD Millipore/Calbiochem) was added 4 h before fixation in each case. Subsequently, cells were fixed and permeabilized using the Cytofix/CytopermTM/Permwash- Kit (BD Biosciences).
The detachment assay was performed according to Netter et al.21 In brief, Vδ2 T cells and Panc89 cells were labeled according to the manufacturer’s protocol using the PKH26 Red and PKH67 Green Fluorescent Cell Linker Kit for general cell membrane labeling (Sigma-Aldrich). 0.5 × 10⁶ Vδ2 T cells were then co-cultured with 0.25 × 10⁶ Panc89 cells in 500 µL cell culture medium at 37 °C for 45 min. Subsequently, cell suspensions were diluted 1:10 with cell culture medium, distributed to five aliquots and further incubated at 37 °C on a MACSmix rotator (Miltenyi Biotec) at 20 rpm. To quantify the detachment, the conjugates were fixed after 0 – 100 min by addition of 1/3 volume of 4% PFA. Conjugates were determined as double positive events by flow cytometry.
All samples were analyzed on a FACS-Fortessa flow cytometer (BD Biosciences) using BD FACSDivaTM Software v.8. For further analysis the FlowJo software v.10 was used. Z-normalization within experiments was performed using the formula X – mean value (experiment)/standard deviation (experiment).
For ImageStream flow cytometry analysis 0.25 × 10⁶ tumor cells and 0.5 × 10⁶ Vδ2 T cells were co-cultured in 24-well flat bottom plates for 45 min at 37 °C and were fixed by direct addition of paraformaldehyde to a final concentration of 1%. The antibody labeling was performed after permeabilization with Perm/Wash (BD Biosciences) using specific mAb for CD3 (clone: UCHT1), E-Cadherin (clone: 67A4; all from Biolegend), CD103 (clone: Ber-ACT8, BD Biosciences) and phalloidin (Santa Cruz). Samples were measured on an ImageStream X Mark II (Merck) one camera system with 351, 488, 562, 658 and 732 nm lasers. The system was calibrated using SpeedBeads (Merck) prior to use and at least 40.000 events with an area > 10 µm2 based on brightfield images per sample were acquired. Moreover, 1000 events of single stained compensation control samples gated on appropriate signal size were acquired with the bright field channel and the 732 nm laser turned off. Images were acquired at 60 X magnification. The integrated software INSPIRE (version 200.1.388.0, Merck) was used for data collection as raw image files. Raw image files of respective stainings were merged. Single color controls were used to calculate a spectral crosstalk matrix that was applied to each raw image file for spectral compensations in the detection channels. Analysis was performed on the compensated image files using IDEAS (version 6.2.64.0, Merck) image analysis software.
The bright field gradient root mean square (RMS) feature was used to gate on cells that were in focus. Bright field area vs. aspect ratio features were plotted and used to discriminate single cells and cell conjugates. To identify monovalent T cell/target cell conjugates we gated on cell conjugates based on their area and aspect ratio in bright field images. To refine this further, we then gated on CD3 and E-Cadherin double-positive cells. Subsequently, we determined the signal size of the CD3 and the E-Cadherin staining by plotting the area vs. aspect area of the respective channels to gate on double-positive conjugates that contain a single CD3+ and a single E-Cadherin+ cell and thus correspond to monovalent T cell/target cell conjugates. Unconjugated T cells correspond to CD3+ single cells, while total T cells resembles CD3+ cells from both the single and the conjugate gate based on brightfield images.
Measurement of cytokine secretion
Cell culture supernatants were collected at indicated time points, and up to 15 analytes (IL-1α, IL-4, IL-5, IL-6, IL-10, IL-12, IL-13, IL-17, IL-22, IL-27, CXCL-13, CCL22, IFN-γ, TNF-α and LIF) were measured using a Magnetic Luminex Screening Assay (R&D Systems/Bio-Techne) on a Luminex LX100 system (Luminex, Austin, USA). Data acquired using the Luminex xPonent 2.3/3.1 firmware (software), represents the median fluorescence intensity of the respective analyte. For each standard curve a curve fit was applied according to the manufacturer’s manual. The sample concentrations were interpolated from the resulting regression equation. Each value was measured in experimental duplicates. In addition, IFN-γ and granzyme B were detected in supernatants by ELISA (Duoset; R&D Systems/Bio-Techne).
Statistical analysis
For statistical analysis Microsoft Excel 2007 was used.
Results
Vδ2 T cells expanded in the presence of TGF-β exhibit strong cytotoxic activity against tumor cells
To analyze the influence of TGF-β on the cytotoxic potential, purified Vδ2 T cells were selectively activated by the synthetic phosphoantigen BrHPP and expanded for 15 days in the presence of IL-2 or IL-15 with or without additional TGF-β. These expanded Vδ2 T cells were co-cultured with different tumor cell lines in the absence or presence of BrHPP. For the quantification of cytotoxic activity the RTCA method was used.
Quite strikingly, Vδ2 T cells expanded in the presence of TGF-β (i.e. Vδ2 [IL-2 + TGF-β] and Vδ2 [IL-15 + TGF-β]) had a much higher cytotoxic activity against Panc89 cells compared to control Vδ2 T cells (i.e. Vδ2 [IL-2] and Vδ2 [IL-15]) in the absence of BrHPP-restimulation. This was highly significant for high effector/target ratios (25:1; 12.5:1) irrespective of the cytokine used to expand γδ T cells (IL-2 or IL-15) (Figure 1A, B; Supp. Figure 1). In the additional presence of BrHPP, the cytotoxic activity of the Vδ2 T cells against co-cultured Panc89 cells was generally increased. However, TGF-β-expanded Vδ2 T-cell lines again displayed stronger cytotoxic activity, which was most pronounced in Vδ2 [IL-2 + TGF-β] T cells (Figure 1A, B; Supp. Figure 1). An enhanced cytotoxic activity of TGF-β-expanded Vδ2 T-cell lines was also observed against other tumor cell lines, generated from PDAC (Colo357, MiaPaCa2 and Panc1) or mammary gland adenocarcinoma (MCF-7) (Supp. Figure 2). To confirm that TGF-β was responsible for the differentiation of Vδ2 T cells towards enhanced cytotoxic potential, TGF-β-dependent SMAD2/3-phosphorylation and thus subsequent signalling was blocked by the ALK-inhibitor SB431542. The Vδ2 T-cell lines generated in the presence of 5 µM SB431542 displayed a significantly decreased cytotoxicity in the absence of BrHPP, whereas cytotoxicity was similar to the control Vδ2 T-cell lines after BrHPP-restimulation (Figure 1C).
Figure 1.

Cytotoxic activity of TGF-β-expanded Vδ2 T cells. Purified γδ T cells were initially activated by BrHPP and expanded in the presence of IL-2 ± TGF-β (A) or IL-15 ± TGF-β (B) or IL-15 + TGF-β ± DMSO or SB431542 (0.5 µM, 5 µM) (C). After 15 days of expansion the Vδ2 T-cell lines were restimulated with BrHPP or left untreated and then were directly added to Panc89 cells at the indicated E/T ratios (A-B) or at E/T ratio 12.5:1 (C) in a RTCA assay. Specific lysis of the target cells (Panc89) measured 4 h and 24 h after effector cell addition is depicted as mean values from 10 (A), 15 (B) or 4 (C) independent experiments with different donors. Error bars represent the SEM. Asterisks refer to significant differences according to Student´s t-test (*p ≤ 0.05; **p ≤ 0.01). E/T, effector to target ratio; medium, Vδ2 T-cell line expanded without DMSO or SB431542.
Figure 2.
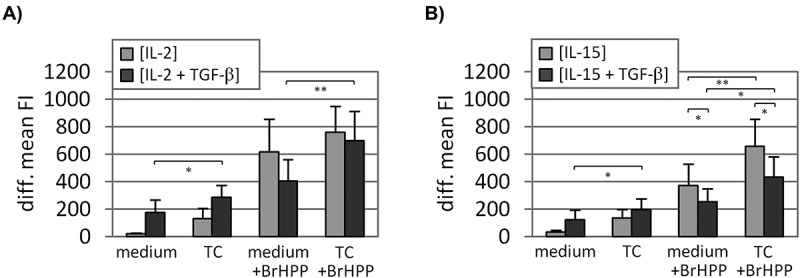
Degranulation determined by cell surface CD107a translocation. Purified γδ T cells were initially activated by BrHPP and expanded in the presence of IL-2 ± TGF-β (A) or IL-15 ± TGF-β (B). After 15 days of expansion, the Vδ2 T-cell lines were cultured alone or co-cultured with turmor cells (Panc89 cells; E/T, 12.5:1) with or without BrHPP-restimulation for 4h. The anti-CD107a (clone: H4A3) cell surface staining was measured by flow cytometry and is depicted as the isotype substracted mean fluorescence intensity (diff. mean FI). Depicted are the mean values of 8–12 independent experiments with different donors. Error bars represent the SEM. Asterisks refer to significant differences according to Student´s t-test (*p ≤ 0.05; **p ≤ 0.01). E/T, effector to target ratio; medium, Vδ2 T-cell line cultured without tumor cells; TC, tumor cells.
To determine if the enhanced cytotoxic activity of TGF-β-expanded Vδ2 T cells (as observed by RTCA) correlated with enhanced degranulation, the mobilization of CD107a to the cell surface was analyzed. In the absence of BrHPP-restimulation degranulation was more pronounced in TGF-β-expanded Vδ2 T-cell lines (i.e. Vδ2 [IL-2 + TGF-β], Vδ2 [IL-15 + TGF-β]) cultured alone or co-cultured with Panc89 cells compared to corresponding control Vδ2 T-cell lines (i.e. Vδ2 [IL-2], Vδ2 [IL-15]) (Figure 2A, B). BrHPP-restimulation increased the CD107a surface mobilization in all Vδ2 T-cell lines. In contrast to the enhanced degranulation observed in the absence of restimulation, TGF-β-expanded Vδ2 T-cell lines displayed less degranulation upon BrHPP-restimulation compared to the controls (Figure 2).
The cytokine profile of the differentially expanded Vδ2 T-cell lines was analyzed four days after initial stimulation by a bead-based multiplex assay. In the IL-2 and IL-15-expanded Vδ2 T-cell lines IFN-γ and TNF-α were the most abundant cytokines followed by IL-5 and IL-13. In the Vδ2 T-cell lines expanded in the additional presence of TGF-β these cytokines were detected in lower amounts (Figure 3A). To correlate the enhanced cytotoxic activity in TGF-β-expanded Vδ2 T-cell lines with other functional parameters, we analyzed the production of mediators implicated in cytotoxic effector activity (Figure 3B). Following 6 h of TPA/ionomycin stimulation, we found that IL-9 was specifically induced (accompanied by a significant increase of IFN-γ) only in TGF-β-expanded Vδ2 T-cell lines. Granzyme B was only increased in Vδ2 [IL-2 + TGF-β] T-cell lines, whereas granzyme A was clearly decreased in a TGF-β-dependent manner. The production of perforin and TNF-α was not significantly affected by expansion in the presence of TGF-β (Figure 3B). Since the enhanced cytotoxic activity of TGF-β-expanded Vδ2 T cells correlated with an enhanced production of IFN-γ and IL-9, we used blocking mAb to analyse the functional relevance of these mediators. The blockade of IL-9 had no effect, whereas the blockade of IFN-γ resulted in a significantly reduced cytotoxicity after 4 h of co-culture (Figure 3C). Detection of IFN-γ, granzyme B and soluble FasL by ELISA in the supernatants of BrHPP-restimulated Vδ2 T-cell lines co-cultured for three days with different tumor cell lines (Panc89, MiaPaCa2, MCF7, Panc1) also suggested an elevated production of these mediators by TGF-β-expanded Vδ2 T cells (Supp. Figure 3A), which correlated with a stronger proliferation of these Vδ2 T cells during the co-culture (Supp. Figure 3B).
Figure 3.

TGF-β-dependent modulation of soluble mediators. Purified γδ T cells were initially activated by BrHPP and expanded in the presence of and IL-2 ± TGF-β and/or IL-15 ± TGF-β. (A) Four days after inital stimulation, the amount of different mediators in cell-free culture supernatants was quantified by a bead-based muliplex assay. Median values from 3 independent experiments are depicted. (B) After 15 days of expansion, the Vδ2 T cells were activated for 6 h with TPA and Ionomycin. Monensin (3 µM) was added 4 h before fixation and subsequent intracellular staining with the specific mAb for granzyme A (clone: CB9), granzyme B (clone: GB11), IFN-γ (clone: 4S.B3), IL-9 (clone: MH9A3), perforin (clone: dG9), TNF-α (clone: 359–81-11) and the appropriate isotype controls. The differential mean fluorescence intensities were Z-normalized within each experiment. Same symbols correspond to same donors, mean values of 5–11 experiments are represented by horizontal bars. (C) Vδ2 T cells were initially activated by BrHPP and expanded in the presence of IL-15 + TGF-β. After 15 days of expansion, Vδ2 T cells were restimulated with BrHPP or were left untreated and then were directly co-cultured with Panc89 cells (E/T, 12.5:1) in a RTCA assay. IgG1 (clone: 11711.11), anti-IL-9 (clone: MH9D1), anti-IFN-γ (clone: B27) were added to the co-coculture. The quotient of the specific lysis in co-cultures treated with specific mAb relative to the specific lysis in isotype control-treated co-cultures 4 h and 24 h after effector cell addition is depicted as mean values from 8 experiments. Asterisks indicate significant differences in the specific lysis between the antibody- and isotype-treated co-cultures. Error bars represent the SEM. Asterisks refer to significant differences according to Student´s t-test (*p ≤ 0.05; **p ≤ 0.01). E/T, effector to target ratio.
The enhanced cytotoxicity of TGF-β-expanded Vδ2 T cells results from a modulated surface expression of adhesion molecules
Despite the enhanced cytotoxic activity, cell surface molecules known to be connected to γδ T cell mediated cytotoxic effector functions such as Natural Killer Group 2 (NKG2) D receptor and killer cell lectin like receptor G1 (KLRG1) were down-modulated in the presence of TGF-β (i.e. Vδ2 [IL-2 + TGF-β], Vδ2 [IL-15 + TGF-β]), while the inhibitory receptor NKG2A was up-regulated (Supp. Figure 4A, B). Furthermore, TGF-β-expanded Vδ2 T-cell lines displayed less CD107a surface mobilization upon BrHPP-restimulation, even though the anti-tumor cytotoxicity at least partially depended on IFN-γ secretion. We concluded that the enhanced cytotoxic activity might result from an intensified effector-/tumor cell interaction. Along this line, we found an altered chemokine receptor profile on TGF-β-expanded Vδ2 T cells, including the up-regulation of C-C Motif Chemokine Receptor (CCR) 4, CCR7, C-X-C Motif Chemokine Receptor (CXCR)3 and CXCR4 and down-modulation of CCR6 and CCR10 (Supp. Figure 4C, D). We furthermore analyzed the expression of important adhesion molecules on the Vδ2 T-cell lines (Figure 4A). Comparing IL-2 and IL-15-expanded Vδ2 T cells the most striking difference was a stronger expression of CD56 (NCAM) on IL-15-expanded Vδ2 T cells. The expression of the adhesion molecules CD54 (ICAM-1) and CD106 (VCAM-1) was enhanced in TGF-β-expanded Vδ2 T-cell lines, while the expression of CD56 was reduced. Among the analyzed integrins, CD103 was strongly induced, whereas LFA-1 (CD11a/CD18) surface expression was reduced (although still clearly expressed on all cells) in a TGF-β-dependent manner (Figure 4A). CD56 was reduced on both the CD103-positive and negative population of TGF-β-expanded Vδ2 T cells, albeit slightly more pronounced on the CD103-positive cells (Figure 4B). In line with the observed abrogation of spontaneous cytotoxicity (Figure 1C), the ALK-inhibitor SB431542, also counteracted the TGF-β-dependent modulation of adhesion molecules on Vδ2 T cells, with the most pronounced effects on CD54, CD103 and CD106 (Supp. Figure 5). When Vδ2 T-cell lines, expanded for 12 days without TGF-β, were treated with TGF-β for three more days, the early cytotoxicity (after 4 h) against Panc89 cells was decreased, irrespective of BrHPP-restimulation. After 48 h of co-culture without BrHPP-restimulation the Vδ2 [IL-2 + 3d_TGF-β] T-cell line had a stronger negative impact on the Panc89 cell-impedance compared to the control Vδ2 T-cell line (Supp. Figure 6A).
Figure 4.

TGF-β-dependent modulation of different adhesion molecules. Purified γδ T cells were initially activated by BrHPP and expanded in the presence of IL-2 ± TGF-β and/or IL-15 ± TGF-β. After 15 days of expansion the surface expression of the respective antigens was assessed by flow cytometry using mAb specific for CD11a (clone: HI111), CD18 (clone: 6.7), CD54 (clone: 84H10), CD56 (clone: CMSSB), CD103 (clone: Ber-ACT8) and CD106 (clone: STA). (A) The isotype corrected mean fluorescence intensity (diff. mean FI) is depicted. Same symbols correspond to same donors, mean values are represented by horizontal bars. Asterisks refer to significant differences according to Student´s t-test (*p ≤ 0.05; **p ≤ 0.01). (B) The dot plot for the specific mAb staining is depicted in dark color, the respective isotoype control in light color.
Figure 5.

CD11a and CD103 contribute to the enhanced cytotoxic activity of TGF-β-expanded Vδ2 T cells. (A) The surface expression of ICAM-1 (clone: 84H10) and E-cadherin (clone: 67A4) on tumor cells (Panc89, MiaPaCa2, MCF7, Panc1) measured by flow cytometry is depicted as histograms from one representative out of 4 experiments. The specific staining is depicted in dark grey, the respective isotype control in light grey. (B-C) Purified γδ T cells were initially activated by BrHPP and expanded in the presence of IL-15 + TGF-β. After 15 days of expansion, Vδ2 T cells were added to tumor cells (E/T, 12.5:1) in a RTCA assay. (B) Before tumor cell co-culture, Vδ2 T cells were labeled for 30 min with IgG2a isotype control (clone: 20116) or anti-CD103 (clone: 2G5) and then were restimulated with BrHPP or left untreated. The percentage of specific target cell lysis 4 h and 24 h after effector cell addition is depicted as mean values from 4 (MiaPaCa2) or 5 (Panc89, MCF7, Panc1) experiments. (C) Isotype control IgG1 (clone: 11711.11) and IgG2 (clone: MG2b-57), or anti-CD11a (clone: HI111) and anti-CD103 (clone: 2G5) antibodies were directly added to the co-culture with Panc89 cells as indicated. The ratio of the specific lysis in co-cultures treated with specific mAb and the specific lysis in isotype control-treated co-cultures 4 h and 24 h after effector cell addition is depicted as mean values from at least 3 experiments. Asterisks indicate significant differences in the specific lysis between antibody-treated- and the isotype control-treated co-cultures. Error bars represent the SEM. Asterisks refer to significant differences according to Student´s t-test (*p ≤ 0.05; **p ≤ 0.01). E/T, effector to target ratio; iso, isotype control.
Figure 6.

Localization of CD103 in Vδ2 T cell/target cell conjugates. Purified γδ T cells expanded in the presence of TGF-β, IL-15 and IL-2 low (10 IU/mL) were co-cultured with Panc89 cells for 45 min (E:T, 2:1). Cells were fixed, permeabilized, subsequently labeled with phalloidin and antibodies specific for CD3 (clone: UCHT1), CD103 (clone: Ber-ACT8) and E-Cadherin (clone: 67A4) and analyzed by imaging flow cytometry. (A) Two representative panels of Vδ2 [IL-2 low + IL-15 + TGF-β] T cells in a bivalent (upper panel) and a multivalent conjugate (lower panel) with Panc89 cells are depicted. (B) The percentage of the CD103-positive cells within the CD3-positive Vδ2 T cells was calculated for unconjugated, total and CD3-positive cells in bivalent conjugates (synapse). Mean values of 3 experiments are shown. (C) On CD103-positive Vδ2 T cells the intensity (fluorescence intensity) and the bright detail intensity (BDI) were analyzed on unconjugated, total or Vδ2 T cells in a bivalent conjugate. Mean values of 4 independent experiments and the SEM are shown.
On these short term (3 days) TGF-β-treated Vδ2 T-cell lines, CD56 was slightly down-modulated and CD103 was only very faintly induced (Supp. Figure 6B). These effects were both much less pronounced compared to Vδ2 T-cell lines in which TGF-β was present for the full period of expansion.
The functional relevance of TGF-β-induced CD103 expression on the Vδ2 T-cell lines for cytotoxicity was analyzed using tumor cell lines with differential expression of the CD103 ligand E-cadherin. According to the literature MCF7- and Panc1 cells are supposed to be positive and MiaPaCa2 cells negative for E-cadherin surface expression,22 whereas no reported information was available for Panc89 cells. We found E-cadherin to be present on the surface of MCF7- and Panc89 cells, but only weakly expressed on MiaPaCa2- and Panc1 cells. CD54 (ICAM-1) was found on MCF7-, Panc1- and Panc89 cells, but was absent on MiaPaCa2 cells (Figure 5A). When the CD103 interaction was inhibited by a blocking antibody (according to ref. 23) the cytotoxic activity of the BrHPP-restimulated Vδ2 [TGF-β + IL-15] T-cell line was significantly decreased in co-culture with MCF7- and Panc89 cells at early time points. In co-culture with Panc1 cells, which only express E-cadherin on some cells, the cytotoxicity was slightly decreased. CD103-blockade reduced the cytotoxicity in the absence of BrHPP-restimulation only in co-culture with MCF7 cells (Figure 5B). The combination of anti-CD11a and anti-CD103 resulted in a synergistic blocking effect (most striking shortly after effector cell addition; 4h), which was more pronounced than the cumulative effect of both single antibodies. Also, in the absence of BrHPP-restimulation the cytotoxicity was significantly reduced when both antibodies were used in combination (Figure 5C).
The functional analysis implied a role for CD103 in the cytolytic synapse formation of Vδ2 T cells. Therefore, we employed an image-based approach to analyze the CD103 surface expression and localization on Vδ2 [IL-2 low + IL-15 + TGF-β] T cells in co-culture with Panc89 cells. Optical inspection of acquired images revealed the presence of T cell/target cell conjugates with a polarization of CD103 together with CD3 within the synapse, that is characterized by F-actin polymerization (detected by phalloidin) (Figure 6A). The quantitative analysis revealed that CD103-positive Vδ2 T cells, which constituted 44% of the total Vδ2 T cells or 41% of the unconjugated Vδ2 T cells, were enriched in monovalent conjugates with Panc89 cells (synapse; 57%). The proportion of CD103-positive cells in conjugates with Panc89 cells was not affected by BrHPP-stimulation (Figure 6B). Within the CD103-positive population the overall fluorescence intensity was not different between unconjugated and Panc89 cell-bound Vδ2 T cells, indicating that the overall CD103 surface expression is not affected by synapse formation. However, in line with the observed clustering of the CD103 signal in the area of the synapse between Panc89- and Vδ2 T cells the CD103 bright detail intensity was higher in conjugated compared to non-conjugated T cells (Figure 6C).
As the imaging flow cytometry-based analysis revealed an enrichment of CD103-positive Vδ2 T cells within Panc89 tumor cell – Vδ2 T-cell conjugates, we asked if CD103 within the TGF-β-expanded Vδ2 T cells might discriminate populations with different functional properties. Therefore, the TGF-β-expanded Vδ2 T cells were magnetically sorted according to their CD103 surface expression after 12 days of expansion and three days before the functional analysis. Of note, the CD103 surface expression was stable for at least three days after the sorting (Supp. Figure 7A). The CD103-positive population (either magnetically sorted or FACS-gated within Vδ2 [IL-15 + TGF-β] T cells) tended to display a slightly higher surface expression of CD27 and CD45RA, but did not clearly reveal a different memory phenotype (Supp. Figure 7B). The synapse formation of CD103-positive Vδ2 T cells upon co-culture with tumor cells was further analyzed using a detachment assay as described by Netter et al.21 In the absence of BrHPP, the Vδ2 [IL-15 + TGF-β] T-cell line and CD103-positive population formed more stable conjugates compared to Vδ2 [IL-15] T cells and the CD103-negative population. In the presence of BrHPP, the conjugates generally were more stable, whereby again conjugates formed by Vδ2 [IL-15 + TGF-β] T cells and the CD103-positve population displayed the highest stability (Figure 7A).
Figure 7.

Functional characterization of CD103 sorted Vδ2 T-cell populations. Purified γδ T cells were initially activated by BrHPP and expanded in the presence of IL-15 ± TGF-β. After 12 days of expansion, the Vδ2 [IL-15 + TGF-β] T cells were magnetically sorted according to their CD103 surface expression and cultured for 3 more days. After a total of 15 days of expansion the Vδ2 T-cell lines were restimulated with BrHPP or left untreated and then were directly added to Panc89 cells at the E/T ratio 2:1 (A) or 12.5:1 (B-C). (A) The stability of the immunological synapse was analysed using a detachment assay. The amount of remaining conjugates was determined by flow cytomety after PFA-fixation at indicated time points and is depicted as mean values from 5 independent experiments with different donors. (B) After 4 h of co-culture the anti-CD107a (clone: H4A3) cell surface staining was measured by flow cytometry and is depicted as the isotype corrected percentage of CD107a-positive cells. Mean values from 4 (CD103 populations magnetically sorted) or 6 (FACS-gated on CD103 populations within Vδ2 [IL-15 + TGF-β] T-cell line) independent experiments with different donors are shown. (C) The specific lysis of the target cells (Panc89) measured by RTCA 4 h after effector cell addition is depicted as mean values from 7 independent experiments with different donors. Error bars represent the SEM. Asterisks refer to significant differences according to Student´s t-test (*p ≤ 0.05; **p ≤ 0.01). E/T, effector to target ratio; medium, Vδ2 T-cell line cultured without tumor cells; TC, tumor cells.
Interestingly, we found a significantly higher CD107a surface mobilization on the CD103-negative population compared to the CD103-positive population, when cells were restimulated with BrHPP in the absence or presence of Panc89 cells. In the magnetically separated populations this discrepancy was more pronounced than in the FACS-gated populations. The magnetically separated CD103-positive population responded to BrHPP-restimulation with a remarkably low CD107a surface mobilization (Figure 7B). Similar to what we found before (Figure 2), the CD107a surface mobilization did not correlate with cytotoxic activity. In the absence of BrHPP-restimulation the cytotoxic activity as measured by RTCA was significantly higher in the magnetically sorted CD103-positive population compared to total Vδ2 [TGF-β + IL-15] T cells and the CD103-negative population, which displayed the lowest cytotoxic activity. Upon BrHPP-restimulation, differences in the cytotoxic activity were less pronounced, even though the general tendency remained the same and was significantly higher in the CD103-positive population at the effector/target ratio of 12.5:1 (Figure 7C).
Discussion
TGF-β is regarded as a major immunosuppressive factor in the tumor microenvironment where it is produced in large amounts by tumor cells24 as well as by tumor-associated fibroblasts, macrophages and regulatory T cells (Treg).25 TGF-β is also a key factor for the induction of immunosuppressive γδ T cells.15,26 Nonetheless, in the present study we demonstrate that TGF-β can also enhance the cytotoxic activity of human γδ T cells. We previously reported that TGF-β-expanded Vδ2 T cells also produce high amounts of IL-9,17 but this is most likely not the reason for the enhanced cytotoxicity observed in our present study, since neutralizing anti-IL-9 antibodies did not affect the cytotoxic activity. Miao et al. described a direct cytotoxic effect of IL-9 (produced by Th9 T cells) on squamous cancer cells27 and Nalleweg et al. reported that IL-9 counteracted the proliferation of an epithelial tumor cell line.28 However, most other studies reporting a beneficial effect of IL-9-producing T cells on anti-tumor immunity were in vivo studies, in which IL-9 indirectly affected anti-tumor immunity. In mouse models, IL-9 has been shown to inhibit melanoma growth by influencing mast cells19 and to enhance the CCL20-production in lung metastases leading to recruitment of dendritic cells (DC), which in turn promoted the expansion of tumor specific CD8+ cytotoxic T cells.18 Due to their extended life span, IL-9-producing cytotoxic CD8+ T cells were superior effector cells. Upon adoptive transfer, they counteracted melanoma growth more effectively than conventional CD8+ T cells, yet expressed less cytotoxic effector molecules such as perforin and granzyme B and displayed reduced cytotoxic activity in vitro.29,30 In our hands, TGF-β-expanded IL-9-producing Vδ2 T cells did not show reduced granzyme B or perforin production, but instead displayed enhanced cytotoxic activity, which in part was mediated by the enhanced IFN-γ-production. Thus, although IL-9 did not have a direct effect on cytotoxicity in vitro, IL-9 produced by adoptively transferred Vδ2 T cells might still very well be beneficial for anti-tumor immunity in vivo. Furthermore, the high amounts of FasL mobilized by TGF-β-expanded Vδ2 T cells might generally also contribute to their enhanced cytotoxic potential. This, however, does not apply to the currently used PDAC tumor cells since most PDAC including Panc89 cells are known to be resistant to Fas/CD95-induced apoptosis.31
Cell surface expression of certain chemokine receptors and cell adhesion/interaction molecules was strikingly modulated on TGF-β-expanded Vδ2 T cells. Among the analyzed chemokine receptors, CCR4 was most prominently up-regulated. CCR4 is important for skin homing of immune cells, but it has been also demonstrated that the CCR4 ligand CCL22 is produced by tumor cells in murine pancreas carcinoma models. As a consequence, CCR4-expressing antigen-specific T cells infiltrated into the PDAC tumor and reduced the tumor burden more efficiently than control T cells expressing a non-functional CCR4.32 With respect to the cell adhesion molecule profile we observed a characteristic up-regulation of CD54, CD103 and CD106 on the TGF-β expanded Vδ2 T cells, whereas CD56 and LFA-1 were down-modulated. The induction of CD103 seems to be a general mechanism employed by different T-cell subsets in response to TGF-β exposure. Le Floc´h et al. found a TGF-β-induced CD103 surface expression on a CD8+ T-cell clone (isolated from human PBMC).23 In naïve (CD4+ CD62L+) murine CD4+ T cells differentiated under Th9 conditions, Jabeen et al. found a similar up-regulation of ITGAE (CD103) gene expression, which was more pronounced than in Treg.33 Schwartzkopff et al. described that the TGF-β-dependent induction of CD103 on both murine and human CD8+ T cells was accompanied by down-modulation of KLRG1,34 which we also observed in the present and a previous study.17 Similarly, the TGF-β dependent down-modulation of NKG2D and up-regulation of NKG2A observed by us for Vδ2 T cells has been described before in CD8+ T cells35 and NK cells36. Even though NKG2A is a negative regulator of T-cell activation, it was used before to characterize a population within NK cells with superior cytotoxic activity against autologous EBV+ B cells.37 In line, the CD103-positive population within TGF-β-expanded Vδ2 T cells, on which the NKG2A up-regulation was most pronounced, displayed the highest cytotoxic activity.
The induction of CD103 surface expression might be a way to guide ex vivo generated effector (γδ) T cells into the proximity of the tumor, since CD103 is of particular significance for the infiltration into the tumor and for the tumor cell-specific cytotoxicity of T cells. E-cadherin, the ligand for CD103, is typically expressed on epithelial cells and on differentiated (pancreas) tumor cells of epithelial origin. Furthermore, CD103 has been demonstrated to be directly involved in the recruitment of CD8+ T cells into epithelial tumors.38 Elevated numbers of CD103+ TIL in non-small cell lung carcinoma as well as in ovarian cancer have been correlated with an increased survival.39,40 Interestingly, the accumulation of CD103+ T cells (including CD8+ γδ T cells) has been reported for the fibrous stroma of PDAC.41
In a previous study, it was found that only the combination of CD3-stimulation and TGF-β induced CD103 on the surface of a CD8+ T-cell clone and thereby increased cytotoxicity against an autologous non-small cell lung carcinoma cell line.23 In line, the short-term treatment of Vδ2 T-cell lines (generated in the absence of TGF-β) with TGF-β alone did neither increase CD103 surface expression nor enhance their immediate cytotoxic activity. The cytotoxicity of TGF-β-expanded CD103-positive Vδ2 T cells was partially blocked by anti-CD103 antibodies in co-culture with E-cadherin-expressing tumor cells (MCF7, Panc89). This only partial abrogation of cytotoxicity after CD103-blocking is consistent with results from Franciszkiewicz et al. who demonstrated that both CD11a/CD18 (LFA-1) and CD103 contribute to the formation of the cytolytic immunological synapse in (human) CD8+ T-cell clones.42 We also found a functional redundancy between LFA-1 and CD103, which both were clearly expressed on TGF-β-expanded Vδ2 T cells. Since all E-cadherin-expressing tumor cell lines used in the present study also express CD54 (ICAM-1), only the combined blockade of both CD11a/CD18 (LFA-1) and CD103 resulted in a strong reduction of the Vδ2 T-cell cytotoxicity against tumor cells. During epithelial-mesenchymal transition (EMT) in tumor development, a loss/downregulation of epithelial markers occurs.43 In turn, CD54 (ICAM-1), albeit absent on normal pancreatic epithelia, is often expressed on pancreatic tumor cells.44 Therefore, the reciprocal significance of CD103 and LFA-1 is particularly important in the context of PDAC.
Furthermore, we demonstrated that CD103 is recruited into the cytolytic immune synapse formed between Vδ2 T cells and tumor cells, a phenomenon which has been observed before for CD8+ T cells. CD103 on a (human) CD8+ T-cell clone was shown to interact with E-cadherin on autologous non-small cell lung carcinoma target cells (E-cadherin+ ICAM-1−) and to mediate cytotoxicity by the induction of directed degranulation of IFN-γ and granzyme B. Nonetheless, for the formation of conjugates this interaction was reported to be insignificant.23,42 In contrast, we found that CD103+ Vδ2 T cells established a cytolytic synapse with tumor cells more frequently, exerted superior cytotoxic activity and formed cytolytic synapses, which were more stable over time compared with CD103− Vδ2 T cells.
Taken together, due to the high cytotoxic activity of CD103-positive effector cells and their potent IL-9-production, TGF-β-expanded Vδ2 T cells might represent a promising cell population for adoptive transfer as a treatment modality for certain solid cancers. It can be expected that CD103-expressing Vδ2 T cells more effectively target solid cancer in tissues, where the functional redundancy of CD11a and CD103 would allow for the interaction with tumor entities positive for different adhesion molecules (i.e., ICAM-1 and E-cadherin).
Funding Statement
This work was supported by the German Research Foundation (DFG; JA 6107-1; O.J.; KA 502/19-1; D.K.), the Else-Kröner-Fresenius Foundation (2013_A276; D.K.), the Erich und Gertrud Roggenbuck Foundation (C.P.), and the German Academic Exchange Service (DAAD; L.K.).
Abbreviations
TPA 12-O-tetradecanoylphorbol-13-acetate
ALK activin receptor-like kinases
BrHPP bromohydrin pyrophosphate
CCR C-C Motif Chemokine Receptor
CXCR C-X-C Motif Chemokine Receptor
DC dendritic cells
PDAC pancreatic ductal adenocarcinoma
KLRG1 killer cell lectin like receptor G1
mAb monoclonal antibody
NKG2 Natural Killer Group 2
PBMC peripheral blood mononuclear cell
RTCA Real Time Cell Analyzer
Treg regulatory T cell
TIL tumor infiltrating lymphocytes
Acknowledgments
We thank Thi Thuy Hoa Ly, Monika Kunz and Sandra Ussat for technical support. We thank Dr. Christian Röder for providing PDAC cell lines and Dr. Hans-Heinrich Oberg for the further propagation, STR-analysis and storage in liquid nitrogen.
Disclosure of Potential Conflict of Interest
DK is a member of the Scientific Advisory Board of Incysus, Ltd.
Supplementary Material
Supplemental data for this article can be accessed here.
References
- 1.Gu S, Nawrocka W, Adams EJ.. Sensing of pyrophosphate metabolites by Vgamma9Vdelta2 T cells. Front Immunol. 2014;5:688 PMID:25657647. doi: 10.3389/fimmu.2014.00688. [DOI] [PMC free article] [PubMed] [Google Scholar]
- 2.Buccheri S, Guggino G, Caccamo N, Li DP, Dieli F. Efficacy and safety of gammadeltaT cell-based tumor immunotherapy: a meta-analysis. J Biol Regul Homeost Agents. 2014;28:81–90. PMID: 24750794. [PubMed] [Google Scholar]
- 3.Helm O, Mennrich R, Petrick D, Goebel L, Freitag-Wolf S, Röder C, Kalthoff H, Röcken C, Sipos B, Kabelitz D, et al. Comparative characterization of stroma cells and ductal epithelium in chronic pancreatitis and pancreatic ductal adenocarcinoma. PLoS One. 2014;9:e94357 PMID:24797069. doi: 10.1371/journal.pone.0094357. [DOI] [PMC free article] [PubMed] [Google Scholar]
- 4.Oberg HH, Grage-Griebenow E, Adam-Klages S, Jerg E, Peipp M, Kellner C, Petrick D, Gonnermann D, Freitag-Wolf S, Röcken C, et al. Monitoring and functional characterization of the lymphocytic compartment in pancreatic ductal adenocarcinoma patients. Pancreatology. 2016;16:1069–1079. PMID:27424476. doi: 10.1016/j.pan.2016.07.008. [DOI] [PubMed] [Google Scholar]
- 5.Daley D, Zambirinis CP, Seifert L, Akkad N, Mohan N, Werba G, Barilla R, Torres-Hernandez A, Hundeyin M, Mani VRK, et al. gammadelta T cells support pancreatic oncogenesis by restraining alphabeta T cell activation. Cell. 2016;166:1485–1499. PMID:27569912. doi: 10.1016/j.cell.2016.07.046. [DOI] [PMC free article] [PubMed] [Google Scholar]
- 6.Lo Presti E, Dieli F, Meraviglia S. Tumor-infiltrating gammadelta T lymphocytes: pathogenic role, clinical significance, and differential programing in the tumor microenvironment. Front Immunol. 2014;5:607 PMID:25505472. doi: 10.3389/fimmu.2014.00607. [DOI] [PMC free article] [PubMed] [Google Scholar]
- 7.Meraviglia S, Lo Presti E, Tosolini M, La Mendola C, Orlando V, Todaro M, Catalano V, Stassi G, Cicero G, Vieni S, et al. Distinctive features of tumor-infiltrating gammadelta T lymphocytes in human colorectal cancer. OncoImmunology. 2017;6:e1347742 PMID:29123962. doi: 10.1080/2162402X.2017.1347742. [DOI] [PMC free article] [PubMed] [Google Scholar]
- 8.Gentles AJ, Newman AM, Liu CL, Bratman SV, Feng W, Kim D, Nair VS, Xu Y, Khuong A, Hoang CD, et al. The prognostic landscape of genes and infiltrating immune cells across human cancers. Nat Med. 2015;21:938–945. PMID:26193342. doi: 10.1038/nm.3909. [DOI] [PMC free article] [PubMed] [Google Scholar]
- 9.Dustin ML, Long EO. Cytotoxic immunological synapses. Immunol Rev. 2010;235:24–34. PMID:20536553. doi: 10.1111/j.0105-2896.2010.00904.x. [DOI] [PMC free article] [PubMed] [Google Scholar]
- 10.Kilshaw PJ, Higgins JM. Alpha E: no more rejection? J Exp Med. 2002;196:873–875. PMID:12370249. doi: 10.1084/jem.20021404. [DOI] [PMC free article] [PubMed] [Google Scholar]
- 11.Cerf-Bensussan N, Jarry A, Brousse N, Lisowska-Grospierre B, Guy-Grand D, Griscelli C. A monoclonal antibody (HML-1) defining a novel membrane molecule present on human intestinal lymphocytes. Eur J Immunol. 1987;17:1279–1285. PMID:3498635. doi: 10.1002/eji.1830170910. [DOI] [PubMed] [Google Scholar]
- 12.Schlickum S, Sennefelder H, Friedrich M, Harms G, Lohse MJ, Kilshaw P, Schön MP. Integrin alpha E(CD103)beta 7 influences cellular shape and motility in a ligand-dependent fashion. Blood. 2008;112:619–625. PMID:18492951. doi: 10.1182/blood-2008-01-134833. [DOI] [PubMed] [Google Scholar]
- 13.Vantourout P, Hayday A. Six-of-the-best: unique contributions of gammadelta T cells to immunology. Nat Rev Immunol. 2013;13:88–100. PMID:23348415. doi: 10.1038/nri3384. [DOI] [PMC free article] [PubMed] [Google Scholar]
- 14.Peters C, Oberg HH, Kabelitz D, Wesch D. Phenotype and regulation of immunosuppressive Vdelta2-expressing gammadelta T cells. Cell Mol Life Sci. 2014;71:1943–1960. PMID:24091816. doi: 10.1007/s00018-013-1467-1. [DOI] [PMC free article] [PubMed] [Google Scholar]
- 15.Casetti R, Agrati C, Wallace M, Sacchi A, Martini F, Martino A, Rinaldi A, Malkovsky M. Cutting edge: TGF-beta1 and IL-15 Induce FOXP3+ gammadelta regulatory T cells in the presence of antigen stimulation. J Immunol. 2009;183:3574–3577. PMID:19710458. doi: 10.4049/jimmunol.0901334. [DOI] [PubMed] [Google Scholar]
- 16.Ness-Schwickerath KJ, Jin C, Morita CT. Cytokine requirements for the differentiation and expansion of IL-17A- and IL-22-producing human Vgamma2Vdelta2 T cells. J Immunol. 2010;184:7268–7280. PMID:20483730. doi: 10.4049/jimmunol.1000600. [DOI] [PMC free article] [PubMed] [Google Scholar]
- 17.Peters C, Häsler R, Wesch D, Kabelitz D. Human Vdelta2 T cells are a major source of interleukin-9. Proc Natl Acad Sci USA. 2016;113:12520–12525. PMID:27791087. doi: 10.1073/pnas.1607136113. [DOI] [PMC free article] [PubMed] [Google Scholar]
- 18.Lu Y, Hong S, Li H, Park J, Hong B, Wang L, Zheng Y, Liu Z, Xu J, He J, et al. Th9 cells promote antitumor immune responses in vivo. J Clin Invest. 2012;122:4160–4171. PMID:23064366. doi: 10.1172/JCI65459. [DOI] [PMC free article] [PubMed] [Google Scholar]
- 19.Purwar R, Schlapbach C, Xiao S, Kang HS, Elyaman W, Jiang X, Jetten AM, Khoury SJ, Fuhlbrigge RC, Kuchroo VK, et al. Robust tumor immunity to melanoma mediated by interleukin-9-producing T cells. Nat Med. 2012;18:1248–1253. PMID:22772464. doi: 10.1038/nm.2856. [DOI] [PMC free article] [PubMed] [Google Scholar]
- 20.Oberg HH, Peipp M, Kellner C, Sebens S, Krause S, Petrick D, Adam-Klages S, Röcken C, Becker T, Vogel I, et al. Novel bispecific antibodies increase gammadelta T-cell cytotoxicity against pancreatic cancer cells. Cancer Res. 2014;74:1349–1360. PMID:24448235. doi: 10.1158/0008-5472.CAN-13-0675. [DOI] [PubMed] [Google Scholar]
- 21.Netter P, Anft M, Watzl C. Termination of the activating NK cell immunological synapse is an active and regulated process. J Immunol. 2017;199:2528–2535. PMID:28835459. doi: 10.4049/jimmunol.1700394. [DOI] [PubMed] [Google Scholar]
- 22.Nakajima S, Doi R, Toyoda E, Tsuji S, Wada M, Koizumi M, Tulachan SS, Ito D, Kami K, Mori T, et al. N-cadherin expression and epithelial-mesenchymal transition in pancreatic carcinoma. Clin Cancer Res. 2004;10:4125–4133. PMID:15217949. doi: 10.1158/1078-0432.CCR-0578-03. [DOI] [PubMed] [Google Scholar]
- 23.Le Floc’h A, Jalil A, Vergnon I, Le Maux CB, Lazar V, Bismuth G, Chouaib S, Mami-Chouaib F. Alpha E beta 7 integrin interaction with E-cadherin promotes antitumor CTL activity by triggering lytic granule polarization and exocytosis. J Exp Med. 2007;204:559–570. PMID:17325197. doi: 10.1084/jem.20061524. [DOI] [PMC free article] [PubMed] [Google Scholar]
- 24.Asselin-Paturel C, Echchakir H, Carayol G, Gay F, Opolon P, Grunenwald D, Chouaib S, Mami-Chouaib F. Quantitative analysis of Th1, Th2 and TGF-beta1 cytokine expression in tumor, TIL and PBL of non-small cell lung cancer patients. Int J Cancer. 1998;77:7–12. PMID:9639386. doi:. [DOI] [PubMed] [Google Scholar]
- 25.Massague J. TGFbeta in Cancer. Cell. 2008;134:215–230. PMID:18662538. doi: 10.1016/j.cell.2008.07.001. [DOI] [PMC free article] [PubMed] [Google Scholar]
- 26.Li X, Kang N, Zhang X, Dong X, Wei W, Cui L, Ba D, He W. Generation of human regulatory gammadelta T cells by TCR gammadelta stimulation in the presence of TGF-beta and their involvement in the pathogenesis of systemic lupus erythematosus. J Immunol. 2011. PMID:21562160. doi: 10.4049/jimmunol.1002776. [DOI] [PubMed] [Google Scholar]
- 27.Miao BP, Zhang RS, Sun HJ, Yu YP, Chen T, Li LJ, Liu JQ, Liu J, Yu HQ, Zhang M, et al Inhibition of squamous cancer growth in a mouse model by Staphylococcal enterotoxin B-triggered Th9 cell expansion. Cell Mol Immunol. 2015;4:371–379. PMID:26388239. doi: 10.1038/cmi.2015.88. [DOI] [PMC free article] [PubMed] [Google Scholar]
- 28.Nalleweg N, Chiriac MT, Podstawa E, Lehmann C, Rau TT, Atreya R, Krauss E, Hundorfean G, Fichtner-Feigl S, Hartmann A, et al. IL-9 and its receptor are predominantly involved in the pathogenesis of UC. Gut. 2015;64:743–755. PMID:24957265. doi: 10.1136/gutjnl-2013-305947. [DOI] [PubMed] [Google Scholar]
- 29.Lu Y, Hong B, Li H, Zheng Y, Zhang M, Wang S, Qian J, Yi Q. Tumor-specific IL-9-producing CD8+ Tc9 cells are superior effector than type-I cytotoxic Tc1 cells for adoptive immunotherapy of cancers. Proc Natl Acad Sci USA. 2014;111:2265–2270. PMID:24469818. doi: 10.1073/pnas.1317431111. [DOI] [PMC free article] [PubMed] [Google Scholar]
- 30.Lu Y, Wang Q, Yi Q. Anticancer Tc9 cells: long-lived tumor-killing T cells for adoptive therapy. Oncoimmunology. 2014;3:e28542 PMID:25054087. doi: 10.4161/onci.28542. [DOI] [PMC free article] [PubMed] [Google Scholar]
- 31.Ungefroren H, Voss M, Jansen M, Röder C, Henne-Bruns D, Kremer B, Kalthoff H. Human pancreatic adenocarcinomas express Fas and Fas ligand yet are resistant to Fas-mediated apoptosis. Cancer Res. 1998;58:1741–1749. PMID:9563493. [PubMed] [Google Scholar]
- 32.Rapp M, Grassmann S, Chaloupka M, Layritz P, Kruger S, Ormanns S, Rataj F, Janssen KP, Endres S, Anz D, et al. C-C chemokine receptor type-4 transduction of T cells enhances interaction with dendritic cells, tumor infiltration and therapeutic efficacy of adoptive T cell transfer. Oncoimmunology. 2015;5:e1105428 PMID:27195186. doi: 10.1080/2162402X.2015.1105428. [DOI] [PMC free article] [PubMed] [Google Scholar]
- 33.Jabeen R, Goswami R, Awe O, Kulkarni A, Nguyen ET, Attenasio A, Walsh D, Olson MR, Kim MH, Tepper RS, et al. Th9 cell development requires a BATF-regulated transcriptional network. J. Clin. Invest. 2013;123:4641–4653. PMID:24216482. doi: 10.1172/JCI69489. [DOI] [PMC free article] [PubMed] [Google Scholar]
- 34.Schwartzkopff S, Woyciechowski S, Aichele U, Flecken T, Zhang N, Thimme R, Pircher H. TGF-beta downregulates KLRG1 expression in mouse and human CD8 T cells. Eur J Immunol. 2015;8:2212–2217. PMID:26014037. doi: 10.1002/eji.201545634. [DOI] [PubMed] [Google Scholar]
- 35.Bertone S, Schiavetti F, Bellomo R, Vitale C, Ponte M, Moretta L, Mingari MC. Transforming growth factor-beta-induced expression of CD94/NKG2A inhibitory receptors in human T lymphocytes. Eur J Immunol. 1999;29:23–29. PMID:9933082. doi:. [DOI] [PubMed] [Google Scholar]
- 36.Castriconi R, Cantoni C, Della CM, Vitale M, Marcenaro E, Conte R, Biassoni R, Bottino C, Moretta L, Moretta A. Transforming growth factor beta 1 inhibits expression of NKp30 and NKG2D receptors: consequences for the NK-mediated killing of dendritic cells. Proc Natl Acad Sci USA. 2003;100:4120–4125. PMID:12646700. doi: 10.1073/pnas.0730640100. [DOI] [PMC free article] [PubMed] [Google Scholar]
- 37.Hatton O, Strauss-Albee DM, Zhao NQ, Haggadone MD, Pelpola JS, Krams SM, Martinez OM, Blish CA. NKG2A-expressing natural killer cells dominate the response to autologous lymphoblastoid cells infected with epstein-barr virus. Front Immunol. 2016;7:607 PMID:28018364. doi: 10.3389/fimmu.2016.00607. [DOI] [PMC free article] [PubMed] [Google Scholar]
- 38.Boutet M, Gauthier L, Leclerc M, Gros G, de MV, Theret N, Donnadieu E, Mami-Chouaib F. TGFbeta Signaling Intersects with CD103 Integrin Signaling to Promote T-Lymphocyte Accumulation and Antitumor Activity in the Lung Tumor Microenvironment. Cancer Res. 2016;76:1757–1769. PMID:26921343. doi: 10.1158/0008-5472.CAN-15-1545. [DOI] [PubMed] [Google Scholar]
- 39.Webb JR, Milne K, Watson P, Deleeuw RJ, Nelson BH. Tumor-infiltrating lymphocytes expressing the tissue resident memory marker CD103 are associated with increased survival in high-grade serous ovarian cancer. Clin Cancer Res. 2014;20:434–444. PMID:24190978. doi: 10.1158/1078-0432.CCR-13-1877. [DOI] [PubMed] [Google Scholar]
- 40.Djenidi F, Adam J, Goubar A, Durgeau A, Meurice G, de MV, Validire P, Besse B, Mami-Chouaib F. CD8+CD103+ tumor-infiltrating lymphocytes are tumor-specific tissue-resident memory T cells and a prognostic factor for survival in lung cancer patients. J Immunol. 2015;194:3475–3486. PMID:25725111. doi: 10.4049/jimmunol.1402711. [DOI] [PubMed] [Google Scholar]
- 41.Ademmer K, Ebert M, Muller-Ostermeyer F, Friess H, Buchler MW, Schubert W, Malfertheiner P. Effector T lymphocyte subsets in human pancreatic cancer: detection of CD8+CD18+ cells and CD8+CD103+ cells by multi-epitope imaging. Clin Exp Immunol. 1998;112:21–26. PMID:9566785. doi: 10.1046/j.1365-2249.1998.00546.x. [DOI] [PMC free article] [PubMed] [Google Scholar]
- 42.Franciszkiewicz K, Le FA, Boutet M, Vergnon I, Schmitt A, Mami-Chouaib F. CD103 or LFA-1 engagement at the immune synapse between cytotoxic T cells and tumor cells promotes maturation and regulates T-cell effector functions. Cancer Res. 2013;73:617–628. PMID:23188505. doi: 10.1158/0008-5472.CAN-12-2569. [DOI] [PubMed] [Google Scholar]
- 43.Krantz SB, Shields MA, Dangi-Garimella S, Munshi HG, Bentrem DJ. Contribution of epithelial-to-mesenchymal transition and cancer stem cells to pancreatic cancer progression. J Surg Res. 2012;173:105–112. PMID:22099597. doi: 10.1016/j.jss.2011.09.020. [DOI] [PMC free article] [PubMed] [Google Scholar]
- 44.Shimoyama S, Gansauge F, Gansauge S, Widmaier U, Oohara T, Beger HG. Overexpression of intercellular adhesion molecule-1 (ICAM-1) in pancreatic adenocarcinoma in comparison with normal pancreas. Pancreas. 1997;14:181–186. PMID:9057191. [DOI] [PubMed] [Google Scholar]
Associated Data
This section collects any data citations, data availability statements, or supplementary materials included in this article.