

Highlight
-
•
Seven thermal processing methods were conducted on peanuts at the palatable ranges.
-
•
Proteins in water soluble and insoluble fractions were extracted and tested for allergen reactivity.
-
•
The kinetics of the reactions caused by thermal processing was characterized.
-
•
Frying (6 min) was the best to reduce IgE binding to Ara h 2 among all the methods with optimal processing point.
Keywords: Peanut allergen, Thermal processing, Proximate analysis, Protein denaturation, Kinetic analysis, Water-soluble protein, SDS-sample-buffer-soluble protein, IgE-binding properties
Abstract
Peanuts contain four major allergens with differences in allergenic potency. Thermal processing can influence the allergenic properties of peanuts. Until now, a kinetic model has not been reported to assess the changes of soluble allergen (extracted from processed peanuts) content as affected by various thermal processing methods. Our objective is to characterize the reaction kinetics of the thermal processing methods, including wet processing (boiling with/without high-pressure, steaming with/without high-pressure), deep-frying and dry processing (microwaving and roasting) using five time intervals. The relationships between processing time and extractable major allergen content could be explained by a simple linear regression kinetic model (except high-pressure steaming). Among all the methods with optimal processing point, frying for 6 min had a relatively lower IgE binding (linear epitopes) ratio, possibly due to the processing conditions, which caused break down, cross-linking and aggregation of Ara h 2, and a relatively lower solubility.
1. Introduction
Peanuts are one of the most popular foods worldwide. However, peanut allergy is one of the most common causes of food-related fatal anaphylaxis (Sáiz, Montealegre, Marina, & García-Ruiz, 2013). The number of people with peanut allergies in the United States appears to be increasing (Pansare & Kamat, 2010). To date, 17 peanut allergens (Ara h 1[Arachis hypogaea 1] – Ara h 17) have been identified that are listed by the Allergen Nomenclature Sub-Committee of the International Union of Immunological Societies (Subcommittee, 2017). Of the 17 recognized peanut allergens, Ara h 1, Ara h 2, Ara h 3 and Ara h 6 are considered the major allergens because they are abundant and recognized by serum IgE of >50% of peanut allergic individuals (Mueller, Maleki, & Pedersen, 2014). Among these, Ara h 2 is regarded as the most potent for severe allergic reactions and higher IgE-binding properties (Schocker et al., 2016). Currently the only available treatment is complete peanut avoidance. However, avoiding peanuts in food products is difficult because of its ubiquitous use as an ingredient in processed foods.
Thermal and non-thermal processing methods are the two major strategies that have been used for allergen reduction in peanuts. The effects of thermal processing, including frying, boiling, steaming, roasting, microwaving and autoclaving, on allergenic properties of peanuts have been studied extensively (Cabanillas et al., 2012, Cabanillas et al., 2015, Chung and Reed, 2014, Maleki et al., 2000, Rao et al., 2016, Schmitt et al., 2009, Verhoeckx et al., 2015). Thermal processing may reduce or alter IgE binding due to degradation of allergens into small peptide fragments, and/or formation of aggregates, and interactions with other proteins, carbohydrates and lipids (Chung & Reed, 2014). Ara h 1, Ara h 2 and Ara h 3 have 21, 14 and 4 epitopes for IgE-binding, respectively (Lee, Wright, & Rachaputi, 2016). Thermal processing may also alter the IgE-binding potency by changing the conformation of epitopes. Boiling and frying have been reported to reduce allergic properties of peanuts compared to roasting (Beyer et al., 2001). Roasted peanuts may bind significantly higher IgE than raw peanuts due to the Maillard reaction (Maleki et al., 2000). High-pressure processing (2.56 atm, for 30 min) has been shown to reduce the allergenic properties of roasted peanuts (Cabanillas et al., 2012). Thermal processing has been found to alter the solubility and structure of peanut major allergens and may reduce allergenic properties under some conditions (Cabanillas et al., 2012, Schmitt et al., 2009), although thermal processing may not eliminate all of the allergenic potential (Verhoeckx et al., 2015). In order to understand how the peanut major allergens are changed under thermal processing in a quantitative way, developing kinetic models is important. There are some kinetic studies performed about denaturation of purified peanut allergen (Ara h 1) subjected to heat treatment studies (Koppelman et al., 1999, Montserrat et al., 2013). However, until now, a kinetic model has not been reported to assess the changes of soluble allergen (extracted from processed peanuts) content as a function of processing time under various thermal processing methods. Also, a comparison of IgE-binding properties of water-soluble/water-insoluble allergens in peanut processed by commonly used methods (such as high-pressure processing, steaming, boiling, microwaving, roasting, frying) within palatable texture ranges would be meaningful.
In this study, a common market type peanut variety (Virginia Jumbo) was analyzed under various processing conditions that produced palatable peanut texture. Our objective was to develop the kinetic model to characterize how the major water-soluble allergen content changes during processing, which would be useful for understanding and predicting the effects of processing on water-soluble allergen levels. The major constituents of peanuts, including moisture, lipid, protein, ash and carbohydrate, were analyzed under various processing treatments. The allergen IgE-binding properties of the peanut allergens were analyzed following the different processing methods.
2. Materials and methods
2.1. Materials
Whole-in-shell Virginia Jumbo peanuts (Waldron Farms, Citra, FL) were purchased from a food supplier, and were sun-dried (on a clean sheet over the concrete ground to the moisture content of kernel below 5%) and shell-removed before processing or protein extraction. Human plasma from six individuals with only peanut allergy (IgE levels CAP-FEIA >100 kU/I; contained anti-Ara h 1, Ara h 2 and Ara h 3 antibodies) were purchased from PlasmaLab International (Everett, WA). All the chemicals (analytical grade) were purchased from Sigma Chemical Co. (St. Louis, MO, U.S.A).
2.2. Methods
2.2.1. Thermal processing on peanut
Thermal processing methods, including boiling, high-pressure (1.02 atm, 15 psi) (HP) boiling, steaming, high-pressure (1.02 atm) (HP) steaming, frying (170 °C), roasting (177 °C) and microwaving (2.45 GHz). Fifty grams of peanuts per batch were used for each processing method. Boiling (no presoaking treatment) was conducted in a regular boiler with tap water (peanut-to-water ratio of 1:30, w/w to make sure the peanuts were immersed in water completely during the cooking process) and boiled for 30, 60, 90 and 120 min, respectively. HP boiling (no presoaking treatment) was conducted in an All American® high-pressure cooker (model 915, Wisconsin Aluminum Foundry, Manitowoc, WI), with peanut-to-water ratio of 1:30 (w/w) and processed for 10, 20, 30 and 40 min, respectively. In order to conduct steaming/HP steaming easily, peanuts were presoaked in tap water (peanut-to-water ratio 1:10, w/w) at room temperature for 12 h. The presoaked peanuts (about 1.5 times bigger) were used for steaming for 30, 60, 90 and 120 min, respectively, with a regular steamer. HP steaming was conducted in All American® high-pressure cooker (model 915, Wisconsin Aluminum Foundry, Manitowoc, WI) for 5, 10, 15, 20 min, respectively. Deep oil frying was conducted with a peanut-to-corn-oil ratio of 1:20 (w/w), in a temperature-controlled fryer (Model 35034, Hamilton Beach Co., Washington, NC). The time of frying was 2, 4, 6, and 8 min, respectively. Roasting was conducted in a temperature controlled Oster® toaster oven (model TSSTTVSK01, Jarden Co., NY). The time of roasting was 4, 8, 12 and 16 min, respectively. Microwaving was conducted in a microwave oven (model OGG61403-B, Jarden Co., NY). The time of microwaving was 0.75, 1.5, 2.25 and 3 min, respectively.
2.2.2. The protein extraction method for raw and processed peanut
The protein extraction for raw and processed peanut was conducted according to an earlier study (Schmitt et al., 2009) with some modifications. Briefly, approximately 5 g of the pre-frozen peanuts were milled with Magic bullet blender (Model No. MBR-1101, Capbran Holdings, LLC, Los Angeles, CA) into a coarse powder which were then ground with mortar and pestle in liquid nitrogen into a fine powder (could pass through 0.5 mm sieve). Five hundred mg of the peanut fine powder was defatted by adding 10 ml of acetone (store at −20 °C overnight) and shaken for 2 h in an orbital shaker. The suspension was centrifuged (2800 g for 15 min) and the pellet was dried under an exhaust hood overnight at room temperature. The defatted flours were stirred in 3 ml of 0.02 M sodium phosphate, pH 8.5, plus 10 mM EGTA at room temperature (RT) for 2 h. The aqueous fractions (referred to as the water-soluble fractions) thereafter were collected after centrifugation (2800 g) for 15 min at room temperature. The pelleted part after centrifugation was suspended in standard electrophoresis SDS-sample buffer (1% SDS + 5 mM dithiothreitol) and boiled for 5 min to extract proteins from the water-insoluble residue. The suspension in SDS-sample buffer were then centrifuged at 2795 g for 15 min. The collected supernatants in SDS-sample buffer (SDS-sample buffer soluble fractions) and water-soluble fractions were analyzed for protein content by the Bradford’s Method (Bradford, 1976). The sum of water-soluble and SDS-sample buffer soluble protein fraction was taken as the total extractable protein.
2.2.3. Sodium dodecyl sulfate-polyacrylamide gel electrophoresis (SDS-PAGE) and western-blot analysis
The SDS-PAGE was slightly modified according to earlier studies (Kang et al., 2007, Laemmli, 1970, Meng et al., 2016) with a Mini Protein Tetra System (BioRad, Hercules, CA). Water-soluble and SDS-sample buffer soluble extracts (adjusted to 2 mg/ml) were mixed with an equal volume of 2× SDS-PAGE sample buffer containing 5% β-mercaptoethanol. The mixture was boiled for 5 min and then centrifuged for approximately 5–10 s. Electrophoresis was performed on 13.5% (non-gradient) acrylamide gels for 1 h at 50 V followed by 1.5 h at 100 V. At the end of electrophoresis, gels were stained with Coomassie Brilliant Blue R-250. For the quantification of peanut major allergens (Ara h 1, Ara h 2 and Ara h 3), gels were scanned and analyzed by a Molecular Imager (Bio-Rad Chemidoc™ XRS+, Hercules, CA) equipped with Image Lab™ Analysis Software (version 5.2). The major allergens and their relative composition were calculated based on the band intensity in the gel as analyzed by the Image Lab™ Analysis Software. Allergen protein was quantified on the ratio of band intensities in the SDS-PAGE and the protein content of the soluble extracts (shown in the following section).
Changes in allergenic properties of existing allergens due to processing were analyzed by immunoassay of western-blot using the mixed plasma containing IgE antibodies from 6 peanut allergic individuals, as described by an earlier study (Chung & Reed, 2012). Briefly, protein extracts were transferred from SDS-PAGE gel to an Immobilon-P membrane. After blocking with a SuperBlock solution (Cat No. 37515, ThermoFisher, Waltham, MA), the membrane was incubated for 30 min with a pooled plasma diluted 1:20 (v/v) in Superblock/TBS-Tween 20 (1:1, v/v). The membrane was then washed with TBS/Tween and incubated with a rabbit anti-human IgE-peroxidase (1:250) and then washed 3 times for 10 min each with TBS Tween. After washing, the membrane was then incubated in the SuperSignal™ West Pico Chemiluminescent Substrate (Fisher Scientific, Pittsburgh, PA) for about 1 min. The incubated membrane was scanned and analyzed by a Molecular Imager (Bio-Rad Chemidoc™ XRS+, Hercules, CA) equipped with Image Lab™ Analysis Software (version5.2).
2.2.4. Quantification of allergens and estimate of total allergen IgE binding properties
Quantification of allergens was calculated based on the band intensity of SDS-PAGE, protein content (dry basis) of the extract and according to the following formula:
Allergen content (g/100 g peanut dry basis) = Ratio of band intensities (%) × protein content [g/100 g peanut dry basis, analyzed by the method of Bradford (1976)]
Quantification of Processed peanut Allergen IgE binding properties were based on the allergen content and intensities of western-blot and SDS-PAGE which shows as below:
Processed peanut Allergen IgE binding properties (%) = 100* Processed peanut Allergen content × (western-blot intensities/corresponded SDS-PAGE Intensities)/[Raw peanut Allergen content × (western-blot intensities/corresponded SDS-PAGE Intensities)]
2.2.5. Proximate chemical analysis
The proximate chemical analysis was performed to understand the processing effects on the major seed constituents. Moisture, lipid, protein and ash content were analyzed according to the standard AOAC methods of oven drying, Soxhlet extraction, Kjeldahl and furnace ashing, respectively (Method 934.01; Method 2003.06; Method 955.04; Method 942.05) (AOAC International, 2012). Carbohydrate content calculated by subtracting the lipid, protein and ash content (g/100 g peanut in dry base) from the total weight (100 g/100 g peanut on dry basis).
2.2.6. Kinetic analysis
Simple linear regression model was fitted as a first-order reaction, which was similar to our earlier thermal processing study on isoflavone in soybean (Zhang, Chang, & Liu, 2015). This model was conducted by using time (min) as the variate and log transformed water-soluble/total-extractable allergen content (µmol/100 g peanut, dry basis) as the response.
| (1) |
Integration from time 0 to t shows
| (2) |
| (3) |
| (4) |
K represents rate constant, which means log[allergen content] reduction per min.
The result was analyzed by using RStudio (Version 1.0.136, Boston, MA) to get the R square, constant rate K (slope) and P value.
2.2.7. Statistical analyses
Experiments were performed in duplicate for processing and triplicate for analysis. Data were analyzed by 2014 SAS (Version 9.4, SAS Inst. Inc., Cary, NC, U.S.A.) and RStudio (Version 1.0.136, Boston, MA). Significant differences among means were determined by the Duncan multiple range test procedure for independent samples at P < 0.05.
3. Results and discussions
3.1. Proximate chemical analysis of peanut processed by seven types of thermal processing treatments
Table 1 shows the proximate chemical composition of peanut under various thermal processing methods. The moisture content (wet base) of raw peanut (control) was 4.95%. The moisture of different processed peanuts varied widely with frying for 8 min containing the lowest amount of moisture (1.54%), and boiling for 2 h containing the highest amount of moisture (28%). Wet processing methods (boiling and steaming with/without HP) contained higher moisture content with approximately 5 times more than the control (dry peanut without processing). For microwaving and roasting, the moisture content of processed peanuts was not significantly different from the control. The result was not consistent with the study of Khalil and Chughtai (1983) who reported roasted peanut possessed with a lower moisture content (about 2%). The raw material used and the roasting time for the reported study (Khalil & Chughtai, 1983) was 30 min while for our study was 4–16 min, and had relatively less heat. Different roasting conditions in processing our peanut were considered in our study for the palatable acceptability, whereas palatability was not mentioned in the reported literature (Khalil & Chughtai, 1983). The palatability conditions of various processed peanuts were evaluated and the descriptions are listed in Table 1. The moisture content changes were represented by the gain and loss of the peanut weight after cooking.
Table 1.
The proximate composition and soluble/insoluble fractions’ protein of peanut under various thermal processing methods.
| Processing method/time (min) | Palatability condition | Moisture* | Lipid** | Protein** | Ash** | Carbohydrate** | Water-soluble fractions’ protein*** | SDS-sample buffer soluble fractions’ protein*** |
|---|---|---|---|---|---|---|---|---|
| Raw | Not edible | 4.95 ± 0.09 h | 47.82 ± 0.11 abc | 26.63 ± 0.12 abc | 2.92 ± 0.01 de | 22.63 ± 0.61 jk | 72.66 ± 6.21 a | 27.22 ± 2.08 i |
| M0.75 | Not fully cooked | 4.79 ± 0.50 h | 47.52 ± 3.09 abc | 25.55 ± 0.06 ghij | 2.82 ± 0.63 def | 24.11 ± 1.95 ghijk | 46.98 ± 3.45c | 44.54 ± 3.2 de |
| M1.5 | Not fully cooked | 4.63 ± 0.34 h | 47.12 ± 0.39 abcde | 24.92 ± 0.03 klmn | 2.80 ± 0.01 def | 25.16 ± 2.67 fghij | 46.38 ± 3.65 cd | 44.91 ± 3.34 cde |
| M2.25 | Well cooked | 4.67 ± 0.45 h | 48.12 ± 0.39 ab | 26.05 ± 0.19 defg | 3.03 ± 0.27 cde | 22.80 ± 2.19 ijk | 40.89 ± 3.28 e | 44.72 ± 3.52 cde |
| M3 | Well cooked | 4.51 ± 0.08 h | 48.17 ± 1.50 ab | 25.12 ± 0.30 jkl | 2.90 ± 0.10 def | 23.81 ± 1.09 hijk | 33.72 ± 2.64 g | 48.52 ± 3.73 bcd |
| R4 | Not fully cooked | 5.20 ± 0.09 h | 47.39 ± 1.20 abcd | 25.01 ± 0.39 klm | 1.98 ± 0.09 gh | 25.61 ± 0.67 efgh | 52.35 ± 3.79b | 28.51 ± 1.89 i |
| R8 | Not fully cooked | 5.10 ± 0.29 h | 47.53 ± 1.44 abc | 24.68 ± 0.24 lmn | 2.04 ± 0.01 gh | 25.76 ± 0.78 efgh | 51.41 ± 3.98b | 29.65 ± 1.97 i |
| R12 | Well cooked | 4.73 ± 0.03 h | 48.38 ± 1.36 ab | 26.95 ± 0.10 a | 1.99 ± 0.05 gh | 22.68 ± 0.86 jk | 36.65 ± 2.89 gf | 31.36 ± 2.76 hi |
| R16 | Little burnt | 5.00 ± 0.36 h | 48.76 ± 0.06 a | 26.84 ± 0.04 ab | 2.44 ± 0.39 fg | 21.96 ± 1.68 k | 23.85 ± 1.96 ij | 33.39 ± 2.65 h |
| HPB10 | Not fully cooked | 21.14 ± 1.92f | 45.34 ± 0.96 cdefgh | 25.09 ± 0.37 jkl | 3.02 ± 0.02 cde | 26.55 ± 1.90 defg | 25.54 ± 2.01 hi | 46.90 ± 3.73 bcd |
| HPB20 | Not fully cooked | 23.40 ± 0.14 cd | 44.39 ± 0.13 fgh | 25.53 ± 0.27 hij | 2.04 ± 0.29 gh | 28.04 ± 1.56 cde | 19.64 ± 1.55 kl | 47.88 ± 3.76 bcd |
| HPB30 | Well cooked | 25.70 ± 0.27b | 43.12 ± 0.96 hij | 25.30 ± 0.04 ijk | 1.35 ± 0.01 ij | 30.23 ± 0.45 abc | 18.25 ± 1.43 kl | 48.14 ± 3.75 bcd |
| HPB40 | Well cooked | 27.95 ± 0.08 a | 43.01 ± 4.80 hij | 26.13 ± 0.16 cdef | 1.09 ± 0.18 ij | 29.76 ± 0.28 abc | 15.55 ± 1.21 lm | 59.44 ± 3.99 a |
| HPS5 | Not fully cooked | 21.91 ± 0.17 ef | 45.34 ± 0.26 cdefgh | 26.28 ± 0.58 cde | 3.73 ± 0.36b | 24.65 ± 1.30 fghij | 13.18 ± 1.01 mno | 50.58 ± 3.54b |
| HPS10 | Not fully cooked | 24.25 ± 0.27c | 45.97 ± 0.43 bcdefg | 26.83 ± 0.19 ab | 1.60 ± 0.25 hi | 25.60 ± 2.02 efgh | 9.95 ± 0.67 nopq | 38.53 ± 3.1 fgh |
| HPS15 | Not fully cooked | 24.30 ± 0.50c | 43.93 ± 0.10 ghi | 25.90 ± 0.76 defgh | 2.04 ± 0.29 gh | 28.12 ± 1.76 cde | 9.28 ± 0.62 opq | 48.48 ± 3.43 bcd |
| HPS 20 | Well cooked | 24.07 ± 1.15 cd | 41.14 ± 0.54 j | 25.89 ± 0.42 defgh | 2.11 ± 0.06 g | 30.86 ± 0.77 ab | 8.75 ± 0.45 pq | 50.13 ± 4.03 bc |
| DF2 | Not fully cooked | 2.98 ± 0.11 i | 47.41 ± 2.15 abcd | 24.90 ± 0.23 klmn | 3.42 ± 0.11 bc | 24.27 ± 2.34 fghijk | 38.42 ± 3.02 ef | 41.12 ± 3.12 efg |
| DF4 | Well cooked | 2.31 ± 0.31 ij | 48.04 ± 2.14 abc | 24.03 ± 0.10 op | 3.40 ± 0.21 bc | 24.53 ± 0.78 fghijk | 20.99 ± 1.37 jk | 34.25 ± 2.45 h |
| DF6 | Well cooked | 1.60 ± 0.06 j | 48.09 ± 1.83 ab | 25.09 ± 0.23 jkl | 3.26 ± 0.70 bcd | 23.56 ± 1.34 hijk | 11.45 ± 0.78 mnop | 37.21 ± 2.88 gh |
| DF8 | Start to burn | 1.54 ± 0.10 j | 48.26 ± 0.73 ab | 24.53 ± 0.25 mno | 2.99 ± 0.02 cde | 24.22 ± 2.56 ghijk | 6.38 ± 0.46 q | 34.55 ± 2.65 h |
| B30 | Not fully cooked | 19.47 ± 0.37 g | 46.65 ± 0.82 abcdefg | 26.32 ± 0.14 cde | 3.65 ± 0.61 b | 23.38 ± 0.89 hijk | 46.53 ± 3.66 cd | 37.21 ± 2.69 gh |
| B60 | Well cooked | 21.27 ± 0.30 f | 46.34 ± 4.08 abcdefg | 26.36 ± 0.38 bcd | 2.05 ± 0.07 gh | 25.25 ± 0.69 fghij | 24.67 ± 1.84 ij | 43.45 ± 3.44 def |
| B90 | Well cooked | 24.14 ± 1.88 c | 46.97 ± 0.23 abcdef | 26.19 ± 0.02 cdef | 1.44 ± 0.01 ij | 25.39 ± 2.21 fghi | 18.89 ± 1.49 kl | 50.51 ± 4.01 b |
| B120 | Over cooked | 25.88 ± 1.99 b | 44.47 ± 0.60 efgh | 25.70 ± 0.13 fghi | 1.36 ± 0.27 ij | 28.46 ± 1.34 bcd | 14.01 ± 1.01 mn | 48.85 ± 3.77 bcd |
| S30 | Not fully cooked | 22.93 ± 0.79 de | 44.78 ± 0.66 defgh | 24.90 ± 0.19 klmn | 4.57 ± 0.57 a | 25.76 ± 2.09 efgh | 42.51 ± 3.29 de | 51.97 ± 3.99 b |
| S60 | Well cooked | 23.49 ± 0.59 cd | 44.19 ± 1.35 gh | 25.82 ± 0.53 efgh | 3.10 ± 0.05 cde | 26.90 ± 2.89 def | 29.10 ± 2.01 h | 58.69 ± 4.59 a |
| S90 | Well cooked | 24.24 ± 0.34 c | 42.96 ± 2.03 hij | 23.71 ± 0.29 p | 2.90 ± 0.31 def | 30.44 ± 1.40 abc | 9.80 ± 0.68 opq | 60.05 ± 4.55 a |
| S120 | Soft | 24.30 ± 0.28 c | 41.30 ± 0.87 ij | 24.50 ± 0.53 no | 2.77 ± 0.20 ef | 31.43 ± 0.99 a | 9.05 ± 0.71 pq | 60.42 ± 4.73 a |
The results are the means of 3 determinations ± SD within a column followed by different letters are significantly different (P < 0.05). *Expressed on wet basis (g/100 g peanut). **Expressed on dry basis (g/100 g peanut). ***Expressed on dry basis (g/100 g total protein). Defatted peanut powder firstly extracted by sodium phosphate buffer to obtain water-soluble fraction; the pellet was then extracted by SDS-sample buffer to obtain SDS-sample-buffer-soluble fraction. M: Microwaving; R: Roasting; HPB: High-pressure boiling; HPS: High-pressure steaming; DF: Deep frying; B: Boiling; S: Steaming.
Lipid content (dry basis) varied from about 41% to 49% among all the processing methods. Microwaving and roasting had no significant moisture changes (from the raw state) after processing. All wet processing methods decreased the lipid content (dry basis). The reason may be due to the free lipids that were leached out of the peanut kernels into the hot water when the processing time increased. Frying peanuts may also cause the loss of the lipid content at high temperatures, however the oil used for frying could also be absorbed on the surface of the peanuts and compensated for the lipid loss of the fried kernels. This can explain the reason that few oil content changes were observed for the fried peanut. The lipid extraction time for processed peanut samples was doubled (48 h) compared to raw peanut. This indicated the lipid was more difficult to extract with the organic solvent after thermal processing, perhaps due to change in the overall peanut matrix (i.e. enhanced lipid protein interactions). The protein may bind to lipids to form aggregates (Chung & Reed, 2014), which would make the extraction more difficult.
The protein content (dry basis) varied from about 24% to 27%, which changed little among different methods. Roasting for 12 min had the highest protein content, while steaming for 1.5 h had the lowest protein content. Boiled peanuts were found to lose some low molecular weight peptides/proteins during processing based on an earlier study (Mondoulet et al., 2005). Besides boiling, steaming also can result in loss of proteins into the water during the process of presoaking. However, the total protein content of peanut was not influenced much (less than 2% changes) with the method of boiling/steaming (Table 1).
The ash content of peanuts following different methods varied from about 1% to 5% (Table 1). The roasted and raw peanut ash content was similar to a previous study in which five varieties of peanuts were analyzed (Khalil & Chughtai, 1983). Boiling (with/without HP) resulted in lower amounts of the ash, which may be due possibly to the loss of minerals in the water. The carbohydrate content (dry basis) was calculated by subtracting the sum of analyzed proximate content above (lipid, protein, ash in dry basis) from the total content (100 g/100 g peanut dry basis). The contents of carbohydrate were varied from 21.96% to 31.43% (Table 1). Raw peanuts contained about 17.22% carbohydrate based on the review by Nwokolo and Smartt (1996). The relative wide ranges of carbohydrate content determined in the peanuts following different processing methods in this study may be due to the variations in lipid and ash content. Peanuts from all wet processing methods had higher ratio of carbohydrate content due to their relatively lower ratio of lipid content.
3.2. Processing effect on water-soluble major peanut allergen by SDS-PAGE and western-blot analysis
The effect of processing times (within palatable ranges) on the water-soluble allergens was assessed by SDS-PAGE (Fig. 1-A) and western-blot (Fig. 2-A), respectively. The objective of SDS-PAGE analysis was to visualize and quantitate the allergen content changes following various processing methods. While, the objective of western-blot analysis was to determine the presence, levels and reactivity of the allergen under various treatment conditions. For the SDS-PAGE analysis, all the protein concentrations were normalized (1 mg/ml in SDS sample buffer) and equal amounts of total protein (8 μg) were loaded for each sample. The relative band intensities of water-soluble proteins (allergens) before and after processing are shown in the Fig. 1-A. In microwaved peanuts, all the major allergens (as labeled) tended to show a similar distribution until the last minutes of processing. In the cases of roasting, HP steaming, frying, boiling and steaming, the intensity of the of Ara h 1 (62 kD) monomer band was reduced when processing time increased.
Fig. 1-A.

SDS-PAGE analysis of various thermal processing effects on water-soluble peanut protein. Seven processing methods were conducted at 5 time intervals, respectively. The processing methods and time (min) are shown below corresponding gel, respectively. M represents the molecular mass marker (molecular masses are shown beside the markers). Major allergen of Ara h 1 (63 kD), Ara h 2 (17, 19 kD), Ara h 3 (22, 38, 40 kD) and Ara h 6 (14 kD) are indicated on the right.
Fig. 2-A.

Western-blot analysis of the various thermal processing effects on water-soluble peanut protein. Seven processing methods were conducted at 5 time intervals, respectively. The processing methods and time (min) were labeled below the corresponded membranes, respectively. Molecular masses are shown on the left. Major allergen of Ara h 1 (63 kD), Ara h 2 (17, 19 kD), and Ara h 6 (14 kD) are indicated on the right. Pooled human plasma containing IgE antibody against peanut allergens were used for analysis.
Meanwhile, at the top of the separating gel, high molecular mass protein aggregate bands were formed and became darker with increased processing time for microwaving, roasting, boiling, HP boiling and deep-frying conditions (Fig. 1-A). The aggregated protein bands were more prominent in the SDS-sample-buffer-soluble fractions of roasted and deep oil fried peanut (Fig. 1-B). The result was similar to some earlier studies (Rao et al., 2016, Schmitt et al., 2009). The correlations between water-soluble Ara h 1 decreases and aggregate formation present in the SDS-sample-buffer-soluble formation were significant for the conditions of roasting and deep oil frying (R > 0.97, P < 0.05). This result confirmed that Ara h 1 formed water-insoluble aggregates after heat processing due to covalent cross-linking and hydrophobic interactions (Rahaman, Vasiljevic, & Ramchandran, 2016). The intensities of smeared bands under 10 kD also became darker when frying time increased to 8 min (Fig. 1-A), at which peanuts began to burn. This exact reaction occurred in roasting, when peanuts had been cooked long enough (Schmitt et al., 2009). This indicated that thermal processes could cause the water-soluble proteins to become aggregated via chemical cross-linking or broken down due to free-radicals attack on the protein side chains and peptide bonds.
Fig. 1-B.

SDS-PAGE analysis of various thermal processing effects on SDS-sample-buffer-soluble peanut protein. Seven processing methods were conducted at 5 time intervals, respectively. The processing methods and time (min) are shown below corresponding gel, respectively. M represents the molecular mass marker (molecular masses are shown beside the markers). Major allergen of Ara h 1 (63 kD), Ara h 2 (17, 19 kD), Ara h 3 (22, 38, 40 kD) and Ara h 6 (14 kD) are indicated on the right.
While under wet processing (boiling with/without HP, steaming with/without HP), the Ara h 1 monomer shows significantly more changes in intensity over the times measured here compared with the dry processing (microwaving, roasting and frying) methods (Fig. 1-A). Especially for steaming and HP steaming, the Ara h 1 levels in the water-soluble fractions (Fig. 1-A) were more significantly reduced over the time of treatment compared with other methods even at the beginning of processing. Therefore, steaming had a significant impact on the solubility of Ara h 1. Similar to Ara h 1, distinct water-soluble Ara h 2 bands (Fig. 1-A) also had relatively lower intensity in wet processing methods. All the SDS-PAGE of wet processed peanuts showed smeared bands at low molecular mass range, which had some similarity with fried processing. Among wet and fried processing methods, HP steaming had a higher ratio of smeared bands, which may be due to the thoroughness of cooking under pressure. The presoaked processing made the peanut soft due to penetration of moisture. Therefore, a more thorough protein hydration could make the proteins more susceptible to structural alteration. The HP cooking seemed to affect further the protein structures of the presoaked peanut allergens. HP boiling for 40 min and HP steaming for 20 min could decrease the water-soluble Ara h 3 content to very low levels, indicating the HP processing conditions could be arranged to alter the solubility of Ara h 3.
Fig. 2-A shows the effect of the corresponded processing methods on the water-soluble fractions by western-blot with pooled human plasma containing peanut-specific IgE antibody. Wet processing methods, which had low SDS-PAGE band intensity in the three major allergens (in water-soluble fractions), showed similar less IgE reaction in the western-blot analysis. The reason was due to the low protein content in the water-soluble part (Fig. 1-A, Table 1). The Ara h 1 allergen had less intensity comparing with the Ara h 2, which might be due to the sensitivity of pooled patients’ plasma (Fig. 2-A). The plasma used in this study had been confirmed for its anti-Ara h 1, Ara h 2 and Ara h 3 reactivity by the company. Although Ara h 1 and Ara h 2 accounted for >90% of patients’ recognition (Burks et al., 1998, Singh et al., 2016), the relative IgE binding to these major allergens was different. Among all the methods, microwaving, roasting, deep frying exhibited higher IgE-binding properties (water-soluble fractions, 2 mg/ml) in terms of high intensity bands on western-blot. However, water-soluble protein content must be considered for evaluating the water-soluble allergen IgE binding properties and will be discussed in the following sections.
3.3. Processing effect on SDS-sample-buffer-soluble peanut protein by SDS-PAGE and western-blot analysis
The water-insoluble component of the peanut protein extracts still contained a considerable amount (as much as about 60 g/100 g total protein) of proteins, especially when the processing time increased (Table 1). This result was consistent with the earlier study (Schmitt et al., 2009). Therefore, SDS buffer was used to extract protein for the water insoluble part. Results showed all thermal processing methods had higher band intensities in SDS-sample buffer-soluble part than in the water-soluble part due to a combination of chemical modification and aggregation. The extent of changes in water-soluble/SDS-sample-buffer-soluble proteins is characterized in Fig. 3-A, Fig. 3-B-A, -B, and will be discussed in the following section. For microwaving, roasting and deep frying, along with an increase in processing time, the intensities of the aggregated bands at the top of the separating gel (>250 kD) and in the stacking gel (those bands did not move into the separating gel) were also increased (Fig. 1-B). This was similar to the water-soluble protein SDS-PAGE (Fig. 1-A) but with higher band intensity, indicating that peanut proteins were less water-soluble following aggregation. On the top of the stacking gels and separating gels, there are apparent aggregates formed along with the processing time increases in most of the methods, especially in dried and fried processing methods. The aggregates could partially explain the loss of major allergens such as Ara h 1 and h 3, and it would be meaningful to calculate the amount of aggregates to better understand the changes of protein structure after processing. Quantitative analysis of aggregates content will be discussed in the following sections.
Fig. 3-A.

Processing effect on water-soluble allergen content (g/100 g peanut dry basis) based on SDS-PAGE. Quantification analysis of allergen content were based on the band intensities and protein content.
Fig. 3-B.

Processing effect on SDS-sample-buffer-soluble allergen content (g/100 g peanut dry basis) based on SDS-PAGE. Quantification analysis of allergen content were based on the band intensities and protein content.
The western-blot of the SDS-sample-buffer-soluble part is shown in Fig. 2-B. Steaming, boiling and HP boiling also showed higher intensity compared with the water-soluble part (Fig. 2-A), especially the intensity of Ara h 2 (19, 17 kD), which was significantly higher in Fig. 2-B. The method applied in this study (steaming, boiling and HP boiling) could alter the solubility of Ara h 2 (Fig. 1-A) but could not eliminate the IgE antibody-reactivity in the whole processed peanut since there were still strong IgE-binding properties remaining in the western-blot of the SDS-sample-buffer-soluble part (Fig. 2-A, Fig. 2-B). However, HP steaming and frying resulted in less band intensity in the last time points (HP steaming 20 min and frying 6–8 min) (Fig. 2-B). The IgE binding to the 17 kD isoform of Ara h 2 following deep frying for 6–8 min was much less than in other processing methods (Fig. 2-B), which was most likely due to aggregation of this Ara h 2 isoform with other intact and degraded proteins and formation of the higher and/or lower molecular weight smears, particularly visible in the higher time points. HP steaming for 20 min also showed certain decreases in band intensity compared with the raw peanuts or lower time points. The band intensity of Ara h 1 monomer was not very dark, but also could not accurately be quantitated due to smearing (which also showed IgE antibody reactivity) as a result of oligomer formation, degradation and reassociation of protein and peptide fragments via chemical cross linking. The study of Schmitt et al. (2009) had similar but stronger bands of Ara h 1 monomer. The differences from our study may be due to the variations in the levels or sensitivity of plasma.
Fig. 2-B.

Western-blot analysis of the various thermal processing effects on SDS-sample-buffer-soluble peanut protein. Seven processing methods were conducted at 5 time intervals, respectively. The processing methods and time (min) were labeled below the corresponded membranes, respectively. Molecular masses are shown on the left. Major allergen of Ara h 1 (63 kD), Ara h 2 (17, 19 kD), and Ara h 6 (14 kD) are indicated on the right. Pooled human plasma containing IgE antibody against peanut allergens were used for analysis.
3.4. Quantitative and kinetic analysis of peanut water-soluble allergen under various processing methods
The solubility of peanut protein was affected by thermal processing methods and processing times. The water-soluble protein yield of raw peanuts was 72% of total protein. However, the solubility of the protein was decreased along with increased processing time. Frying 8 min resulted in the lowest water-soluble protein yield of 6.4% of total protein (dry basis), which decreased 66.5% of the solubility (Table 1). Allergen quantitative determination was based on the band intensities and protein contents. The peanut processing effect on water-soluble protein (allergen) content is shown in Fig. 3-A. Water-soluble Ara h 1, Ara h 2 and Ara h 3 content measured by the method of Bradford (1976) of raw peanuts are 3.2, 1.9 and 9.5 g/100 g peanut (dry basis), respectively (Fig. 3-A). Boiling, HP boiling, Steaming, HP steaming and deep frying all decreased the water-soluble Ara h 1 and Ara h 2 content into nearly zero amount (less than 0.1 g/100 g peanut for Ara h 1 and less than 0.2 g/100 g peanut for Ara h 2) by the end of cooking within the palatable ranges (Fig. 3-A). These findings were consistent with a recent study of Comstock, Maleki, and Teuber (2016), in which they found that boiling and frying could decrease the solubility of Ara h 1 and Ara h 2 due to the conformation changes.
The allergen contents decreased more dramatically in the beginning of each processing method than at the later time points (Fig. 3-A). The general relationship between protein (SDS-PAGE band) content and processing time appeared to fit first-order kinetics reaction model (Zhang et al., 2015). Therefore, a simple linear regression model was fitted and conducted by using time (min) as variate (X) and log transformed water-soluble allergen content (g/100 g peanut, dry basis) as response (Y). The rate constant K (slope of the linear regression), R square and P value are all listed in Table 2-A. Boiling, steaming, HP boiling, frying, roasting and microwaving suited first-order reaction model well with all R squares higher than 0.85 (P < 0.05) and most of them higher than 0.95 (P < 0.01). Meanwhile, HP steaming had relative lower R squares for Ara h 1, Ara h 2 and Ara h 3, indicating the reduced fitness in the first-order reaction models. The reason may be due to the overnight presoaking process, which provided more hydration (water activity) combined with HP processing that, in turn, contributed more significant-conformational changes than other processing methods. Frying resulted in the highest R square on water-soluble Ara h 1, Ara h 2 and Ara h 3 (0.99 for all of them) among all the processing methods, indicating the highest fitness of the applications to the first-order reaction model.
Table 2-A.
Rate constant, adjusted R square and P value of water-soluble Ara h 1, Ara h 2 and Ara h 3 content under different processing methods based on the first order assumption (calculated from the data of Fig. 3-A).
| Processing method | Allergen | Rate constant (K) | R square | P value |
|---|---|---|---|---|
| Microwaving | Ara h 1 | 0.18 | 0.96 | 0.009** |
| Ara h 2 | 0.12 | 0.98 | 0.04* | |
| Ara h 3 | 0.1 | 0.98 | 0.003** | |
| Roasting | Ara h 1 | 0.05 | 0.93 | 0.024* |
| Ara h 2 | 0.02 | 0.98 | 0.005** | |
| Ara h 3 | 0.03 | 0.95 | 0.012* | |
| HP boiling | Ara h 1 | 0.05 | 0.96 | 0.008** |
| Ara h 2 | 0.03 | 0.85 | 0.044 | |
| Ara h 3 | 0.05 | 0.98 | 0.003** | |
| HP steaming | Ara h 1 | 0.13 | 0.8 | 0.104 |
| Ara h 2 | 0.05 | 0.8 | 0.102 | |
| Ara h 3 | 0.26 | 0.72 | 0.17 | |
| Frying | Ara h 1 | 0.24 | 0.99 | 0** |
| Ara h 2 | 0.13 | 0.99 | 0.001** | |
| Ara h 3 | 0.14 | 0.99 | 0.001** | |
| Boiling | Ara h 1 | 0.01 | 0.96 | 0.01* |
| Ara h 2 | 0.01 | 0.87 | 0.013* | |
| Ara h 3 | 0.01 | 0.99 | 0.001** | |
| Steaming | Ara h 1 | 0.14 | 0.88 | 0.027** |
| Ara h 2 | 0.01 | 0.96 | 0.01* | |
| Ara h 3 | 0.01 | 0.96 | 0.008** | |
* P value less than 0.05. ** P value less than 0.01.
t = −Kt + b. K represents constant rate.
The rate constant K, which represented the unit time (min) of log [water-soluble allergen] decreased. The rate constants were the highest in the frying with 0.24, 0.13 and 0.14 for Ara h 1, Ara h 2 and Ara h 3 (Table 2-A). In contrast, the rate constants were relative low in boiling and steaming (about 10–20 folds lower than frying) among all the methods. The temperature used for boiling and steaming were the lowest (100 °C) among all the processing methods. The relatively lower temperature maybe the reason for the low constant rate. The temperature used for frying was 170 °C, which was not the highest compared with roasting (177 °C) and microwaving. However, deep frying was conducted by immersing the peanuts into the high temperature oil which would heat up the peanut efficiently and evenly. While roasting and microwaving peanuts might not have been heated as homogeneously as deep frying due to air conductivity or microwave reaction mechanism. Microwaving is well known to produce less uniform heating due to the positional effect. However, microwaving caused significant water-soluble allergen reduction compared to roasting in this study, probably due to the higher heat penetration. HP boiling appeared to reduce the water-soluble allergen in a manner similar to roasting.
3.5. Quantitative analysis of SDS-sample buffer soluble allergen and kinetic analysis of total extractable peanut allergen under various processing methods
SDS-sample-buffer-soluble protein of the raw peanuts was 26% of the total protein (Table 1). The sum of water-soluble and SDS-sample-buffer-soluble protein was 98%, which was equivalent to the total protein from the raw peanuts. Quantitative analysis of SDS-sample-buffer-soluble peanut allergen is presented in Fig. 3-B. Compared with Fig. 3-A, the SDS-sample-buffer-soluble peanut allergen did not appear to increase at the same level as that of the decreases in the water-soluble peanut allergen with processing time. This may be due to the chemical modifications or conformational changes in the allergens which can result in aggregate formation and smears, which were difficult to quantify. The quantification of smears is difficult due to the large area occupied and the lack of distinct bands. The aggregates at the top of stacking gels and separating gels were quantified and shown in Fig. 3-C. All processing methods resulted in higher amount of aggregates at the end points of heating. Frying-8 min resulted in the highest amount of aggregates (about 1.72 g/100 g peanut). However, the end points of wet processing (with/without HP) methods resulted in the lowest amount of aggregates (about 0.63 g/100 g peanut).
Fig. 3-C.

Processing effect on water-insoluble (but SDS-sample-buffer-soluble) aggregate content (g/100 g peanut dry basis) based on SDS-PAGE. Quantification analysis of aggregate content were based on the band intensities and protein content.
A high amount (as much as 55% of total protein, Table 1) of highly insoluble peanut residues still present after a two-step extraction (water/sodium phosphate buffer extraction followed by the standard electrophoresis SDS-sample-buffer extraction). The highly insoluble protein residue may bind tightly with carbohydrates or lipids after thermal processing (Chung & Reed, 2014). Total extractable peanut allergen content was calculated by taking the sum of water-soluble allergen (Fig. 3-A) and SDS-sample-buffer-soluble allergen (Fig. 3-B) content. The plotted graph of the processing effect on total extractable allergen content is shown in Fig. 3-D. The total extractable allergen (percentage of total peanut protein, sum of Ara h 1, Ara h 2 and Ara h 3) content (data are no shown) was lower in processed peanuts (12–46%) than in raw peanuts (65%). The total extractable allergen content (a percentage of total protein content) at the end of processing point for various processed peanuts exhibited a descending order: microwaving (46%), steaming (34%), boiling (29%), HP steaming (25%), HP boiling (23%), roasting (21%) and frying (15%). Burnt peanuts (Table 1) processed by roasting (16 min) and frying (8 min) had lower total allergen contents. The result could partially explain the processing effect on the protein structure changes.
Fig. 3-D.

Processing effect on peanut total extractable allergen content (g/100 g peanut dry basis) based on SDS-PAGE. Total extractable allergen content was the sum of water-soluble and SDS-sample-buffer-soluble allergen content.
The curves (Fig. 3-D) were examined for the goodness of fit to the first-order reaction activities, and were performed by using time (min) as variate and log transformed total extractable allergen content (g/100 g peanut, dry basis) as response. Roasting, microwaving, frying and HP boiling fitted the model well on all three major allergens with adjusted R square higher than 0.85 (P < 0.05) (Table 2-B). Boiling fitted the model well on Ara h 1 and Ara h 3. Steaming fitted the model well on Ara h 2 and Ara h 3. HP steaming did not fit well on all the major allergens, which was similar to the previously part (water-soluble allergen). Frying showed the highest R square (0.99) in both (water-soluble and total extractable allergen) kinetic analyses, showing the high predictable possibility using the first-order reaction model.
Table 2-B.
Rate constant (K), R square and P value of total extractable Ara h 1, Ara h 2 and Ara h 3 subunit content under different processing methods based on the first order assumption (calculated from the data of Fig. 3-D).
| Processing method | Allergen | Rate constant (K) | R square | P value |
|---|---|---|---|---|
| Microwaving | Ara h 1 | 0.18 | 0.96 | 0.009** |
| Ara h 2 | 0.07 | 0.99 | 0** | |
| Ara h 3 | 0.03 | 0.94 | 0.017* | |
| Roasting | Ara h 1 | 0.05 | 0.94 | 0.017* |
| Ara h 2 | 0.02 | 0.97 | 0.008** | |
| Ara h 3 | 0.03 | 0.95 | 0.006** | |
| HP boiling | Ara h 1 | 0.02 | 0.94 | 0.018* |
| Ara h 2 | 0.03 | 0.88 | 0.044* | |
| Ara h 3 | 0.01 | 0.89 | 0.05* | |
| HP steaming | Ara h 1 | 0.02 | 0.65 | 0.22 |
| Ara h 2 | 0.02 | 0.66 | 0.22 | |
| Ara h 3 | 0.01 | 0.60 | 0.28 | |
| Frying | Ara h 1 | 0.16 | 0.99 | 0.001** |
| Ara h 2 | 0.10 | 0.99 | 0** | |
| Ara h 3 | 0.06 | 0.99 | 0.001** | |
| Boiling | Ara h 1 | 0.002 | 0.87 | 0.05* |
| Ara h 2 | 0.002 | 0.75 | 0.14 | |
| Ara h 3 | 0.002 | 0.97 | 0.006** | |
| Steaming | Ara h 1 | 0.002 | 0.81 | 0.094 |
| Ara h 2 | 0.003 | 0.97 | 0.008** | |
| Ara h 3 | 0.001 | 0.90 | 0.04* | |
* P value less than 0.05. ** P value less than 0.01.
t = −Kt + b. K represents constant rate.
3.6. Water-soluble and SDS-sample buffer soluble allergen IgE binding properties under various processing methods
From the western-blot figures (Fig. 2-A, Fig. 2-B), the bands of Ara h 2 (both isoforms at 19 kD and 17 kD) were clearer than the other two allergens (Ara h 1 and Ara h 3), which were difficult to quantify due to smears and less binding by the IgE from human plasma. Therefore, only the IgE binding to Ara h 2 was quantified here (Fig. 4-A, Fig. 4-B-A, -B). It is necessary to point out that the IgE binding properties evaluated in this study were mostly based on the binding properties of the linear epitopes, due to the fact that SDS-sample-buffer-soluble allergen was already denatured after extraction, and the fact that proteins were heated in SDS-sample buffer containing reagent before performing SDS-PAGE, which was followed by the western-blot analysis. In addition, the protein after mixing with sample-buffer for reducing SDS-PAGE also had denatured. The SDS-reducing reagent (2-mercaptoethanol) used for extraction and SDS-PAGE had transformed the protein structure to a linear form, which made it impossible retain to evaluate the IgE-bindings of the conformational epitopes. IgE binding to the water-soluble Ara h 2 under the best selected conditions of each processing method is shown in Fig. 4-A. Compared to the untreated (raw) peanut, after roasting for 12 min, the IgE binding to Ara h 2 (19 kD), Ara h 2 (17 kD) was retained 71% and 59%, respectively, which were significantly higher than the other processing methods except microwaving. Microwaving for 3 min also retained relatively higher degree of IgE binding to Ara h 2 with about 50% of the raw peanuts for both isoforms. The IgE binding to the Ara h 2 in the SDS-sample-buffer-soluble fractions, under various processing methods is shown in Fig. 4-B. The Ara h 2 in almost all of the processing methods tested had greater IgE binding properties compared with the control, except for frying and HP steaming. Frying for 6 min reduced the IgE binding to distinct (unsmeared) Ara h 2 (19 kD) and Ara h 2 (17 kD) to 70% and 38%, respectively. HP steaming for 15 min reduced the IgE binding properties to distinct (unsmeared) band of Ara h 2 (19 kD) to 75%. The results were consistent with previous observations that the proteins aggregate could fall out of solution gradually to become less visible on SDS-PAGE gel pattern of the water-soluble fractions. Also frying peanuts for 6 min causes break down, cross-linking and aggregation of Ara h 2 (similar to Ara h 1 and Ara h 3) in the SDS-sample-buffer-soluble fractions and therefore diffusion of the IgE binding to the distinct bands over time. High level of aggregation could be seen in 6 and 8 min lanes of the fried peanuts (Fig. 1-B), all of which might be due, in part, to the Maillard reaction. It had been reported that the structure of Ara h 1 after roasting (Maillard reaction) was retained and with better IgE-binding properties, which might be due to alterations such as chemical modifications on the amino acids or increased epitope exposure (Nesbit et al., 2012). The Ara h 2 also had higher IgE-binding properties after the Mallard reaction (Maleki, Chung, Champagne, & Khalifah, 2001), and with higher anti-trypsin digestibility (Maleki et al., 2003). While the IgE binding to the Ara h 2 isoforms is diffusing, for the purposes of our assessments we showed this as a decrease in IgE binding. However, roasted peanuts possessed higher IgE binding properties of Ara h 2 in both water-soluble and SDS-sample-buffer-soluble extracts than the peanuts treated by most of the processing methods, which may be due to the Mallard reaction (Beyer et al., 2001, Maleki et al., 2000) that had been reported to enhance IgE binding. If the peanuts had been roasted for longer times, the Ara h 2 bands would mimic what was seen in the peanuts fried for 8 min. Another recent study (Rao et al., 2016), showed that proteins in the roasted peanuts (130 °C, 20 min) were collectively less structured when compared with lower roasting temperatures and boiled peanuts. However, no conclusions had been given about the structure of individual allergens based on that study. Meanwhile in the same study, the antibody-reactivity of high-temperature roasted peanuts (>130 °C) was stronger than others (peanuts roasted at ≤130 °C) (Rao et al., 2016).
Fig. 4-A.
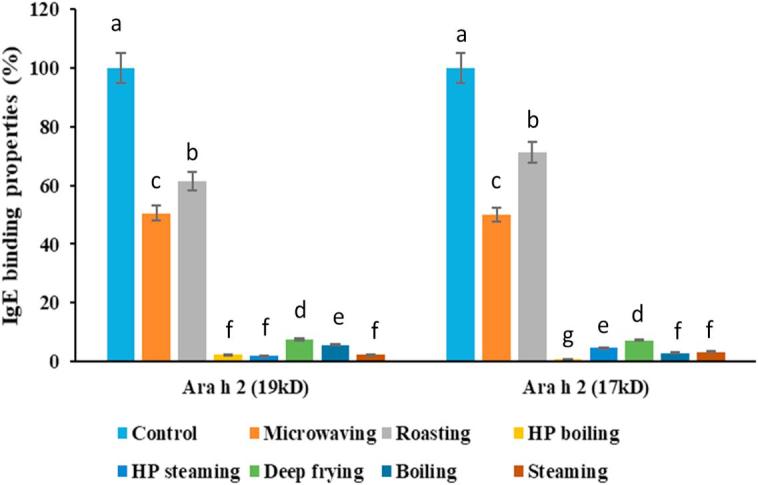
Processing effect on water-soluble allergens (Ara h 2) IgE binding properties. Control represents raw peanuts, all the processing methods’ time were selected with the optimal processing point (Table 1) in this study, respectively. Microwaving: 3 min; Roasting: 12 min; High-pressure boiling: 40 min; High-pressure steaming: 20 min; Deep frying: 6 min; Boiling: 90 min; Steaming: 90 min. The control (raw) peanuts’ total IgE binding properties for each of the Ara h 2 isoforms were set as 100 percent.
Fig. 4-B.
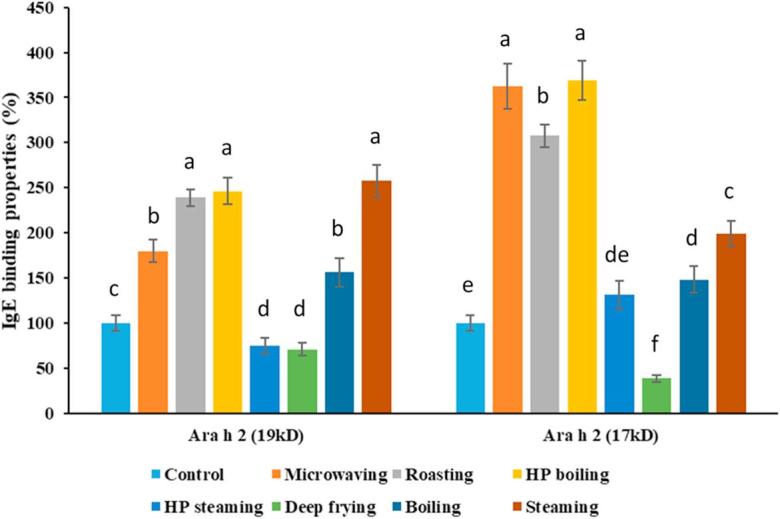
Processing effect on SDS-sample-buffer-soluble allergens (Ara h 2) IgE binding properties. Control represents raw peanuts, all the processing methods’ time were selected with the optimal processing point (Table 1) in this study, respectively. Microwaving: 3 min; Roasting: 12 min; High-pressure boiling: 40 min; High-pressure steaming: 20 min; Deep frying: 6 min; Boiling: 90 min; Steaming: 90 min. The control (raw) peanuts’ total IgE binding properties for each of the Ara h 2 isoforms were set as 100 percent.
HP boiling (Fig. 4-B) resulted in higher IgE binding to the allergens in the SDS-sample buffer soluble fractions than most of the processing methods tested in our study. However, HP processing [at 2.56 atm (37.6 psi) for 30 min] had previously been shown to reduce the IgE-binding capacity significantly (Cabanillas et al., 2012). In our study, the processing conditions were much milder (1.02 atm, 40 min) for producing palatable quality peanuts, in which the allergen structure might not have been altered enough to reduce IgE binding. Similar to this earlier study (Cabanillas et al., 2012) with mild HP processing conditions [1.18 atm (17.3 psi), 30 min], the SDS-sample-buffer-soluble allergen IgE binding capacity was not decreased significantly (P > 0.05). In contrast, HP steaming for 20 min resulted in lower IgE binding properties than HP boiling for 40 min and steaming for 180 min. The reason might be due to the combination of presoaking and high pressure that led to the alterations of the proteins to reduce IgE bindings. The objective of this study was to analyze the peanut allergen changes under various processing conditions that would maintain peanuts in palatable conditions. Peanuts after HP boiling (40 min) and HP steaming (20 min) are very soft and started to be overcooked. Higher processing temperature (pressure) and longer processing time may decrease the water-soluble peanut allergen content and overall binding properties but may damage the food quality of peanuts. Thermal processing could alter the conformational epitopes of allergens, which could enhance, reduce or maintain the allergenic potential (Chung & Reed, 2014). All factors of processing method, temperature, and time can affect the allergen structure and IgE binding capacity. In our study, the IgE-binding property reflected mostly the linear epitopes. Since SDS-sample buffer (reducing reagent) was used for extraction and for the electrophoresis so that structure of the processed protein was converted to the linear form, which would not likely reflect the conformational epitopes IgE-binding properties. In the later study, we need apply different purification method (Nesbit et al., 2012) to obtain purified allergen for conformational epitopes IgE-binding analysis.
Besides peanuts, it also had been reported that many milk allergenic proteins could be structurally changed after thermal processing, and had heat sensitivity in the order of immunoglobulins (Ig) < bovine serum < albumin (BSA) < β-LG and α-LA (Bu, Luo, Chen, Liu, & Zhu, 2013). Caseins are heat stable due to a lack of secondary, tertiary and quaternary structures that can be disrupted by heating, indicating that heating milk can only partly reduce its allergenicity (Verhoeckx et al., 2015). Ehn, Ekstrand, Bengtsson, and Ahlstedt (2004) found that the IgE binding ability of β-LG after heating β-LG solution or milk at 74 °C was only decreased slightly, whereas the IgE binding ability of β-LG was decreased significantly after heated at 90 °C by means of enzyme-linked immunosorbent assay (ELISA) inhibition study. Bu, Luo, Zheng, and Zheng (2009) had evaluated the effects of heat treatment on the antigenicity of α-LA and β-LG in whey protein isolate (WPI) by means of in vitro competitive ELISA inhibition tests. They found that the antigenicity of α-LA and β-LG increased along with temperature increase from 50 to 90 °C. However, antigenicity of both proteins decreased significantly when the heating temperature was above 90 °C. When treated at 120 °C for 20 min, the antigenicity of α-LA decreased by 25% compared with the untreated whey protein isolate sample (Bu et al., 2009). The increase in whey protein antigenicity from 50 to 90 °C was attributed to the exposure of allergenic epitopes buried inside the native molecule resulted from unfolding of conformational structure during heat denaturation (Kleber & Hinrichs, 2007). The decrease of antigenicity at above 90 °C might be due to the destruction or masking of conformational epitopes exposed to the molecule surface by the aggregation of sulfhydryl/disulfide exchanges (Kleber & Hinrichs, 2007). Under more severe thermal processing conditions, the Maillard reaction could lead to the loss of linear epitopes, which resulted in reduced antigenic response (Davis and Williams, 1998, Fritsché, 2003).
In our study, the IgE-binding property majorly represent the linear epitopes. In the study of Nesbit et al. (2012), purified Ara h 1 in solution after thermal processing become denatured and unfolded, and lose significant IgE binding capacity. Compared with the purified protein system, the whole food approach as conducted in our study had low moisture content and there are many other constituents present in the peanuts, and therefore, the conformational changes may not occur exactly as it is in a purified protein-solution system. Therefore, more studies with whole food approach are needed in the future to understand the mechanism of the allergenicity changes in this more complicated yet more practical scenarios after thermal processing.
4. Conclusions
Thermal processing can alter the structure of allergen (protein) which may be reflected by the decreased solubility and changes in the appearance of the protein bands (formation of protein aggregates and smears) on SDS-PAGE. The relationship between thermal processing and major allergen content may be explained by a kinetic model, which would help us to predict and compare the quantity and efficiency of soluble/total extractable allergens. Among all methods with optimal processing point, frying for 6 min was the only process, which greatly reduced both water-soluble and SDS-sample-buffer-soluble Ara h 2 IgE binding properties among the seven processing methods studied, although this observation may be due to the diffusion of the distinct bands from a combination of degradation, modification and oligomerization.
This study may provide valuable information for the peanut processing industry to further improve processing strategies, such as using the combinations of selected methods to reduce the allergenicity of peanut allergens. Further study is needed to analyze the total allergenic properties of the whole peanut, including the residues that is insoluble in the two extract solvents.
Conflict of interest
None.
Acknowledgments
USDA-ARS SCA No. 58-6402-2729 and 58-6066-7081 contributed funding for this project CRIS project no. MIS 501170 and 081710. This work is a contribution of Mississippi Agricultural and Forestry Experiment Station, Mississippi State University. We appreciate Mrs. Chiu-Ie Chang’s contribution in sun-drying whole-in-shell peanuts and Dr. Li Jiang, Yuqing Tan, Yan Zhang, Yin Zhang’s contribution in removing peanut kernels from the shells.
Contributor Information
Shi Meng, Email: sm2336@msstate.edu.
Jiaxu Li, Email: jl305@bch.msstate.edu.
Sam Chang, Email: schang@fsnhp.msstate.edu.
Soheila J. Maleki, Email: Soheila.Maleki@ars.usda.gov.
References
- AOAC International . 19th ed. Association of Official Analytical Chemists; Gaitherburg, MD: 2012. Official methods of analysis of AOAC international. [Google Scholar]
- Beyer K., Morrowa E., Li X.M., Bardina L., Bannon G.A., Burks A.W., Sampson H.A. Effects of cooking methods on peanut allergenicity. Journal of Allergy and Clinical Immunology. 2001;107:1077–1081. doi: 10.1067/mai.2001.115480. [DOI] [PubMed] [Google Scholar]
- Bradford M.M. A rapid and sensitive method for the quantitation of microgram quantities of protein utilizing the principle of protein-dye binding. Analytical Biochemistry. 1976;72:248–254. doi: 10.1016/0003-2697(76)90527-3. [DOI] [PubMed] [Google Scholar]
- Bu G., Luo Y., Chen F., Liu K., Zhu T. Milk processing as a tool to reduce cow’s milk allergenicity: A mini-review. Dairy Science & Technology. 2013;93:211–223. doi: 10.1007/s13594-013-0113-x. [DOI] [PMC free article] [PubMed] [Google Scholar]
- Bu G., Luo Y., Zheng Z., Zheng H. Effect of heat treatment on the antigenicity of bovine α-lactalbumin and β-lactoglobulin in whey protein isolate. Food and Agricultural Immunology. 2009;20:195–206. [Google Scholar]
- Burks W., Sampson H., Bannon G. Peanut allergens. Allergy. 1998;53:725–730. doi: 10.1111/j.1398-9995.1998.tb03967.x. [DOI] [PubMed] [Google Scholar]
- Cabanillas B., Cuadrado C., Rodriguez J., Hart J., Burbano C., Crespo J.F., Novak N. Potential changes in the allergenicity of three forms of peanut after thermal processing. Food Chemistry. 2015;183:18–25. doi: 10.1016/j.foodchem.2015.03.023. [DOI] [PubMed] [Google Scholar]
- Cabanillas B., Maleki S.J., Rodríguez J., Burbano C., Muzquiz M., Jiménez M.A.…Crespo J.F. Heat and pressure treatments effects on peanut allergenicity. Food Chemistry. 2012;132:360–366. doi: 10.1016/j.foodchem.2011.10.093. [DOI] [PubMed] [Google Scholar]
- Chung S.Y., Reed S. Removing peanut allergens by tannic acid. Food Chemistry. 2012;134:1468–1473. doi: 10.1016/j.foodchem.2012.03.057. [DOI] [PubMed] [Google Scholar]
- Chung S.Y., Reed S. Reducing food allergy: Is there promise for food applications? Current Pharmaceutical Design. 2014;20:924–930. doi: 10.2174/13816128113199990043. [DOI] [PubMed] [Google Scholar]
- Comstock S.S., Maleki S.J., Teuber S.S. Boiling and frying peanuts decreases soluble peanut (Arachis hypogaea) allergens Ara h 1 and Ara h 2 but does not generate hypoallergenic peanuts. PLoS One. 2016;11 doi: 10.1371/journal.pone.0157849. [DOI] [PMC free article] [PubMed] [Google Scholar]
- Davis P.J., Williams S.C. Protein modification by thermal processing. Allergy. 1998;53:102–105. doi: 10.1111/j.1398-9995.1998.tb04975.x. [DOI] [PubMed] [Google Scholar]
- Ehn B.M., Ekstrand B., Bengtsson U., Ahlstedt S. Modification of IgE binding during heat processing of the cow's milk allergen β-lactoglobulin. Journal of Agricultural and Food Chemistry. 2004;52:1398–1403. doi: 10.1021/jf0304371. [DOI] [PubMed] [Google Scholar]
- Fritsché R. Role for technology in dairy allergy. Australian Journal of Dairy Technology. 2003;58:89. [Google Scholar]
- Kang I.H., Gallo M., Tillman B.L. Distribution of allergen composition in peanut (Arachis hypogaea L.) and wild progenitor (Arachis) species. Crop Science. 2007;47:997–1003. [Google Scholar]
- Khalil J., Chughtai M. Chemical composition and nutritional quality of five peanut cultivars grown in Pakistan. Plant Foods for Human Nutrition. 1983;33:63–70. [Google Scholar]
- Kleber N., Hinrichs J. Antigenic response of β-lactoglobulin in thermally treated bovine skim milk and sweet whey. Milchwissenschaft. 2007;62:121–124. [Google Scholar]
- Koppelman S.J., Bruijnzeel-Koomen C.A., Hessing M., de Jongh H.H. Heat-induced conformational changes of Ara h 1, a major peanut allergen, do not affect its allergenic properties. Journal of Biological Chemistry. 1999;274:4770–4777. doi: 10.1074/jbc.274.8.4770. [DOI] [PubMed] [Google Scholar]
- Laemmli U.K. Cleavage of structural proteins during the assembly of the head of bacteriophage T4. Nature. 1970;227:680–685. doi: 10.1038/227680a0. [DOI] [PubMed] [Google Scholar]
- Lee N.A., Wright G.C., Rachaputi R.C. DEStech Publications Inc; Lancaser PA: 2016. Peanuts: Bioactives and allergens. (Chapter 7) [Google Scholar]
- Maleki S.J., Chung S.Y., Champagne E.T., Khalifah R.G. Allergic and biophysical properties of peanut proteins before and after roasting. Food Allergy Tolerance. 2001;2:211–221. [Google Scholar]
- Maleki S.J., Chung S.Y., Champagne E.T., Raufman J.P. The effects of roasting on the allergenic properties of peanut proteins. Journal of Allergy and Clinical Immunology. 2000;106:763–768. doi: 10.1067/mai.2000.109620. [DOI] [PubMed] [Google Scholar]
- Maleki S.J., Viquez O., Jacks T., Dodo H., Champagne E.T., Chung S.Y., Landry S.J. The major peanut allergen, Ara h 2, functions as a trypsin inhibitor, and roasting enhances this function. Journal of Allergy and Clinical Immunology. 2003;112:190–195. doi: 10.1067/mai.2003.1551. [DOI] [PubMed] [Google Scholar]
- Meng S., Chang S., Gillen A.M., Zhang Y. Protein and quality analyses of accessions from the USDA soybean germplasm collection for tofu production. Food Chemistry. 2016;213:31–39. doi: 10.1016/j.foodchem.2016.06.046. [DOI] [PubMed] [Google Scholar]
- Mondoulet L., Paty E., Drumare M., Ah-Leung S., Scheinmann P., Willemot R.…Bernard H. Influence of thermal processing on the allergenicity of peanut proteins. Journal of Agricultural and Food Chemistry. 2005;53:4547–4553. doi: 10.1021/jf050091p. [DOI] [PubMed] [Google Scholar]
- Montserrat M., Mayayo C., Sánchez L., Calvo M., Pérez M.D. Study of the thermoresistance of the allergenic Ara h1 protein from peanut (Arachis hypogaea) Journal of Agricultural and Food Chemistry. 2013;61:3335–3340. doi: 10.1021/jf305450s. [DOI] [PubMed] [Google Scholar]
- Mueller G.A., Maleki S.J., Pedersen L.C. The molecular basis of peanut allergy. Current Allergy and Asthma Reports. 2014;14:1–9. doi: 10.1007/s11882-014-0429-5. [DOI] [PMC free article] [PubMed] [Google Scholar]
- Nesbit J.B., Hurlburt B.K., Schein C.H., Cheng H., Wei H., Maleki S.J. Ara h 1 structure is retained after roasting and is important for enhanced binding to IgE. Molecular Nutrition & Food Research. 2012;56:1739–1747. doi: 10.1002/mnfr.201100815. [DOI] [PubMed] [Google Scholar]
- Nwokolo E., Smartt J. 1st ed. Chapman & Hall USA; New York: 1996. Food and feed from legumes and oilseeds. (Chapter 4) [Google Scholar]
- Pansare M., Kamat D. Peanut allergy. Current Opinion in Pediatrics. 2010;22:642–646. doi: 10.1097/MOP.0b013e32833d95cb. [DOI] [PubMed] [Google Scholar]
- Rahaman T., Vasiljevic T., Ramchandran L. Effect of processing on conformational changes of food proteins related to allergenicity. Trends in Food Science & Technology. 2016;49:24–34. [Google Scholar]
- Rao H., Tian Y., Tao S., Tang J., Li X., Xue W.T. Key factors affecting the immunoreactivity of roasted and boiled peanuts: Temperature and water. LWT-Food Science and Technology. 2016;72:492–500. [Google Scholar]
- Sáiz J., Montealegre C., Marina M.L., García-Ruiz C. Peanut allergens: An overview. Critical Reviews in Food Science and Nutrition. 2013;53:722–737. doi: 10.1080/10408398.2011.556758. [DOI] [PubMed] [Google Scholar]
- Schmitt D.A., Nesbit J.B., Hurlburt B.K., Cheng H., Maleki S.J. Processing can alter the properties of peanut extract preparations. Journal of Agricultural and Food Chemistry. 2009;58:1138–1143. doi: 10.1021/jf902694j. [DOI] [PubMed] [Google Scholar]
- Schocker F., Baumert J., Kull S., Petersen A., Becker W.M., Jappe U. Prospective investigation on the transfer of Ara h 2, the most potent peanut allergen, in human breast milk. Pediatric Allergy and Immunology. 2016;27:348–355. doi: 10.1111/pai.12533. [DOI] [PubMed] [Google Scholar]
- Singh H., Cantoria M.J., Malave P., Saputra D., Maleki S. Standardization of RP-HPLC methods for the detection of the major peanut allergens Ara h 1, Ara h 2 and Ara h 3. Food Chemistry. 2016;194:383–390. doi: 10.1016/j.foodchem.2015.08.024. [DOI] [PubMed] [Google Scholar]
- Subcommittee, I. A. N. (2017). Official list of allergens. URL: http://www.allergen.org. Accessed 17.09.15.
- Verhoeckx K.C., Vissers Y.M., Baumert J.L., Faludi R., Feys M., Flanagan S.…van der Bolt N. Food processing and allergenicity. Food and Chemical Toxicology. 2015;80:223–240. doi: 10.1016/j.fct.2015.03.005. [DOI] [PubMed] [Google Scholar]
- Zhang Y., Chang S.K., Liu Z. Isoflavone profile in soymilk as affected by soybean variety, grinding, and heat-processing methods. Journal of Food Science. 2015;80:983–988. doi: 10.1111/1750-3841.12839. [DOI] [PubMed] [Google Scholar]