

Abstract
Gene duplication and fusion events in protein evolution are postulated to be responsible for the common protein folds exhibiting internal rotational symmetry. Such evolutionary processes can also potentially yield regions of repetitive primary structure. Repetitive primary structure offers the potential for alternative definitions of critical regions, such as the folding nucleus (FN). In principle, more than one instance of the FN potentially enables an alternative folding pathway in the face of a subsequent deleterious mutation. We describe the targeted mutation of the carboxyl‐terminal region of the (internally located) FN of the de novo designed purely‐symmetric β‐trefoil protein Symfoil‐4P. This mutation involves wholesale replacement of a repeating trefoil‐fold motif with a “blade” motif from a β‐propeller protein, and postulated to trap that region of the Symfoil‐4P FN in a nonproductive folding intermediate. The resulting protein (termed “Bladefoil”) is shown to be cooperatively folding, but as a trimeric oligomer. The results illustrate how symmetric protein architectures have potentially diverse folding alternatives available to them, including oligomerization, when preferred pathways are perturbed.
Keywords: domain‐swapping, folding pathway, protein evolution, protein symmetry
1. INTRODUCTION
Idealized β‐trefoil architecture is defined by threefold rotational symmetry of a ~42‐mer “trefoil‐fold” polypeptide motif.1, 2, 3, 4, 5 This motif comprises four β‐strands; thus, the β‐trefoil comprises a total of 12 β‐strands interspersed with 11 surface turns. The N‐ and C‐termini are positioned adjacent to each other and by the threefold rotational symmetry describe a discontinuous surface turn. A complete set of circular permutations at surface turn positions would therefore involve 11 unique mutations; however, in the case of exact primary structure symmetry, circular permutations occurring at equivalent symmetry positions are indistinguishable, and a complete set of circular permutations at surface turn positions is therefore defined with only three different constructs 6 (Figure S1).
A previous report examining the effects of circular permutations at all surface turn positions upon the folding and unfolding kinetics of a purely‐symmetric de novo designed β‐trefoil protein (the “Symfoil‐4T” protein) showed that the folding rate was essentially unchanged while the unfolding rate was perturbed for all circular permutations. 6 These results led to the hypothesis that a structurally equivalent folding transition state (i.e., FN)7, 8, 9 was being realized in each of the circular permutations (i.e., alternative definitions of an identical FN sequence were possible due to the exact triplet repeat of primary structure). Subsequent φ‐value analysis7, 10 to identify the location of the FN in both the de novo designed symmetric Symfoil‐4T protein 11 and the related but naturally‐evolved FGF‐1 protein 12 showed that the FN of both proteins spanned internal contiguous regions comprising approximately seven β‐strands; however, their locations differed: the FN in FGF‐1 spanned β‐strands 2–8, while the FN in Symfoil‐4T spanned β‐strands 4–10. This result indicated the potential for different regions within the β‐trefoil to assume the role of the FN. In hindsight, the particular location of the FN of Symfoil‐4T, combined with an exact primary structure symmetry, renders its FN impervious to any disruption by circular permutation (Figure S1).
Fragmentation studies of the Symfoil‐4P protein (a slightly stabilized variant of Symfoil‐4T) demonstrated that the isolated 42‐mer trefoil‐fold repeating motif (termed the “Monofoil” polypeptide, and comprising four β‐strands) can function as an effective FN.3, 13 In this case, however, the expressed Monofoil polypeptide oligomerizes as a trimer to reconstitute an intact β‐trefoil protein architecture. Subsequent circular permutation studies showed that the Monofoil polypeptide is absolutely intolerant to circular permutation, yielding only soluble, collapsed molten globule monomers. 14
In theoretical structural isolation the trefoil‐fold motif exposes considerable hydrophobic surface area. 14 Ab initio structure prediction for the Monofoil primary structure does not predict a trefoil‐fold motif; surprisingly, it predicts a “blade” structural motif from a β‐propeller architecture 14 (Figure 1). The β‐propeller is a distinct protein architecture having four to eight repeating blade motifs in rotational symmetry5, 15, 16, 17, 18; however, the trefoil‐fold and blade motifs share a number of features in common: both are ~42‐mers, both are comprised of four antiparallel β‐strands, and both utilize domain‐swapped arrangements in N‐ and C‐termini closure interactions. Although comprising an essentially identical length, the blade motif is a more structurally‐compact arrangement of β‐strands compared to the trefoil‐fold. In the folding pathway of the Monofoil polypeptide it was therefore postulated that early folding intermediates most likely sample a blade‐type conformation (limiting exposure of hydrophobic core residues and maintaining solubility) which subsequently rearranges the last β‐strand to promote an intermolecular domain‐swapped arrangement yielding an intact β‐trefoil architecture via oligomerization as a trimer. 14
FIGURE 1.

The trefoil‐fold motif within the Symfoil β‐trefoil protein and the site of the “blade” motif substitution. (a) Ribbon diagram of the Symfoil‐4P protein (RCSB accession 3O4D). The green shading identifies the repeating 42‐mer “trefoil‐fold” motif (residue positions 11–52 in Figure 2). (b) Rotation around the vertical threefold axis of symmetry. The green shading identifies a circularly‐permuted definition of the repeating trefoil‐fold motif (residue positions 85–123 in Figure 2). (c) The ab initio predicted structure (green shading) of residues 85–123 highlighted in (b) overlaid onto a “blade” motif (residues 215–248; blue shading) of the β‐propeller protein methylamine dehydrogenase (RCSB accession 1MDA). See Figure 2 for primary sequence alignment
Both the Monofoil polypeptide and the Symfoil protein (i.e., a trimeric covalent concatenation of the Monofoil sequence) are foldable and yield β‐trefoil proteins. Thus, both polypeptides contain an effective FN region; however, despite the primary structure relatedness, these two FN differ in both length and position. This indicates a metamorphic potential of the FN within the symmetric Symfoil protein. Such potential, however, cannot be probed by circular permutation (for reasons given previously), and must therefore be evaluated by directed internal mutation. In the present study, we probe the metamorphic potential of the FN of the symmetric Symfoil‐4P β‐trefoil protein by swapping a portion of its internal FN with a blade motif sequence from a β‐propeller protein (Figure 2). The swapped blade motif, comprising four β‐strands, substitutes the C‐terminal three β‐strands of the internal Symfoil‐4P FN region (as well as one β‐strand outside the FN region). This sequence should promote a blade structure within this region of the FN that disfavors folding into a trefoil‐fold conformation, effectively preventing this region from normal participation in the FN for a β‐trefoil. A resultant ability fold would indicate utilization of an alternative FN definition outside this C‐terminal region of the preferred FN. The results show that the mutant β‐trefoil protein (termed “Bladefoil” [BF]) exhibits cooperative folding behavior involving trimeric oligomerization. Due to the targeted perturbation, BF appears to be utilizing an alternative FN combined with symmetric intermolecular complementarity driving oligomerization. The results support the hypothesis that symmetric protein structure enables a diverse metamorphic potential for the FN, including an oligomeric solution to provide for foldability.
FIGURE 2.
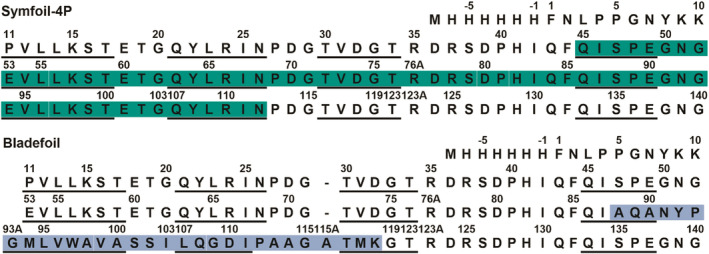
Primary structure of Symfoil‐4P and BF proteins. Upper panel: the primary structure of Symfoil‐4P with β‐strand secondary structure underlined3, 13 and the folding nucleus region shaded in green. 11 Lower panel: the primary structure of the designed BF protein. The blue shaded region indicates the internal substitution of residue positions 217–246 of the β‐propeller protein methylamine dehydrogenase (RCSB accession 1MDA). This region corresponds to an integral “blade” motif of this seven‐stranded β‐propeller architecture. Underlined regions indicate the β‐strand secondary structure from the 1MDA structure. This substitution should disrupt the C‐terminus region of the Symfoil‐4P folding nucleus (i.e., four of the seven β‐strands in the FN). Alternative forms of the folding nucleus may be possible due to the primary structure symmetry
2. RESULTS
2.1. Protein expression
The BF protein produced excellent yields (~40 mg/L) of soluble protein. The subsequent BF3x and BF4x constructs also produced similar yields of soluble protein. The two‐step purification scheme yielded purity of >95% in each case as judged by densitometry analysis of Coomassie stained sodium dodecylsulfate polyacrylamide gel electrophoresis (SDS PAGE). Buffer exchange into pH 11.0–3.0 buffers was accomplished with no evidence of any pH‐induced aggregation.
2.2. Analytical size exclusion chromatography
Under neutral pH conditions the size exclusion chromatography (SEC) analysis of the BF protein yielded an apparent mass of 56.4 kDa (Figure 3). Under identical buffer conditions with the addition of 6 M GuHCl the apparent mass increased to 98.0 kDa (representing the fully‐unfolded state). With the addition of 20% saturated (NH4)2SO4 (a “salting out” ion pair from the Hofmeister series) the apparent mass under neutral pH conditions decreased to 36.2 kDa. Under acidic conditions (pH 3.0; and in the absence of (NH4)2SO4) the apparent mass decreased further to 31.2 kDa. The Symfoil‐4P control protein under neutral pH conditions eluted with an apparent mass of 22.4 KDa, and under acidic (pH 3.0) conditions eluted with an apparent mass of 20.2 kDa. Analytical SEC of the BF3x and BF4x proteins was performed under acidic (pH 3.0) conditions. Under these conditions the BF and BF3x proteins eluted with essentially identical apparent masses of 31.2 and 31.0 kDa, respectively; in contrast, the BF4x protein eluted with an apparent mass of 106 kDa.
FIGURE 3.

Analytical SEC of BF proteins. Upper panel: The BF protein was resolved with analytical SEC on Superdex 200 under both neutral and acidic pH conditions. The effects of salting‐in ((NH4)2SO4) and salting‐out (i.e., denaturing) (GuHCl) Hoffmeister salts at neutral pH were also evaluated. SEC analysis of the Symfoil‐4P control protein under neutral and acidic conditions is also included. The resolution of protein standards used for mass calibration (light gray) are also shown (see Section 4 for protein composition). Lower panel: BF3x and BF4x proteins were analyzed by analytical SEC under acidic (pH 3.0) conditions. Also included are the BF and Symfoil‐4P control proteins. Mass standards (light gray) are also indicated. BF, Bladefoil; SEC, size exclusion chromatography
2.3. Analytical ultracentrifugation
Analysis of analytical ultracentrifugation (AUC) data using the van Holde–Weischet method19, 20 yields a G(s) distribution that compares the sedimentation coefficients of BF and Symfoil‐4P, showing each to have markedly distinct boundaries corresponding to a mass ratio of 3:1, respectively, under acidic conditions (Figure 4). Symfoil‐4P is a known monomer with a calculated molecular weight of 15.8 kDa3, 13 and the resolved distribution of Symfoil‐4P at pH 3.0 is homogenous (with some repulsive attraction at the upper boundary). The G(s) plot of BF shows values that converge to an average sedimentation coefficient value relative to Symfoil‐4P of 3.0 and the G(s) distribution shows some evidence of attractive nonideality not uncommon for homo oligomeric complexes. 20 BF yielded nearly identical distributions across the evaluated concentration range of 26.9–68.8 μM. Plotting the frictional ratio of all measured BF samples and their sedimentation coefficient values at S20,w shows a major (~80%) distribution of f/f 0 values at ~1.2, with a minor (~20%) distribution at ~3.8 (Figure S3). A value of f/f0 ~ 1 indicates a spherical shape, whereas larger values denote an increasing ellipsoid shape.
FIGURE 4.

Analysis of AUC data of Symfoil‐4P and BF proteins at pH 3.0. The G(s) distributions of BF and Symfoil‐4P proteins from the van Holde–Weischet analysis are shown. Both Symfoil‐4P and BF proteins appear homogeneous, and BF exhibits a sedimentation coefficient that is a 3x stoichiometric ratio of Symfoil‐4P. AUC, analytical ultracentrifugation; BF, Bladefoil
2.4. Isothermal equilibrium denaturation
The isothermal equilibrium denaturation (IED) data demonstrate a distinct pH‐dependent profile for BF denaturation. At pH 11.0 the fluorescence signal for 0 M versus 5.5 M GuHCl is indistinguishable, indicating that the protein is essentially unfolded (Figure 5). At pH 9.0 there is also minimal differential fluorescence signal between 0 M versus 5.5 M GuHCl, although there is some evidence of a different environment of the Phe fluorophores at 0 M GuHCl. At neutral pH a folding cooperativity becomes evident, although a clear pretransition (i.e., native state baseline) is not yet apparent. Folding cooperativity increases further at pH 5.0, and at pH 3.0 a highly‐cooperative structural transition with a discernable pretransition baseline is observed. The IED of the BF3x and BF4x proteins at pH 3.0 exhibit highly‐cooperative unfolding transitions, with pretransition and post‐transition spectroscopic signal closely matching those exhibited by the BF protein at the same pH. The Symfoil‐4P reference protein is able to fold cooperatively at pH 3.0; however, the Monofoil and Difoil polypeptides are only partially folded at this pH.
FIGURE 5.

Isothermal equilibrium denaturation of BF and Symfoil proteins. (a) The effect of pH 11.0–3.0 upon IED of BF protein by GuHCl and monitored by fluorescence (all samples analyzed at 4.37 μM, or 0.070 mg/ml). (b) Effect of gene duplication (3x or 4x) of the BF sequence upon the IED data at pH 3.0. The BF, BF3x and BF4x proteins were analyzed at 4.37 μM, 1.46 μM and 1.09 μM, respectively (i.e., maintaining a constant mass concentration of 0.070 mg/ml). (c) IED of Symfoil‐4P, Difoil and Monofoil proteins at 0.070 mg/ml and analyzed at pH 7.0 and pH 3.0. IED, isothermal equilibrium denaturation
In monomer models the denaturant concentration where ΔG U = 0 and X U = 0.5 are coincident; thus, they are intrinsic parameters (i.e., monomer models do not include a parameter for protein concentration). However, in the case of oligomeric models the denaturant concentration where X U = 0.5 varies with monomer concentration (with increasing concentration driving oligomeric assembly), while the ΔG U versus denaturant function (defined by parameters ΔG U = 0 and m‐value) is an intrinsic function. The fitted ΔG U versus denaturant functions for the BF proteins are provided in Table 1 and plotted in Figure 6. These data show that the denaturant concentration where ΔG U = 0 for BF (as a trimer) and BF3x (as a monomer) are remarkably similar (2.92 vs. 2.74 M GuHCl, respectively) with BF3x exhibiting approximately 3x the (molar) m‐value and ΔG 0 values of BF. Furthermore, the ΔG 0 value for the BF4x protein (124 kJ mol−1) is approximately equal to the sum of the ΔG 0 values of the BF3x protein (28.7 kJ mol−1) and BF protein (88.9 kJ mol−1).
TABLE 1.
IED data analysis of BF proteins (0.1 M citrate pH 3.0, 298 K)
| Protein | IED model | Co (μM) a | ΔG 0 (kJ mol−1) | m‐Value (kJ mol−1 M−1) | [GuHCl]ΔG = 0 (M) |
|---|---|---|---|---|---|
| BF | Trimer | 4.38 | 88.9 ± 4.2 | 30.7 ± 1.5 | 2.92 |
| BF3x | Monomer | 1.60 | 28.7 ± 2.9 | 12.6 ± 1.3 | 2.74 |
| BF4x | Trimer | 1.21 | 124 ± 5.0 | 24.2 ± 1.4 | 5.11 |
| Symfoil‐4P | Monomer | 4.39 | 27.3 ± 3.1 | 14.4 ± 1.3 | 1.90 |
| Symofil‐4P (pH 7.0) b | Monomer | 60.1 | 16.8 | 3.58 |
Abbreviations: BF, Bladefoil; IED, isothermal equilibrium denaturation.
Molar concentration of monomer.
3.
FIGURE 6.

IED ΔG U versus [GuHCl] for BF proteins at pH 3.0. The BF proteins and IED models utilized in data analysis are indicated. Also shown are the [GuHCl] at the respective ΔG = 0 values. The Symfoil‐4P protein is also included for reference. BF, Bladefoil; IED, isothermal equilibrium denaturation
2.5. Differential scanning calorimetry
The differential scanning calorimetry (DSC) endotherm for the BF protein at pH 3.0 exhibits a temperature‐induced phase transition of heat capacity that is characteristic of a cooperatively folded protein (Figure 7). Notably, there is an increase in heat capacity of the post‐transition (i.e., unfolded) baseline, indicating a positive value of ΔCp (attributable to exposure of a hydrophobic core during unfolding 21 ). Additionally, no protein aggregation in response to thermal unfolding was observed. A fit to a two‐state trimer model provides the thermodynamic parameters in Table 2, indicating substantial enthalpy of unfolding (ΔH Tm) and positive ΔCp. The derived ΔG U(T) function at 298 K (the temperature where IED was performed) yields a value of 97.7 ± 5.8 kJ mol−1 and this compares favorably with the value of 88.9 ± 4.2 from IED analysis (i.e., a two‐state trimer model).
FIGURE 7.

DSC endotherm of BF in 0.1 M citrate pH 3.0. Heat capacity is indicated by tick marks in increments of 10 kJ mol−1 K−1. The experimental data (black) is overlaid with a fit to a trimer dissociation model (see Section 4). Fitted thermodynamic values are given in Table 2. DSC, differential scanning calorimetry
TABLE 2.
DSC data analysis of BF protein (120 μM a , 0.1 M citrate pH 3.0)
| T m b (K) | T XU = 0.5 (K) | ΔH Tm (kJ mol−1) | ΔG 298K (kJ mol−1) | ΔCp Tm (kJ mol−1 K−1) |
|---|---|---|---|---|
| 363 ± 3.5 | 327 ± 1.2 | 680 ± 53.9 | 97.7 ± 5.8 | 16.4 ± 0.9 |
Abbreviations: BF, Bladefoil; DSC, differential scanning calorimetry.
Molar concentration of monomer.
T ΔG = 0.
3. DISCUSSION
The goal of this study was to probe the folding potential of a purely‐symmetric β‐trefoil protein (Symfoil‐4P) upon targeted disruption of a portion of the preferred FN region. All possible circular permutations at surface turn positions was previously shown to yield a foldable (although destabilized) monomeric protein. 6 Due to the exact threefold primary structure symmetry present in the Symfoil‐4P protein it was hypothesized that an alternate definition of the FN might be available despite circular permutation. However, subsequent φ‐value studies showed that the FN location would render it impervious to any circular permutation 11 ; thus, targeted internal mutation is required to probe the effects upon folding induced by FN perturbation. Targeted disruption of the carboxyl‐terminus region of the Symfoil‐4P FN utilized substitution of a blade motif from the β‐propeller protein methylamine dehydrogenase (RCSB accession 1MDA) creating the BF protein. The choice of a blade motif was based upon prior ab initio folding studies, 14 which indicated that a blade motif is a likely early structural intermediate in the Symfoil‐4P folding pathway which subsequently resolves into a trefoil‐fold conformation; thus, blade substitution should trap the carboxyl‐terminal region of the Symfoil‐4P FN in an essentially nonproductive folding intermediate.
The SEC and IED data are in agreement in showing that the BF protein exhibits a general compaction of apparent mass, with an associated increase in folding cooperativity, upon increasingly acidic buffer conditions (or at neutral pH with the addition of ammonium sulfate—a “salting‐in” Hoffmeister salt). At pH 3.0 the IED and DSC data for the BF protein show a cooperative folding transition, and SEC indicates an apparent mass of 31.2 kDa. This mass is, however, significantly greater than the 22.0 kDa mass exhibited by the monomeric Symfoil‐4P protein. Thus, while the BF protein shows evidence of cooperative folding under acidic conditions, the above discrepancy in mass raises the possibility of the BF protein adopting an oligomeric assembly. The AUC data show that Symfoil‐4P and BF exhibit a high degree of homogeneity, and that the BF protein is most consistent with a trimeric assembly (in agreement with the SEC data). BF yielded nearly identical distributions across the evaluated concentration range of 26.9–68.8 μM indicating a potential dissociation constant significantly lower than the concentrations evaluated. Although the majority component (~80%) of AUC determined f/f 0 values for BF are ~1.2 (indicating essentially spherical shape) a minor (~20%) distribution of f/f 0 values in the range of ~3.8 indicates potential for structural flexibility or a molten globule state. 22 The AUC data therefore indicate that the majority of the BF protein adopts a compact trimeric oligomer but may experience a certain degree of flexibility or minor equilibrium with a molten‐globule type conformation under the conditions evaluated. Our group has reported on over 250 mutants of FGF‐1 and de novo designed symmetric beta‐trefoil proteins based upon FGF‐1. These mutations have included a variety of point and combination mutations, deletions, and insertions; however, none of these mutations was observed to oligomerize. The oligomerization of the BF protein is therefore a rather unique response involving the targeted mutation of the folding nucleus.
Prior fragmentation studies of the Symfoil‐4P protein, including N‐terminal 42‐mer and 84‐mer definitions of the repeating trefoil‐fold motif (Monofoil and Difoil polypeptides, respectively), yielded trimeric oligomers in both cases3, 13 under neutral pH conditions. Additionally, X‐ray crystallography showed that both of these oligomeric assemblies exhibit a characteristic juxtaposition of the C‐ and N‐termini of the monomer subunits, such that duplication and (C–N termini) fusion of these sequences could readily be accommodated with minimal structural perturbation. The BF3x protein was therefore constructed to test the trimer assembly interpretation of the SEC and AUC data; furthermore, the BF4x protein was constructed as an additional design of interest.
The SEC data show that the BF and BF3x proteins exhibit essentially indistinguishable apparent masses (~31 kDa), supporting the hypothesis of trimer oligomeric assembly for the BF protein (and with a structurally‐equivalent monomer for BF3x). We note that this apparent mass is only ~1.5x the mass of the Symfoil‐4P control protein. Thus, by SEC the BF trimer is notably compact, or alternatively, the BF protein has some minor affinity for the SEC resin which retards its elution. Although lectin activity (i.e., polysaccharide affinity), which might retard elution on the SEC matrix, has been reported for a number of β‐propeller proteins, it has not been reported for methylamine dehydrogenase (the source of the blade sequence). The IED data show that the BF trimer assembly and BF3x monomer exhibit essentially indistinguishable denaturation concentrations where ΔG U = 0, while the folding cooperativity of the BF3x protein is ~3x that of BF (Table 1). The BF4x apparent mass on SEC is 106 kDa, which is ~3x the apparent mass of the BF (trimer) and BF3x (monomer) proteins. The folding cooperativity of the BF4x protein is similar in magnitude to the BF3x protein, while the denaturant concentration where ΔG U = 0 is the approximate sum of the BF and BF3x proteins. We therefore interpret the IED and SEC data to indicate that the BF4x protein is assembling as a trimeric oligomer (essentially behaving as a BF3x monomer with an additional BF subdomain that drives trimeric assembly of the BF4x polypeptide). A proposed general model of oligomerization of the set of BF proteins, consistent with all data, is given in Figure 8.
FIGURE 8.

Monomer and oligomeric assemblies for BF proteins. (a) The trimeric assembly of the 42‐mer Symfoil‐4P trefoil‐fold motif (“Monofoil”).3, 13 Solid lines indicate intermolecular interfaces between oligomeric subunits. (b) Representation of the Symfoil‐4P protein (a triplet repeat of the Monofoil 42‐mer sequence). Symfoil‐4P folds as a monomer, forming an overall β‐trefoil architecture comprised of three repeating trefoil‐fold structural motifs. The dashed lines represent intramolecular interfaces between repeating motifs. (c) Trimer assembly of the BF protein consistent with SEC and IED data. The blade motif insertion (gray) disrupts a major portion of the interior FN region; however, sequence symmetry provides a potential alternative FN definition similar to the integral Monofoil sequence (and able to generate in integral b‐trefoil architecture via trimerization). (d) Representation of the BF3x construct and its monomeric assembly that shares properties with the BF trimer assembly. (e) Representation of the BF4x construct. The initial three repeats fold as a monomer like BF3x, and the last repeat provides for trimeric assembly as with BF (consistent with SEC and IED data). The green and blue shading represent instances of the BF4x protein in the hypothesized trimeric assembly. BF, Bladefoil; FN, folding nucleus; IED, isothermal equilibrium denaturation; SEC, size exclusion chromatography
The isolated 42‐mer Monofoil polypeptide spontaneously oligomerizes as a stable trimer at neutral pH (forming an intact β‐trefoil protein).3, 13 The 84‐mer tandem repeat of Monofoil (i.e., Difoil polypeptide) also spontaneously oligomerizes as a trimer at neutral pH (forming two intact β‐trefoil proteins via a unique domain‐swapped arrangement). In the construction of the BF protein the blade motif insertion occurs at residue position 88; therefore, it might be postulated that the BF trimeric assembly is simply oligomerization of the unperturbed N‐terminal Monofoil (42‐mer) or Difoil (84‐mer) sequence motifs. However, BF is stabilized at acidic pH, but is partially unstructured at neutral pH, while Symfoil‐4P, Monofoil and Difoil are structured at neutral pH, but are destabilized by acidic pH (with Monofoil and Difoil being only partially folded at acidic pH; Figure 5). Thus, the oligomerization of BF is not characteristic of either the Monofoil or Difoil trimeric oligomerization (exhibiting an inverse pH behavior), and therefore appears to be structurally unique.
Extensive efforts at crystallization of the BF, BF3x, and BF4x proteins have not succeeded in yielding diffraction quality crystals; evidence of a potential flexibility of BF (noted in the AUC data) may contribute to difficulty in crystallization. While a detailed structural understanding of the BF trimer, the BF3x monomer, and BF4x trimer remains to be elucidated, it is apparent that the protein has managed to salvage foldability in the face of a disruption of the C‐terminal portion of its internal FN region via trimeric oligomerization; furthermore, this oligomerization involves juxtaposition of monomer subunit N‐ and C‐termini. The results identify oligomerization as an alternative solution to foldability. Such oligomerization is parsimoniously hypothesized to comprise a set of (symmetric) intermolecular interactions that are normally intramolecular in the monomeric Symfoil‐4P structure (Figure 8). This identifies a possible selective advantage of symmetric protein architectures generated by gene duplication and fusion; namely, a diverse potential for finding alternative folding pathways in response to deleterious mutation. The FN responsible for the folding of BF appears distinct from that normally utilized in Syfmoil‐4P, and also appears distinct from N‐terminal instances of the repeating trefoil‐fold motif (i.e., Monofoil and Difoil regions). Finally, it is possible that a novel FN, stable under acidic conditions, utilizes part, or all, of the substituted blade domain. Future work involving detailed φ‐value analysis may elucidate this intriguing possibility.
4. MATERIALS AND METHODS
4.1. Mutant design, protein expression, and purification
The BF polypeptides utilized in this study were based upon the de novo designed Symfoil‐4P β‐trefoil protein (RCSB accession 3O4D).3, 13 Symfoil‐4P contains an exact triplet repeat of a designed 42‐mer sequence (Figure 2) and folds with a β‐trefoil architecture having a characteristic internal threefold rotational symmetry. The Symfoil‐4P protein was derived from fibroblast growth factor‐1 (FGF‐1) and maintains the FGF‐1 numbering scheme; additionally, Symfoil‐4P was expressed with an N‐terminal 6xHis‐tag and 10 amino acid unstructured FGF‐1 leader sequence. The folding nucleus (FN) region of Symfoil‐4P has been identified by φ‐value analysis as comprising residues 45–112, a region spanning approximately seven contiguous internal β‐strands. 11
Residue positions 88–118 (28 amino acids total) of Symfoil‐4P were substituted by residue positions 217–246 (30 amino acids total) of the β‐propeller protein methylamine dehydrogenase (RCSB accession 1MDA). 1MDA is a seven‐bladed β‐propeller protein architecture and residue positions 217–246 comprise one integral blade (blade #5). Ab initio folding studies of permutants of the Monofoil sequence predicted blade motifs for permutants P1 (β2‐β3‐β4‐β1) and P3 (β4‐β1‐β2‐β3), with the greatest homology for permutant P3. 14 Two locations in Symfoil‐4P lend themselves to the equivalent of a contiguous β4‐β1‐β2‐β3 primary structure substitution: one at β4 and the other at β8 (Figure 2). Blade motif substitution at β4 would replace four of seven β‐strands (i.e., the majority) of the Symfoil‐4P FN (beginning at the FN N‐terminus), while substitution at β8 would replace three β‐strands at the C‐terminus of the FN (with the last β‐strand substitution outside the C‐terminus of the FN). The latter choice was selected in order to preserve the majority of the Symfoil‐4P FN region. This version of Symfoil‐4P with the substituted 1MDA blade region is referred to as BF. Both a trimeric and tetrameric covalently concatenated repeat of the BF primary structure were constructed (also containing the N‐terminal 6xHis‐tag and 10 amino acid FGF‐1 leader sequence) and are referred to as BF3x and BF4x, respectively.
Heterologous expression from Escherichia coli and purification of recombinant BF proteins followed previously published procedures23, 24 utilizing nickel nitrilotriacetic acid (Ni‐NTA) affinity chromatography with imidazole step elution, followed by Superdex 75 size‐exclusion chromatography (GE Healthcare, Piscataway NJ). Purified protein was initially exchanged into 50 mM sodium phosphate, 0.1 M NaCl, 10 mM (NH4)2SO4, pH 7.5 (“Pi buffer”). An extinction coefficient of E 280 nm (0.1%, 1 cm) = 0.701 was used to determine protein concentration based upon the method of Gill and von Hippel. 25
4.2. Analytical SEC
Analytical SEC was performed using a Superdex 200 26/60 (26 cm × 60 cm) column (318 ml volume) controlled by an ÄKTAFPLC system (GE Healthcare Life Sciences, Chicago, IL). Sample volumes of 10 ml (~3% column volume) were loaded using a 10 ml Superloop. Protein samples for analysis were adjusted to ~50 mAU and elution profiles were monitored by absorbance at 280 nm. A mass standard including immunoglobulin G (IgG; 153 kDa), bovine serum albumin (BSA, 66.2 kDa), ovalbumin (OVB, 45.0 kDa), carbonic anhydrase (CAN, 31.0 kDa) and hen egg white lysozyme (HEW, 14.3 kDa) in Pi buffer was used for column calibration. A standard curve was determined by second‐order polynomial fit to the elution volume versus log of the mass standards (Figure S2). The apparent mass of experimental proteins based on elution volume was calculated using this standard curve.
4.3. Analytical ultracentrifugation
Sedimentation velocity experiments were performed in a Beckman XL‐I centrifuge (Beckman Coulter, Inc., Fullerton CA) using absorbance optics and measuring intensity scans at 280 nm. AUC experiments were performed at 20°C in two‐channel Epon centerpieces with an AN60 Ti rotor at 58,000 rpm. Symfoil‐4P was analyzed at a concentration of 1.56 mg/ml (A280 = 0.5; 98.7 μM) and BF was at analyzed over a range of concentrations including 0.43, 0.57, 0.71, 0.85, and 1.1 mg/ml (A 280 = 0.30, 0.40, 0.50, 0.60, and 0.80, respectively; 26.9, 35.6, 44.4, 53.1, and 68.8 μM, respectively). All samples were equilibrated in 0.1 M citrate pH = 3.0 and loaded at a volume of 440 μl. Data were analyzed using the UltraScan III version 4.0 software suite. 26 All data sets were submitted for analysis to the Lonestar5 cluster at the University of Texas Health Science Center at San Antonio and the Texas Advanced Computing Center at the University of Texas in Austin. Data were first analyzed by two‐dimensional spectrum analysis with simultaneous removal of time‐invariant noise, and then by genetic algorithm refinement, followed by Monte Carlo analysis. Van Holde–Weischet analysis was also performed using the Ultra Scan III software suite.
4.4. Isothermal equilibrium denaturation
BF protein was adjusted to 4.37 μM (0.07 mg/ml) for all IED pH studies. Buffer components for different pH analyses included 100 mM N‐cyclohexyl‐3‐aminopropanesulfonic acid (CAPS; pH 11.0), 3‐(Cyclohexylamino)‐2‐hydroxy‐1‐propanesulfonic acid (CAPSO; pH 9.0), 4‐(2‐hydroxyethyl)‐1‐piperazineethanesulfonic acid (HEPES; pH 7.0), and citrate (pH 5.0 and pH 3.0). IED utilized increments of 0.5 M GuHCl denaturant and samples were incubated for 18 hr at 298 K to permit equilibration. BF3x and BF4x proteins were adjusted to 1.60 and 1.21 μM, respectively, for IED studies (i.e., maintaining a constant mass concentration of 0.07 mg/ml as with the BF pH studies) and were analyzed in 100 mM citrate buffer pH 3.0. The extent of unfolding in IED studies was monitored by fluorescence spectroscopy (principally contributed by the Phe residues at positions 44, 85, and 132 in the BF proteins (and symmetrically‐equivalent positions; Figure 2). Fluorescence data were collected on a Cary Eclipse fluorescence spectrophotometer (Varian Inc., Palo Alto, CA) equipped with a Pelletier controlled temperature regulator at 298 K and using a 1.0 cm path length quartz cuvette. An excitation wavelength (λ ex) of 280 nm was used, and the fluorescence emission (λ em) was measured at 303 nm (i.e., the wavelength of maximum Δ amplitude between buffer and protein signal) with buffer subtracted and triplicate scans averaged. This fluorescence signal was plotted versus denaturant concentration. Analysis of monomer two‐state unfolding utilized a simple six‐parameter model 27 :
| (1) |
where [D] is the denaturant concentration, F 0N and F 0D are the 0 M denaturant intercepts for the native and denatured state baselines, respectively, and S N and S D are the slopes of the native and denatured state baselines, respectively. ΔG 0 and m (i.e., “m‐value”) describe a linear function for the unfolding free energy versus denaturant concentration. ΔG U[D] is calculated from K U[D] (ΔG U = −R * T * ln[K U]) and K U is defined as K U = X U/(1 − X U). The denaturant concentration [D] where ΔG U = 0 and mole fraction of unfolded protein X U = 0.5 are coincident (K U = X U/(1 − X U) = 0.5/0.5 = 1.0) in a monomer model.
For a simple two‐state trimer oligomeric model:
| (2) |
| (3) |
where Co is the molar protein concentration in terms of total monomer (see Backmann et al. 28 for a detailed derivation). With oligomeric models the inclusion of the protein concentration term means that KU will not necessarily equal 1.0 when X U = 0.5 (although there is a unique protein concentration where this will occur, it is impractically large). The Cm value (i.e., denaturant concentration where the protein is half‐unfolded) for monomeric and oligomeric models in IED is defined as the denaturant concentration where X U = 0.5 (and not where ΔG U = 0, unless the special case of monomer). This definition for IED of oligomers avoids quoting theoretical values of denaturant where ΔG U = 0 that can be higher than the practical saturation limit of such denaturants. Nonlinear least squares fitting of IED data was performed using the DataFit software package (Oakdale Engineering, Oakdale, PA).
4.5. Differential scanning calorimetry
DSC analysis was performed on a TA Instruments Nano‐Differential Scanning Calorimeter (New Castle, DE) pressurized to 40 psi with nitrogen gas. BF protein was concentrated to 120 μM in 0.1 M citrate pH 3.0 and dialyzed overnight versus this buffer. The dialysate buffer was used in the reference cell and for buffer/buffer baselines. DSC endotherms were collected from 290 to 370 K at a scan rate of 0.25 K min−1. Duplicate scans were collected and averaged, buffer/buffer scans were subtracted from protein scans, and the resulting protein scan was normalized to molar concentration. The DSC endotherm for BF was fit to a trimeric model with independent linear baselines for the native and denatured state heat capacity functions (CpN(T) and CpD(T), respectively). The definition of ΔG U(T):
| (4) |
where ΔCp(T) = (CpD(T) − CpN(T)). Unlike the analogous situation with IED, with DSC the T m is the temperature where ΔG U = 0 (i.e., an intrinsic thermodynamic parameter independent of protein concentration). The trimer definition of the K U term is taken from (2) and (3) above. The temperature‐dependent transition between the CpN(T) and CpD(T) baselines is defined in terms of CpN(T) and ΔCp(T):
| (5) |
The protein heat capacity function Cp(T) (i.e., the “excess enthalpy” function) defined in terms of the trimeric model is:
| (6) |
Combined with the baseline function (5), the overall experimental Cp(T) heat capacity function is therefore:
| (7) |
The experimental data was fit to (7) using the DataFit nonlinear least‐squares software package (Oakdale Engineering, PA).
CONFLICT OF INTEREST
M. B. is a cofounder and has equity ownership in Trefoil Therapeutics, Inc.
AUTHOR CONTRIBUTIONS
Connie Tenorio: Conceptualization; investigation; validation; writing‐original draft. Joseph Parker: Investigation. Michael Blaber: Conceptualization; data curation; formal analysis; funding acquisition; investigation; methodology; project administration; supervision; writing‐original draft; writing‐review and editing.
Supporting information
DATA S1 Figure S1. The secondary structure diagram of the Symfoil protein, circular permutants, and the folding nucleus region.
Figure S2. Superdex 200 SEC mass calibration.
Figure S3. The density map of normalized AUC sedimentation coefficient (S20,w) for the BF protein.
ACKNOWLEDGMENTS
This work was supported in part by a research support agreement from Trefoil Therapeutics, Inc. C. A. T. was supported by a McKnight Fellowship. Support from the FSU Department of Biomedical Sciences and Council on Research and Creativity is acknowledged.
Tenorio CA, Parker JB, Blaber M. Oligomerization of a symmetric β‐trefoil protein in response to folding nucleus perturbation. Protein Science. 2020;29:1629–1640. 10.1002/pro.3877
Funding information Trefoil Therapeutics; FSU Department of Biomedical Sciences and Council on Research and Creativity; McKnight Fellowship
REFERENCES
- 1. McLachlan AD. Three‐fold structural pattern in the soybean trypsin inhibitor (Kunitz). J Mol Biol. 1979;133:557–563. [DOI] [PubMed] [Google Scholar]
- 2. Murzin AG, Lesk AM, Chothia C. β‐Trefoil fold. Patterns of structure and sequence in the kunitz inhibitors interleukins‐1β and 1α and fibroblast growth factors. J Mol Biol. 1992;223:531–543. [DOI] [PubMed] [Google Scholar]
- 3. Lee J, Blaber SI, Dubey VK, Blaber M. A polypeptide “building block” for the ß‐trefoil fold identified by “top‐down symmetric deconstruction”. J Mol Biol. 2011;407:744–763. [DOI] [PubMed] [Google Scholar]
- 4. Broom A, Doxey AC, Lobsanov YD, et al. Modular evolution and the origins of symmetry: Reconstruction of a three‐fold symmetric globular protein. Structure. 2012;20:1–11. [DOI] [PubMed] [Google Scholar]
- 5. Voet ARD, Noguchi H, Addy C, et al. Computational design of a self‐assembling symmetrical β‐propeller protein. Proc Natl Acad Sci U S A. 2014;111:15102–15107. [DOI] [PMC free article] [PubMed] [Google Scholar]
- 6. Longo LM, Lee J, Tenorio CA, Blaber M. Alternative folding nuclei definitions facilitate the evolution of a symmetric protein fold from a smaller peptide motif. Cell Struct. 2013;21:1–9. [DOI] [PubMed] [Google Scholar]
- 7. Serrano L, Matouschek A, Fersht AR. The folding of an enzyme. III: Structure of the transition state for unfolding of barnase analysed by a protein engineering procedure. J Mol Biol. 1992;224:805–818. [DOI] [PubMed] [Google Scholar]
- 8. Abkevich VI, Gutin AM, Shakhnovich EI. Specific nucleus as the transition state for protein folding: Evidence from the lattice model. Biochemistry. 1994;33:10026–10036. [DOI] [PubMed] [Google Scholar]
- 9. Fersht AR. Nucleation mechanisms in protein folding. Curr Opin Struct Biol. 1997;7:3–9. [DOI] [PubMed] [Google Scholar]
- 10. Fersht AR, Sato S. φ‐Value analysis and the nature of protein‐folding transition states. Proc Natl Acad Sci U S A. 2004;101:7976–7981. [DOI] [PMC free article] [PubMed] [Google Scholar]
- 11. Xia X, Longo LM, Sutherland MA, Blaber M. Evolution of a protein folding nucleus. Protein Sci. 2016;25:1227–1240. [DOI] [PMC free article] [PubMed] [Google Scholar]
- 12. Longo L, Lee J, Blaber M. Experimental support for the foldability‐function tradeoff hypothesis: Segregation of the folding nucleus and functional regions in FGF‐1. Protein Sci. 2012;21:1911–1920. [DOI] [PMC free article] [PubMed] [Google Scholar]
- 13. Lee J, Blaber M. Experimental support for the evolution of symmetric protein architecture from a simple peptide motif. Proc Natl Acad Sci U S A. 2011;108:126–130. [DOI] [PMC free article] [PubMed] [Google Scholar]
- 14. Tenorio CA, Longo LM, Parker JB, Lee J, Blaber M. Ab initio folding of a trefoil‐fold motif reveals structural similarity with a β‐propeller blade motif. Protein Sci. 2020;29:1172–1185. [DOI] [PMC free article] [PubMed] [Google Scholar]
- 15. Fülöp V, Jones DT. β propellers: Structural rigidity and functional diversity. Curr Opin Struct Biol. 1999;9:715–721. [DOI] [PubMed] [Google Scholar]
- 16. Nikkhah M, Jawad‐Alami Z, Demydchuk M, Ribbons D, Paoli M. Engineering of β‐propellor protein scaffolds by multiple gene duplication and fusion of an idealized WD repeat. Biomol Eng. 2006;23:185–194. [DOI] [PubMed] [Google Scholar]
- 17. Yadid I, Tawfik DS. Reconstruction of functional β‐propeller lectins via homo‐oligomeric assembly of shorter fragments. J Mol Biol. 2007;365:10–17. [DOI] [PubMed] [Google Scholar]
- 18. Chaudhuri I, Soding J, Lupas AN. Evolution of the β‐propeller fold. Proteins. 2008;71:795–803. [DOI] [PubMed] [Google Scholar]
- 19. Demeler B, van Holde KE. Sedimentation velocity analysis of highly heterogeneous systems. Analyt Biochem. 2004;335:279–288. [DOI] [PubMed] [Google Scholar]
- 20. Demeler B, Saber H, Hansen JC. Identification and interpretation of complexity in sedimentation velocity boundaries. Biophys J. 1997;72:397–407. [DOI] [PMC free article] [PubMed] [Google Scholar]
- 21. Myers JK, Pace CN, Scholtz JM. Denaturant m values and heat capacity changes: Relation to changes in accessible surface areas of protein unfolding. Protein Sci. 1995;4:2138–2148. [DOI] [PMC free article] [PubMed] [Google Scholar]
- 22. Harding SE. On the hydrodynamic analysis of macromolecular conformation. Biophys Chem. 1995;55:69–93. [DOI] [PubMed] [Google Scholar]
- 23. Brych SR, Blaber SI, Logan TM, Blaber M. Structure and stability effects of mutations designed to increase the primary sequence symmetry within the core region of a β‐trefoil. Protein Sci. 2001;10:2587–2599. [DOI] [PMC free article] [PubMed] [Google Scholar]
- 24. Brych SR, Dubey VK, Bienkiewicz E, Lee J, Logan TM, Blaber M. Symmetric primary and tertiary structure mutations within a symmetric superfold: A solution, not a constraint, to achieve a foldable polypeptide. J Mol Biol. 2004;344:769–780. [DOI] [PubMed] [Google Scholar]
- 25. Gill SC, von Hippel PH. Calculation of protein extinction coefficients from amino acid sequence data. Anal Biochem. 1989;182:319–326. [DOI] [PubMed] [Google Scholar]
- 26. Demeler B. UltraScan—A comprehensive data analysis software package for analytical ultracentrifugation experiments In: Scott DJ, Harding SE, Rowe AJ, editors. Modern analytical ultracentrifugation: Techniques and methods. UK: Royal Society of Chemistry, 2005; p. 210–229. [Google Scholar]
- 27. Eftink MR. The use of fluorescence methods to monitor unfolding transitions in proteins. Biophys J. 1994;66:482–501. [DOI] [PMC free article] [PubMed] [Google Scholar]
- 28. Backmann J, Schafer G, Wyns L, Bonisch H. Thermodynamics and kinetics of unfolding of the thermostable trimeric adenylate kinase from the archaeon Sulfolobus acidocaldarius . J Mol Biol. 1998;284:817–833. [DOI] [PubMed] [Google Scholar]
Associated Data
This section collects any data citations, data availability statements, or supplementary materials included in this article.
Supplementary Materials
DATA S1 Figure S1. The secondary structure diagram of the Symfoil protein, circular permutants, and the folding nucleus region.
Figure S2. Superdex 200 SEC mass calibration.
Figure S3. The density map of normalized AUC sedimentation coefficient (S20,w) for the BF protein.