

Abstract
Extracellular vesicles (EVs) convey information used in cell-to-cell interactions. Lipid analysis of EVs remains challenging because of small sample amounts available. Lipid discovery using traditional mass spectrometry platforms based on liquid chromatography and high mass resolution typically employs milligram sample amounts. We report a simple workflow for lipid profiling of EVs based on multiple reaction monitoring (MRM) profiling that uses microgram amounts of sample. After liquid-liquid extraction, individual EV samples were injected directly into the ESI ion source at low flow rates (10μL/min) and screened for 197 MRM transitions chosen to be characteristic of several classes of lipids. This choice was based on a discovery experiment which applied 1,419 MRMs associated with multiple lipid classes to a representative pooled sample. EVs isolated from 12 samples of human lymphocytes and 16 replicates from six different rat cells lines contained an estimated amount of total lipids of 326 to 805 μg. Samples showed profiles that included phosphatidylcholine (PC), sphingomyelin (SM), cholesteryl ester (CE) and ceramide (Cer) lipids, as well as acyl-carnitines. The lipid profiles of human lymphocyte EVs were distinguishable using principal component and cluster analysis in terms of prior antibody and drug exposure. Lipid profiles of rat cell lines EV’s were distinguishable by their tissue of origin.
Introduction
Cells are known to secrete vesicles when in apoptosis. However, healthy cells also secrete vesicles in response to cell activation, changes in pH, hypoxia, and cellular stress1. Extracellular vesicles (EVs) are composed of exosomes (size range 40-100 nm)2 and microvesicles (100 nm to ~1000 nm)2. Both exosomes and microvesicles contain materials derived from the original cell, including proteins, lipids, mRNA, miRNA and DNA, that can provide information on physiological conditions, such as maternal conceptus-maternal interactions during early pregnancy and nutritional mechanisms present in human breast milk3,4, and on pathological pathways, such as the progression of neurodegenerative diseases and cancers5.
Metabolomics and lipidomics platforms are often based on liquid chromatography (LC) coupled to mass spectrometry, especially that performed at high mass resolution6-8. These methods typically call for samples of at least one mg, an amount which is difficult to acquire from EVs. MRM profiling does not use chromatography and this, combined with the reliance on the non-scanning MRM experiment, confers significant advantages in terms of speed and sensitivity to the ng scale. The methodology has been reviewed recently9. An example of the application of MRM to lipid content of microscopic samples has been reported for preimplantation embryos10.
MRM profiling considers the metabolome and lipidome as collections of known functional groups rather than as thousands of unique small molecules. In order to access functional group information, the MRM profiling workflow starts with a Discovery Phase in which the functional group specific MS/MS scans - precursor (prec) and neutral loss (NL) scans – are applied to a sample that is representative of all those being studied. The choice of precursor and NL scans is based on prior knowledge of the fragmentation of lipids both from experiment and the literature, principally LipidMaps. The information on the parent and the product ion pairs derived from the Prec and NL experiments is compiled as a list of transitions. A subset of this list is selected on the basis of intensity to be used in the Screening Phase in the very fast (non-scanning) multiple reaction monitoring (MRM) experiments performed on the individual experimental samples. The transitions and their relative ion abundances in the MRM list represent the lipid profile of the individual samples and they are then analyzed by statistical methods. Even though MRM-profiling faces challenges related to the structural identification of small molecules11, its sensitivity and speed encouraged this application to EV lipid analysis.
Here, we report the application of MRM profiling9,12 to explore lipids present in different types of EVs. We report discrimination between the lipid profiles of human lymphocyte EVs based on the effects of antibody stimulation and response to mycophenolate (MPA) exposure. Also 16 samples from EVs isolated from six lines of rat cells were profiled and the data compared by cell origin, namely Schwann, ovarian cancer, lung fibroblast, hepatocytes, mesangial and mammary cancer cells.
Results and Discussion
The limited amounts of EV samples available for this study, meant that a supervised approach was employed in the Discovery Phase. Instead of performing precursor and NL scans in the Discovery Phase to recognize MRMs, a literature-based set of MRMs was chosen. This allowed less sample to be used even though it did not provide an opportunity to discover new MRMs. This same strategy was used previously when lipid profiling was applied to preimplantation bovine embryos11.
We compiled a database of 1,419 MRMs from the literature based on knowledge of the characteristic fragmentation behavior of particular lipid classes. This information was derived from the Lipid Maps database and from previous Pre and NL scans data, some cited elsewhere9. For example, phosphatidylcholine (PC) and sphingomyelin (SM) lipids give signals in Prec m/z 184 scans, phosphatidylethanolamines (PE) are seen in NL 141 Dalton, phosphatidylinositols (PI) in NL 277 Dalton, phosphatidylglycerols (PG) in NL 185 Dalton, phosphatidylserines (PS) in NL 189 Dalton, while cholesteryl esters (CE), give signals for Prec m/z 369, and acylcarnitines for Prec m/z 85. By pooling 14 test samples of rat EVs these and other MRMs totaling 1,419 were screened to discover the most significant MRMs. Screening was done by performing 200 MRMs in each sample injection after which 197 were selected that showed the highest signal-to-noise ratio. All 197 MRMs selected were at least 30% higher than the blank signals.
This smaller set of MRMs was used for the Screening phase, in which experimental samples, estimated to have total lipid amounts of 326 to 805 μg, were interrogated in a single sample injection, to avoid sample dilution. The decision to restrict the number to around 200 MRM scans for the screening phase was based on the wish to obtain multiple scans for each MRM. In our system, samples analyzed by direct injection in usually provide around 1 minute of ion signal (data not shown) over the 2 minutes of data acquisition. Using a dwell time of 25 milliseconds for each MRM, it is possible to obtain 10 scans for each MRM in one minute.
In the Screening phase, data was generated for statistical analysis. In total, 28 EV samples were examined. They included 12 from human lymphocytes and 16 from 6 different rat cell culture samples. Comparisons were made between principal component analysis (PCA) and heat maps. The workflow is summarized in Figure 1.
Figure 1.

MRM-profiling workflow. In the Discovery phase functional groups are interrogated to provide MRMs of interest. For the screening phase, this set of MRMs was used to screen individual samples and their relative amounts represent the EV lipid samples. There were 14 samples used in the Discovery phase, all from rat cell lines. For the screening phase, human (N=12) EVs samples were compared for mycophenolate (MPA) resistance and antibody stimulation. The lipid profiles of the EVs from six different rat cells (2 to 6 replicates/line) were compared by principal component analysis with the information on the cell line origin.
The MS data for both Discovery and Screening phases consisted of MRM transitions and ion intensities. The data was processed using in-house scripts to obtain a list of MRM transitions with their respective ion intensities. The absolute ion intensities for the EVs were compared to a blank sample (injection solvent). The top 197 MRMs (all showing ion intensities above 30% of the ion intensity for the blank sample in at least one of the samples) were chosen for use in the Screening phase and these were monitored over a period of two-minutes per sample. The screening method included MRMs from five lipid and one metabolite (acylcarnitine) class (Figure 2).
Figure 2.
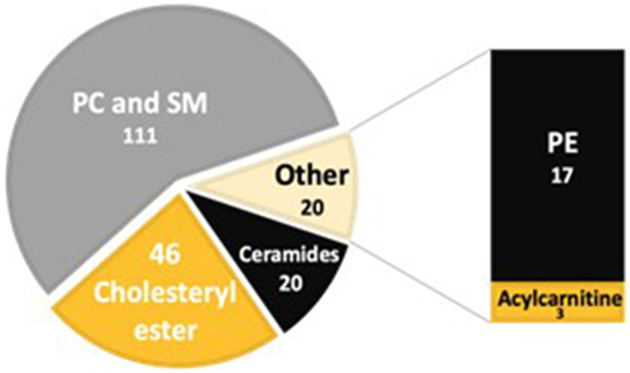
Numbers of MRMs selected for MRM profiling in Screening phase (total of 197) after screening test samples for 1,419 MRMs related to 10 lipid classes. Most intense MRMs evaluated in the Discovery phase (ion signal 30% or higher compared to blank) were compatible with phosphatidylcholine (PC), sphingomyelin (SM), phosphatidylethanolamine (PE), cholesteryl esters, (CE), ceramide lipids, as well as acylcarnitines.
The 15 MRMs that showed the highest overall intensities in at least one EV sample are listed in the chart in Figure 3. These lipids were PC, SM and ceramides the values of the fold change against the injection solvent blank for the 25 MRMs showing the highest fold changes compared to the blank in at least one sample for human EV samples analyzed in the study are listed at Table S2.
Figure 3.
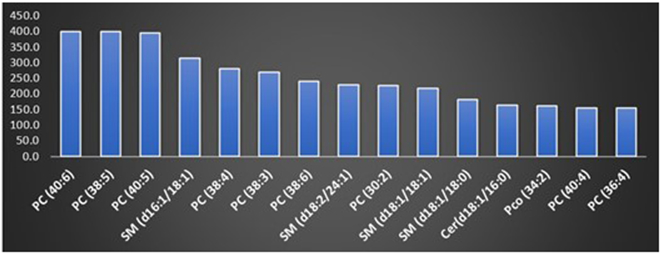
Plot showing the 15 MRMs which showed the highest intensity in at least one of the 28 samples examined in the screening phase. Data is displayed as fold change (y axis) relative to the signal recorded for blank injection solvent. All attributions are tentative.
PCA included selected MRMs detected in EVs from the human lymphocyte samples which showed drug resistance or sensitivity towards MPA (Figure 4a); EVs shed from unstimulated vs antibody stimulated human lymphocytes (Figure 4b); and EVs from rat cells of different origins (i.e. liver, lung, mesangial, Schwann, ovarian cancer, and adenocarcinoma cells) (Figure 4c). PCA scores plot in Figure 4a included only MRMs present on the receiver operating curve (ROC) with an area under the curve (AUC) ≥ 0.8 since use of all MRMs in the method did not provide adequate discrimination (Figure S1) due to uninformative MRMs. For Figure 4b-c all the experimental groups were compared by using the 50 MRMs that showed the highest variable of importance (VIP) score by partial least squares discriminant analysis - variable importance in the projection (PLS-DA VIP) as the input for the PCA plots13. Heatmaps with cluster analysis are depicted in Figure S2a for EVs from cells presenting drug resistance or sensitivity towards MPA, Figure S2b for EVs shed from unstimulated or anti-CD3/CD28 stimulated samples with and without MPA treatment and Figure S2c for EVs from rat cells of different origins.
Figure 4.

Principal component analysis (PCA) scores plots of (a) EVs from cells showing drug resistance or sensitivity towards MPA; (b) EVs shed from unstimulated or antibody stimulated samples, and (c) of EVs from rat cells of different origin (i.e. liver, kidney, Schwann, etc.). Outlier samples in (a) and (b) have been labeled and are discussed in the text.
Although the sample size used in this study was small, with the exception of two samples it was possible to observe separation of groups between EVs from human lymphocytes that were resistant or sensitive towards MPA (Figures 4a and S2a). Discrimination for MPA resistance of these human lymphocyte EVs was based mainly on the PC/SM and CE classes. There was one outlier (Subject D) related to drug stimulation. The stimulation of human lymphocytes and exposure to MPA resulted in some level of profile change compared to unstimulated samples (Figure 4b and S2b). The PCA scores plot for EVs from cells of different origin (Schwann, mesangial, liver, lung, ovarian cancer, and adenocarcinoma cells) can be seen in Figures 4c and S2c. The different EV sample groupings related to cell origin are due to up or down-regulation of most abundant PC/SMs, ceramides, and CEs in the cell lines (Table S3).
Rat cell line origin discrimination based on PC/SMs and PEs follows the trend of the common abundance of these classes in cells. Overall, the detection of PC, SM and PEs was expected as these are the most abundant cell membrane lipids. Ceramides are hydrolysis byproducts of sphingomyelin by the enzyme sphingomyelinase. Ceramides are important because they are well characterized signaling molecules14. In EVs, ceramides have been reported to have importance for cell survival, differentiation, apoptosis, and in the budding of exosomes (a form of EV)14. Lastly, ceramides are known to have a role in macrophage-associated chemotaxis14,15.
Besides PCs and ceramides, we detected MRMs related to CEs. CEs are neutral lipids usually concentrated in intracytoplasmic droplets, and one of the most abundant lipid sources in animal plasma16. These results need to be confirmed, but the presence of CEs in the EV samples could be related to the high abundance of CEs and TAGs in the lipid droplets. It has also been suggested that for CE and TAG to be isolated in the exosome, other cell contents will be co-isolated with the original exosome extraction7,17. This lipid class has also been detected in EVs from non-tumorigenic, tumourigenic and metastatic prostate cell lines and correlated with disease progression5,18,19.
Experimental
Cell Lines Used in the Study and Preparation of Enriched EV Culture Media
Clone 9 hepatocytes (2 replicates; cat. no. CRL-1439), RFL-6 lung fibroblasts (2 replicates; cat. no. CCL-192), RMC mesangial kidney cells (6 replicates; cat. no. CRL-2573), RSC96 neuronal Schwann cells (2 replicates, cat. no. CRL-2765), and MAT B III mammary carcinoma cells (2 replicates, cat. no. CRL-1666) were obtained from American Type Culture Collections (ATCC, Manassas, VA, USA). Nutu-19 ovarian cancer cells (2 replicates used for the experiments) were obtained as a gift from Dr. Michael W. Berns at University of California, Irvine, with permission from Fox Chase Cancer Center, Philadelphia, PA, USA.
Clone 9 hepatocyte cells were cultured in F-12K medium (Corning, Corning, NY, USA), 10% (v/v) fetal bovine serum (FBS; Atlanta Biologicals, Flowery Branch, GA, USA); RFL-6 lung fibroblast cells in F-12K, 20% (vol/vol) FBS; RMC mesangial cells in DMEM (ATCC), 15% (v/v) FBS; RSC96 and Nutu-19 cells in DMEM, 10% (v/v) FBS; and MAT B III cells in McCoy’s 5A (Corning), 10% (v/v) FBS. Cells were grown in cell culture treated T-75 flasks (Fisher Scientific, Pittsburgh, PA, USA) in a humidified 37°C environment with 5% CO2. Prior to EV isolation, rat cells were passaged at low density and incubated for 90 hours in the appropriate complete medium supplemented with vacuum filtered exosome-depleted FBS (System Biosciences, Palo Alto, CA, USA).
For passaging, adherent cells were washed with phosphate buffered saline (PBS, cat. no. 1040CV, Corning) and detached using 0.25% (w/v) trypsin, 2.21 mM EDTA in HBSS (cat. no. 25053CI, Corning). MAT B III suspension cells were collected by transferring media and cells to sterile low-binding 15 ml conical tubes (cat. no. 05412700, Eppendorf, Hauppauge, NY, USA), pelleted by centrifugation (300 x g, RT, 5 min), washed once with PBS, and resuspended in 15 ml complete media. Subculturing was performed using the recommended ratio for each cell line as specified in ATCC guidelines for each cell line, or 1:3 - 1:6 for Nutu-19 cells. All cell lines were authenticated and verified free of interspecies or mycoplasma contamination by IDEXX (Westbrook, ME, USA).
Extracellular vesicle (EV) enrichment media was prepared by supplementing the respective media for each cell line (F-12K or DMEM) with 10%/15%/20% clarified exosome-depleted fetal bovine serum, as appropriate. Prior to enrichment, cells were seeded at various densities (Clone 9, 6×10⁵ cells/75 cm2; RFL-6, 1×10⁶ cells/75 cm2; RMC, 3×10⁵ cells/75 cm2; RSC96, 5×10⁵ cells/75 cm2; MAT B III, 1×10⁶ cells/mL; Nutu-19, 1×10⁶ cells/75 cm2) using the appropriate complete media, and allowed to incubate for 6 hours. After cellular attachment was confirmed by light microscopy, media were aspirated and cells were washed three times with PBS. EV enrichment media was added to each flask, and cells were incubated for an additional 90 hours under standard conditions.
Human Lymphocyte Samples
Human lymphocyte medium was obtained from a study identifying predictors of mycophenolate (MPA) sensitivity approved by the Indiana University School of Medicine Institutional Review Board (Protocol #1603179330). Enriched human lymphocyte medium was obtained from unstimulated lymphocytes cultured for 24 hours in RPMI media (Corning Cellgro, Manassas, VA) supplemented with 10% FBS (HyClone FBS, GE Healthcare, Pittsburgh, PA) and 1% penicillin/streptomycin (MP Biomedicals, Solon, OH). Media were also obtained from anti-CD3/CD28 lymphocytes stimulated with ImmunoCult Human CD3/CD28 T Cell Activator (STEMCELL Technologies, Cambridge, MA) or treated with and without MPA (DOT Scientific, Burton, MI) for 72 hours20.
Exosome-depleted fetal bovine serum (EXO-FBS-50A-1, System Biosciences LLC, Palo Alto, CA, USA) was clarified by vacuum filtration (cat. no. 431162, Corning). Human lymphocytes were obtained from Ficoll Isolated blood cells (Ficoll-Paque PLUS, GE Healthcare, Pittsburgh, PA). Unstimulated cells were grown in T-25 flasks for 24 hours before media collection. RPMI media (Corning Cellgro, Manassas, VA) supplemented with 10% FBS (HyClone FBS, GE Healthcare, Pittsburgh, PA) and 1% penicillin/streptomycin (MP Biomedicals, Solon, OH) was used for all lymphocyte samples. Lymphocytes were incubated at 37°C 5% CO2. Stimulation was performed by supplementing RPMI media with antibodies to CD3/CD28 for 36 hours (ImmunoCult Human CD3/CD28 T Cell Activator, STEMCELL Technologies, Cambridge, MA). After stimulation, lymphocytes were treated without and with 1 μg/mL MPA (DOT Scientific, Burton, MI) for 24 hours. The EV-enriched media was then transferred to 15 mL low-binding conical tubes and centrifuged (500 x g, 4°C, 10 min) to pellet residual cells and debris. 9 mL (or less, as necessary) of each supernatant was carefully transferred to a new 15 mL low-binding conical tube.
Isolation of EVs
For EV recovery, EV-enriched media were transferred to 15 mL low-binding conical tubes (Eppendorf) and centrifuged (500 x g, 4°C, 10 min) to pellet residual cells and debris. Supernatants were carefully transferred to new 15 mL conical tubes and Total Exosome Isolation Reagent (Invitrogen, Carlsbad, CA, USA) was added in a 1:2 reagent:medium ratio. Contents were mixed by vortexing prior to overnight incubation at 4°C. The precipitated contents of each 15 mL conical tube were consolidated into a single 1.5 mL low-binding microcentrifuge tube (Eppendorf, Hamburg, Germany) by the repeated transfer of 1.2 mL into the microcentrifuge tube, centrifugation (10,000 x g, 4°C, 10 min), and discarding of the supernatant. Each final pellet was gently washed with 1 mL PBS (Corning, Midland, NC) and resuspended in 120 μL PBS overnight at 4°C. Resuspended pellets were mixed by vortexing, added to Exosome Spin Columns (Invitrogen, Waltham, MA) for purification according to the manufacturer’s protocol, and quantified for protein content using a BCA Protein Assay Kit (Thermo Fisher Scientific, Waltham, MA). Purified EV aliquots were stored at −80°C until mass spectrometric analysis.
Total exosome Isolation Reagent (cat. no. 4478359, Invitrogen, Carlsbad, CA, USA) was added to each tube in a 1:2 reagent:media ratio, and contents were mixed by vortexing prior to overnight incubation at 4°C. The precipitated contents of each 15 mL conical tube were consolidated into a single 1.5 mL low-binding microcentrifuge tube (cat. no. 13698790, Eppendorf) by the repeated transfer of 1.2 mL into the microcentrifuge tube, centrifugation (10,000 x g, 4°C, 10 min), and discarding of the supernatant. Each pellet was gently washed with 1 mL PBS and then resuspended in 120 uL PBS overnight at 4°C. Resuspended pellets were mixed by vortexing, added to Exosome Spin Columns (cat. no. 4484449, Invitrogen) for purification according to the manufacturer’s protocol, and quantified by protein content using a BCA Protein Assay Kit (cat. no. PI23227, Fisher). Purified EV aliquots were stored at −80°C until mass spectrometric analysis.
Sample Preparation and MS analysis
Lipid extraction was performed on the EV samples using with the Bligh & Dyer Protocol21. In brief, the volume of 200 μL of PBS buffer containing the EV protein was placed in a microtube; and methanol (450 μL) and chloroform (250 μL) were added. Samples were incubated at room temperature for 15 min. Next, 250 μL of ultrapure water and 250μL of chloroform were added. The samples were centrifuged at 16,000 × g for 10 minutes to enhance polar separation from the nonpolar phase. The organic layer (bottom layer) was pipetted out and placed into a new microtube where it was dried using a stream of nitrogen and stored at −80℃ until MS analysis. For the MS analysis, dried EV extracts were diluted in acetonitrile (ACN)/methanol/ammonium acetate 300mM, v/v/v, 6.65:3:0.35 (injection solvent). ACN + 0.1% formic acid was used as the solvent between injections. For each MRM method, 8 μL of solution was injected at a flow rate of 10μL/min. The data acquisition time for each method was two minutes on a triple quadrupole mass spectrometer (Agilent QQQ 6410, Santa Clara, CA) equipped with an autosampler (Agilent G1367A 1100 series, Santa Clara, CA). Electrospray ionization voltage was 4 kV in positive ion mode. More detail instrument parameters are listed at Table S1.
The capillary pump connected to the autosampler operated at a flow rate of 10μL/min and a pressure of 100 bar. Capillary voltage on the instrument was 3.5‐5 kV and the gas flow was 5.1 L/min at 300°C10. More detailed instrument parameters are listed at Table S1.
The analysis of Discovery phase data was processed using in-house scripts to obtain a list of MRM transitions with their respective ion intensities. In the case of the analysis of the Screening phase data, instead of simply using all MRMs higher than the blank to create the lipid profile, we applied a denoising filter which consisted of eliminating MRMs which did not yield 30% ion signal above that of the blank sample in at least one of the samples. Next, the value of ion intensity of each MRM was normalized by the total ion count (TIC) to obtain the relative amounts, i.e. the lipid profile. MetaboAnalyst 4.0 (http://www.metaboanalyst.ca) was used for multivariate statistics by principal component analysis (PCA) and to generate heatmaps.
Lipid estimation in EV samples
The amount of lipid in the samples used for this research was not measured directly due to small amounts available. We report estimated amounts of lipids (326 to 805 μg of total lipids and 3.65- 9 x 10¹¹ particles) based on protein measurements by bicinchoninic acid (BCA) in the samples related to literature about the relationship of the amounts of proteins and lipids in EVs. The protein content of the EV samples used in this research was measured to be 73 – 180 μg. Information from the nanoparticle tracking analysis (NTA) and other methods report an average concentration 5 × 10⁹ particles per μg of sample protein is estimated22,23. It is important to note that these reports of EV amounts per μg of sample protein were based on the NanoSight LM10 system to assay EVs isolated by ultracentrifugation. The NanoSight system is known to overestimate nanosphere calibration controls by ~2-fold24. We used the Particle Metrix ZetaView system to assay EVs isolated with a commercial precipitation reagent as described in detail at the supplementary information. The EV isolation approach using reagents was chosen since it demonstrates higher yield but lower purity than ultracentrifugation due to co-precipitation of other proteins25. Nonetheless, using literature data on standard curves of EV protein content (determined by BCA assay) and known lipid formulations, Osteikoetxea, et al. reported a 0.21 ratio of protein to total lipids (or 4.47 lipid:protein) in EVs26, while Li, et al. reported a 2.64 ratio of membrane lipids to total protein27. From these numbers and the fact that we measured 73-180 μg of protein in the samples used for this research, we estimate that the EV samples used in this study contain 326 to 805 μg of total lipids and 193 to 475 μg of membrane lipids. In terms of molarity, Llorente, et al. reported a mean amount of 791 nmol lipids per mg protein in EVs28, which would suggest 58 to 142 nmoles in our samples.
Conclusion
Even though we have reported previously on the use of MRM-profiling for the analysis of microscopic samples represented by bovine embryos10, the results of this exploratory study demonstrate the informative value of lipid analysis of EVs. Using EVs isolated from human lymphocytes and rat cell lines, we have described the detection of MRMs compatible with PC, SM, CE, ceramides and acyl-carnitines in 2 minutes of data acquisition per sample. Most interestingly, lipid profile discrimination could be related to cell antibody stimulation and properties (drug resistance), as well as to cell origin.
Supplementary Material
Acknowledgements
We acknowledge support from the Bindley Bioscience Center, the Purdue University Center for Cancer Research NIH grant P30 CA023168, K08 grant: K08GM119006 and the MPA sensitivity study was supported by NIH-NIDDK K08-DK107864. We are thankful to Dr. Michael W. Berns for the support with some cell lines used for this project under permission from the Fox Chase Cancer Center.
Footnotes
Conflicts of interest
There are no conflicts to declare.
Notes and references
- 1.Xu R, Rai A, Chen M, Suwakulsiri W, Greening DW, Simpson RJ. Extracellular vesicles in cancer—implications for future improvements in cancer care. Nature reviews Clinical oncology. 2018;15(10):617. [DOI] [PubMed] [Google Scholar]
- 2.Raposo G, Stoorvogel W. Extracellular vesicles: exosomes, microvesicles, and friends. Journal of Cell Biology. 2013;200(4):373–383. [DOI] [PMC free article] [PubMed] [Google Scholar]
- 3.Burns GW, Brooks KE, Spencer TE. Extracellular vesicles originate from the conceptus and uterus during early pregnancy in sheep. Biology of Reproduction. 2016;94(3):56, 51–11. [DOI] [PubMed] [Google Scholar]
- 4.de la Torre Gomez C, Goreham RV, Serra JJ Bech, Nann T, Kussmann M. “Exosomics”—a review of biophysics, biology and biochemistry of exosomes with a focus on human breast milk. Frontiers in genetics. 2018;9:92. [DOI] [PMC free article] [PubMed] [Google Scholar]
- 5.Brzozowski JS, Jankowski H, Bond DR, et al. Lipidomic profiling of extracellular vesicles derived from prostate and prostate cancer cell lines. Lipids in health and disease. 2018;17(1):211. [DOI] [PMC free article] [PubMed] [Google Scholar]
- 6.Gross RW. The evolution of lipidomics through space and time. Biochimica et Biophysica Acta (BBA)-Molecular and Cell Biology of Lipids. 2017;1862(8):731–739. [DOI] [PMC free article] [PubMed] [Google Scholar]
- 7.Gonzalez-Dominguez A, Duran-Guerrero E, Fernandez-Recamales A, et al. An overview on the importance of combining complementary analytical platforms in metabolomic research. Current topics in medicinal chemistry. 2017;17(30):3289–3295. [DOI] [PubMed] [Google Scholar]
- 8.Kempa EE, Hollywood KA, Smith CA, Barran PE. High throughput screening of complex biological samples with mass spectrometry–from bulk measurements to single cell analysis. Analyst. 2019;144(3):872–891. [DOI] [PubMed] [Google Scholar]
- 9.Xie ZFC, Vireque AA, Cooks RG. Multiple Reaction Monitoring Profiling (MRM Profiling): Small Molecule Exploratory Analysis Guided by Chemical Functionality. 2020, Chemistry and Physics of Lipids CPL-D-20-00169R1. Accepted for publication . [DOI] [PubMed] [Google Scholar]
- 10.de Lima CB, Ferreira CR, Milazzotto MP, Sobreira TJP, Vireque AA, Cooks RG. Comprehensive lipid profiling of early stage oocytes and embryos by MRM profiling. Journal of Mass Spectrometry. 2018;53(12):1247–1252. [DOI] [PubMed] [Google Scholar]
- 11.Monge ME, Dodds JN, Baker ES, Edison AS, Fernández FM. Challenges in Identifying the Dark Molecules of Life. Annual Review of Analytical Chemistry. 2019;12:177–199. [DOI] [PMC free article] [PubMed] [Google Scholar]
- 12.Xie Z, Gonzalez LE, Ferreira CR, et al. Multiple reaction monitoring profiling (MRM-profiling) of lipids to distinguish strain-level differences in microbial resistance in Escherichia coli. Analytical chemistry. 2019;91(17):11349–11354. [DOI] [PubMed] [Google Scholar]
- 13.Gromski PS, Muhamadali H, Ellis DI, et al. A tutorial review: Metabolomics and partial least squares-discriminant analysis–a marriage of convenience or a shotgun wedding. Analytica chimica acta. 2015;879:10–23. [DOI] [PubMed] [Google Scholar]
- 14.Hough KP, Wilson LS, Trevor JL, et al. Unique lipid signatures of extracellular vesicles from the airways of asthmatics. Scientific reports. 2018;8(1):1–16. [DOI] [PMC free article] [PubMed] [Google Scholar]
- 15.Török NJ. Extracellular vesicles and ceramide: new mediators for macrophage chemotaxis? Journal of lipid research. 2016;57(2):157–158. [DOI] [PMC free article] [PubMed] [Google Scholar]
- 16.Han X, Gross RW. Shotgun lipidomics: electrospray ionization mass spectrometric analysis and quantitation of cellular lipidomes directly from crude extracts of biological samples. Mass spectrometry reviews. 2005;24(3):367–412. [DOI] [PubMed] [Google Scholar]
- 17.Lu Y, Li N, Gao L, et al. Acetylcarnitine is a candidate diagnostic and prognostic biomarker of hepatocellular carcinoma. Cancer research. 2016;76(10):2912–2920. [DOI] [PubMed] [Google Scholar]
- 18.Li J, Ren S, Piao H-l, et al. Integration of lipidomics and transcriptomics unravels aberrant lipid metabolism and defines cholesteryl oleate as potential biomarker of prostate cancer. Scientific reports. 2016;6(1):1–11. [DOI] [PMC free article] [PubMed] [Google Scholar]
- 19.Yue S, Li J, Lee S-Y, et al. Cholesteryl ester accumulation induced by PTEN loss and PI3K/AKT activation underlies human prostate cancer aggressiveness. Cell metabolism. 2014;19(3):393–406. [DOI] [PMC free article] [PubMed] [Google Scholar]
- 20.Casey T, Harlow K, Ferreira CR, Sobreira TJ, Schinckel A, Stewart K. The potential of identifying replacement gilts by screening for lipid biomarkers in reproductive tract swabs taken at weaning. Journal of applied animal research. 2018;46(1):667–676. [Google Scholar]
- 21.Bligh EG, Dyer WJ. A rapid method of total lipid extraction and purification. Canadian journal of biochemistry and physiology. 1959;37(8):911–917. [DOI] [PubMed] [Google Scholar]
- 22.Takov K, Yellon DM, Davidson SM. Comparison of small extracellular vesicles isolated from plasma by ultracentrifugation or size-exclusion chromatography: yield, purity and functional potential. Journal of extracellular vesicles. 2019;8(1):1560809. [DOI] [PMC free article] [PubMed] [Google Scholar]
- 23.Webber J, Clayton A. How pure are your vesicles? Journal of extracellular vesicles. 2013;2(1):19861. [DOI] [PMC free article] [PubMed] [Google Scholar]
- 24.Bachurski D, Schuldner M, Nguyen P-H, et al. Extracellular vesicle measurements with nanoparticle tracking analysis–An accuracy and repeatability comparison between NanoSight NS300 and ZetaView. Journal of extracellular vesicles. 2019;8(1):1596016. [DOI] [PMC free article] [PubMed] [Google Scholar]
- 25.Patel GK, Khan MA, Zubair H, Srivastava SK, Singh S, Singh AP. Comparative analysis of exosome isolation methods using culture supernatant for optimum yield, purity and downstream applications. Scientific reports. 2019;9(1):1–10. [DOI] [PMC free article] [PubMed] [Google Scholar]
- 26.Osteikoetxea X, Balogh A, Szabó-Taylor K, et al. Improved characterization of EV preparations based on protein to lipid ratio and lipid properties. PLoS One. 2015;10(3). [DOI] [PMC free article] [PubMed] [Google Scholar]
- 27.Li N, Huang Z, Ye Z, Zhang X, Chen L, Xiao Y. Total membrane lipid assay (MLA): simple and practical quantification of exosomes based on efficient membrane-specific dyes unaffected by proteins. Materials Chemistry Frontiers. 2018;2(11):2130–2139. [Google Scholar]
- 28.Llorente A, Skotland T, Sylvänne T, et al. Molecular lipidomics of exosomes released by PC-3 prostate cancer cells. Biochimica et Biophysica Acta (BBA)-Molecular and Cell Biology of Lipids. 2013;1831(7):1302–1309. [DOI] [PubMed] [Google Scholar]
Associated Data
This section collects any data citations, data availability statements, or supplementary materials included in this article.