

Abstract
We evaluated the associations of exposure to fine particulate matter (particulate matter with an aerodynamic diameter ≤2.5 μm (PM2.5) at concentrations of <12 μg/m3, 12–14 μg/m3, and ≥15 μg/m3) and nitrogen dioxide (at concentrations of <26 parts per billion (ppb), 26–29 ppb, and ≥30 ppb) with placental abruption in a prospective cohort study of 685,908 pregnancies in New York, New York (2008–2014). In copollutant analyses, these associations were examined using distributed-lag nonlinear models based on Cox models. The prevalence of abruption was 0.9% (n = 6,025). Compared with a PM2.5 concentration less than 12 μg/m3, women exposed to PM2.5 levels of ≥15 μg/m3 in the third trimester had a higher rate of abruption (hazard ratio (HR) = 1.68, 95% confidence interval (CI): 1.41, 2.00). Compared with a nitrogen dioxide concentration less than 26 ppb, women exposed to nitrogen dioxide levels of 26–29 ppb (HR = 1.11, 95% CI: 1.02, 1.20) and ≥30 ppb (HR = 1.06, 95% CI: 0.96, 1.24) in the first trimester had higher rates of abruption. Compared with both PM2.5 and nitrogen dioxide levels less than the 95th percentile in the third trimester, rates of abruption were increased with both PM2.5 and nitrogen dioxide ≥95th percentile (HR = 1.44, 95% CI: 1.15, 1.80) and PM2.5 ≥95th percentile and nitrogen dioxide <95th percentile (HR = 1.43 95% CI: 1.23, 1.66). Increased levels of PM2.5 exposure in the third trimester and nitrogen dioxide exposure in the first trimester are associated with elevated rates of placental abruption, suggesting that these exposures may be important triggers of premature placental separation through different pathways.
Keywords: cohort studies, distributed-lag models, nitrogen dioxide, particulate matter, placental abruption
Abbreviations
- CI
confidence interval
- DLNM
distributed-lag nonlinear model
- HR
hazard ratio
- NYC
New York City
- PM2.5
particulate matter with an aerodynamic diameter ≤2.5 μm
- PM10
particulate matter with an aerodynamic diameter ≤10 μm
- ppb
parts per billion
Accumulating evidence suggests that exposure to air pollution—especially particulate matter with an aerodynamic diameter ≤2.5 μm (PM2.5), particulate matter with an aerodynamic diameter ≤10 μm (PM10), nitrogen dioxide, ozone, and elemental carbon—is associated with increased risks of stillbirth, restricted fetal growth, preeclampsia, and gestational hypertension (1–8). These complications may originate during the stages of placental implantation or early in pregnancy (9, 10), with oxidative stress at the maternal-fetal interface and uteroplacental ischemia leading to inflammation as the chief causal mechanisms (11). Inhalation of fine particulate matter, particularly ultrafine matter, can cause oxidative stress (12–14), a proinflammatory response (15, 16), which may contribute to placental hypoperfusion. This pathway may be responsible for the association between air pollution and abruption and related obstetrical complications.
Placental abruption is the premature separation of the placenta from its implantation site on the uterine wall due to rupture of maternal vessels in the decidua basalis prior to delivery of the fetus; it complicates about 1% of pregnancies (17, 18). Multiple risk factors for this complication have been identified, including advanced maternal age, multiparity, multiple births, African-American race/ethnicity, smoking, cocaine use, a short time interval between pregnancies, chronic hypertension, preeclampsia, and prior abruption (19–22). Abruption is associated with increased risks of stillbirth and perinatal mortality (23), as well as preterm delivery and neurodevelopmental disorders in children (24, 25). Women with abruption also have increased risks of cardiovascular and cerebrovascular complications later in life (26–33).
We have previously hypothesized that abruption can be characterized clinically by 2 distinct pathways: 1) acute-onset abruption resulting from premature placental detachment and 2) chronic abruption secondary to defective placental implantation (17). In a case-crossover analysis, we showed that PM2.5 and nitrogen dioxide exposures 4–6 days prior to delivery were associated with 15%–25% increased risks of abruption, suggesting that these pollutants may “trigger” acute-onset abruptions secondary to the premature placental detachment pathway (34).
In this study, we hypothesized that exposures incurred around the time of conception and placental implantation may be associated with abruption. If this hypothesis is true, observed associations may provide clues to the origins of defective implantation and an underlying chronic pathophysiological process. Our objectives in this study were to evaluate the associations of exposure to PM2.5 and nitrogen dioxide with placental abruption. We further examined air pollution exposures during the month before conception, as well as by month and trimester of exposure during pregnancy, to identify critical windows of vulnerability.
METHODS
We designed a cohort analysis of pregnancies leading to births in New York City (NYC) between December 2008 and December 2014. Data were derived from all births taking place in NYC and linked to maternal and newborn hospitalizations. This linkage was undertaken and provided by the New York State Department of Health Statewide Planning and Research Cooperative System (35). Ethics approval was obtained from the institutional review board of Columbia University Irving Medical Center, as well as from the New York City Bureau of Vital Statistics and the Statewide Planning and Research Cooperative System.
Placental abruption
Cases of placental abruption were identified from both the birth certificates (diagnosed by the attendant at delivery) and maternal hospital delivery and discharge records (coded on the basis of International Classification of Diseases, Ninth Revision, Clinical Modification, code 641.2). We ascertained abruption from a diagnosis present in either of these 2 sources.
Air pollution exposure
We ascertained air monitoring data from 2 sources: temporally resolved regulatory monitors from the New York State Department of Environmental Conservation (36) and spatially resolved survey data from the New York City Community Air Survey (Sarah Johnson, New York City Department of Health and Mental Hygiene, unpublished data, 2017). We also collected a wide range of data on emissions sources and meteorological variables, including data on traffic, industrial land use, building area, green space, mixing depth (the vertical distance, measured from the surface of the earth, in which pollutants are vigorously mixed), precipitation, wind speed, and others. For spatial predictors that did not vary temporally, we linked the data to air quality monitoring sites by computing densities within a series of circular buffers of 100 m, 300 m, 500 m, and 1,000 m. For temporal variables, we computed citywide time series for the time period of the study and linked on day. In total, we computed more than 130 different variables used as candidate predictors in the air quality modeling. After splitting the data into training and testing sets, we used 10-fold cross-validation to identify the best modeling approach, tuning parameters, and the best model for predicting daily PM2.5 and nitrogen dioxide levels. We found that a gradient boosting machine model with a quadratic kernel performed the best, with R2 values in predicting the withheld test set of 0.74 (2.38 μg/m3) for PM2.5 and 0.70 (4.73 parts per billion (ppb)) for nitrogen dioxide. All exposure assignments were at a high spatial resolution (25- × 25-m2 grid), and specific details on the exposure modeling and assignment have been previously published (34).
Study population and cohort composition
Of the 840,916 births that took place in NYC between 2008 and 2014, we restricted the study to women who delivered in one of the 5 NYC boroughs. Furthermore, we included exposure data from 1 month before conception and across all 3 trimesters. After all exclusions, 685,908 pregnancies remained (Figure 1).
Figure 1.
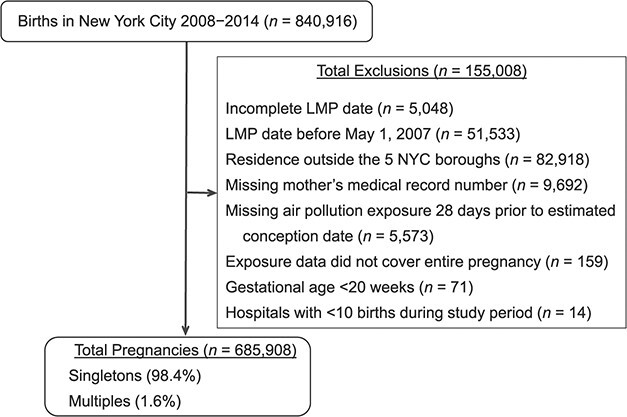
Selection of the cohort for a study of air pollution and risk of placental abruption, New York, New York, 2008–2014. Data were derived from all births taking place in New York City (NYC) between December 2008 and December 2014 and linked to maternal and newborn hospitalizations. LMP, last menstrual period.
Potential confounders
We examined several potential confounders, all chosen on the basis of those reported in the literature. Sociodemographic confounders included year of conception, season of conception (spring (March–May), summer (June–August), autumn (September–November), or winter (December–February)), maternal age, parity (1, 2, or ≥3), education (≤8, 9–11, 12, 13–16, or ≥17 years of schooling), marital status, Medicaid enrollment, and plurality (singleton or twin/higher-order birth).
Behavioral factors considered as confounders included smoking (nonsmoker, smoking in the 3 months before pregnancy, or smoking during pregnancy) and prepregnancy body mass index (weight (kg)/height (m)2). We also considered socioeconomic characteristics at the census tract level, including the proportion of households below the federal poverty line and median annual family income (US dollars). For continuous covariates (maternal age, body mass index, proportion of households below the poverty level, and median family income), we also included the squared terms of these covariates in the models for adjustment to allow for a nonlinear relationship.
Statistical analysis
Average PM2.5 and nitrogen dioxide exposures by gestation month and trimester were calculated from 1 month prior to the estimated conception date to the week of delivery. Associations between average air pollution exposures and time to abruption were examined in 2 ways. First, we examined the associations between abruption and monthly air pollution exposures as continuous variables, coupling distributed-lag nonlinear models (DLNMs) in the setting of Cox proportional hazards regression (37, 38). Second, we evaluated the association based on categorical variables for PM2.5 concentration (<12 μg/m3, 12–14 μg/m3, and ≥15 μg/m3) and nitrogen dioxide concentration (<26 ppb, 26–29 ppb, and ≥30 ppb) in each trimester, using “standard” (non-DLNM) Cox proportional hazards models. These categorizations correspond approximately to the 75th and 95th percentiles of the respective distributions. Exposure data were simultaneously included in all models for all 4 periods (1 month before conception and 3 trimesters of pregnancy) to account for the potentially high correlations across trimesters, as well as negative control exposures for confounding (39, 40).
For both approaches, analyses were based on fitting a marginal Cox model with time to abruption defined by gestation week, with the start time being the date of conception and the end time being the date of delivery. We accounted for repeat pregnancies in a given woman using the method of generalized estimating equations. We allowed baseline abruption rates to differ according to maternal race/ethnicity (non-Hispanic White, non-Hispanic Black, Hispanic, or other) and hospital. Using the approach of time-to-event analysis, we aligned the data within each gestational-month risk set (41, 42). DLNMs using forward lags were employed to fit all monthly exposures to PM2.5 and nitrogen dioxide into a single 2-pollutant model (37, 43, 44). The objective of using the 2-pollutant model was to account for potential confounding by copollutant and to obtain surrogates for traffic-related (nitrogen dioxide) and non–traffic-related (PM2.5) associations with abruption. We used the weighted Akaike’s Information Criterion (45) to evaluate deviations from linearity in the air pollution–abruption association and, if deviations were present, to select the appropriate number of degrees of freedom (37). There was no evidence for a nonlinear exposure-response curve for nitrogen dioxide, but the association between PM2.5 and abruption was nonlinear with 3 degrees of freedom (see Web Table 1, available online at https://doi.org/10.1093/aje/kwaa259). We estimated associations between air pollution and abruption for an interquartile-range scaled increase in nitrogen dioxide concentration (6 ppb). For the lag constraints in the DLNMs, we assigned 3 degrees of freedom for both lag months and PM2.5.
A “traditional” marginal Cox proportional hazards model (i.e., non-DLNM) was also used to examine the joint association between the 2 pollutants and abruption. For this analysis, PM2.5 and nitrogen dioxide levels were categorized as ≥95th percentiles. Joint effects of PM2.5 and nitrogen dioxide on abruption were assessed on the basis of the relative excess risk due to interaction with 95% confidence intervals on an additive scale (46). We used SAS, version 9.4 (SAS Institute Inc., Cary, North Carolina), and RStudio, version 3.4.2 (R Foundation for Statistical Computing, Vienna, Austria), with the “dlnm” package (version 2.1.3) (47) for statistical analysis.
Sensitivity analyses
We undertook 3 sets of sensitivity analyses. First, we examined the association between persistently high exposure (≥95th percentiles) to both PM2.5 and nitrogen dioxide from 1 month preconception through the entire pregnancy and rates of abruption based on copollutant models. Second, we repeated the main analyses including only those cases with an abruption diagnosis recorded in both the birth records and the hospitalization data (1,102 abruption cases). Third, since abruption rates and risk factors for abruption differ between singletons and twins/higher-order births, we examined the associations between PM2.5 and nitrogen dioxide and abruption with the data restricted to singleton births (the numbers of twin and higher-order births were too low for stable analysis).
RESULTS
The proportions of pregnancies to women of advanced maternal age (35–39 years and ≥40 years), multiparous women (parity ≥3), and non-Hispanic Black women were higher in the abruption groups than in the nonabruption group (Table 1). Similarly, single marital status, multiple births, smoking, chronic hypertension, and preeclampsia proportion were higher among abruption groups than in the nonabruption group. We also compared maternal characteristics among abruption births with diagnosis based on both the birth and hospitalization records versus those with diagnosis from neither source. These analyses showed that the distributions of maternal characteristics were similar for the 2 groups.
Table 1.
Distribution of Maternal Characteristics in Relation to Placental Abruption, New York, New York, 2008–2014
| Placental Abruption | ||||||||||
|---|---|---|---|---|---|---|---|---|---|---|
| Maternal Characteristic |
All Births
(n = 685,908) |
No Abruption
(n = 679,813) |
Diagnosis From Either
Birth Records or Hospital Discharge (n = 6,095) |
Diagnosis From Both
Birth Records and Hospital Discharge (n = 1,212) |
||||||
| No. of Births | Column % | No. of Births | Column % | No. of Cases | Column % | Row % | No. of Cases | Column % | Row % | |
| Year of conception | ||||||||||
| 2007 | 35,360 | 5.2 | 35,023 | 5.2 | 337 | 5.5 | 1.0 | 70 | 5.8 | 0.20 |
| 2008 | 103,193 | 15.0 | 102,289 | 15.0 | 904 | 14.8 | 0.9 | 196 | 16.2 | 0.19 |
| 2009 | 103,010 | 15.0 | 102,163 | 15.0 | 847 | 13.9 | 0.8 | 189 | 15.6 | 0.18 |
| 2010 | 105,562 | 15.4 | 104,581 | 15.4 | 981 | 16.1 | 0.9 | 187 | 15.4 | 0.18 |
| 2011 | 104,153 | 15.2 | 103,246 | 15.2 | 907 | 14.9 | 0.9 | 169 | 13.9 | 0.16 |
| 2012 | 104,502 | 15.2 | 103,628 | 15.2 | 874 | 14.3 | 0.8 | 155 | 12.8 | 0.15 |
| 2013 | 103,955 | 15.2 | 103,020 | 15.2 | 935 | 15.3 | 0.9 | 187 | 15.4 | 0.18 |
| 2014 | 26,173 | 3.8 | 25,863 | 3.8 | 310 | 5.1 | 1.2 | 59 | 4.9 | 0.23 |
| Season of conception | ||||||||||
| Spring (March–May) | 160,490 | 23.4 | 159,072 | 23.4 | 1,418 | 23.3 | 0.9 | 270 | 22.3 | 0.17 |
| Summer (June–August) | 153,364 | 22.4 | 152,013 | 22.4 | 1,351 | 22.2 | 0.9 | 299 | 24.7 | 0.20 |
| Autumn (September–November) | 185,606 | 27.1 | 183,986 | 27.1 | 1,620 | 26.6 | 0.9 | 319 | 26.3 | 0.20 |
| Winter (December–February) | 186,448 | 27.2 | 184,742 | 27.2 | 1,706 | 28.0 | 0.9 | 324 | 26.7 | 0.20 |
| Maternal age, yearsa | 29.3 (6.2) | 29.2 (6.2) | 29.8 (6.4) | 30.1 (6.6) | ||||||
| <20 | 37,043 | 5.4 | 36,706 | 5.5 | 337 | 5.5 | 0.9 | 66 | 5.4 | 0.18 |
| 20–24 | 133,364 | 19.4 | 132,285 | 19.5 | 1,079 | 17.7 | 0.8 | 211 | 17.4 | 0.16 |
| 25–29 | 180,013 | 26.2 | 178,579 | 26.3 | 1,434 | 23.5 | 0.8 | 286 | 23.6 | 0.16 |
| 30–34 | 189,681 | 27.7 | 187,956 | 27.6 | 1,725 | 28.3 | 0.9 | 316 | 26.1 | 0.17 |
| 35–39 | 112,735 | 16.4 | 111,605 | 16.4 | 1,130 | 18.5 | 1.0 | 240 | 19.8 | 0.21 |
| ≥40 | 33,072 | 4.8 | 32,682 | 4.8 | 390 | 6.4 | 1.2 | 93 | 7.7 | 0.28 |
| Parity | ||||||||||
| 1 | 310,552 | 45.3 | 307,847 | 45.3 | 2,705 | 44.4 | 0.9 | 551 | 45.5 | 0.18 |
| 2 | 204,694 | 29.8 | 203,050 | 29.9 | 1,644 | 27.4 | 0.8 | 324 | 26.7 | 0.16 |
| ≥3 | 170,662 | 24.8 | 168,916 | 24.8 | 1,746 | 28.7 | 1.0 | 337 | 27.8 | 0.20 |
| Race/ethnicity | ||||||||||
| Non-Hispanic White | 206,003 | 30.0 | 204,463 | 30.1 | 1,540 | 25.3 | 0.7 | 327 | 27.0 | 0.16 |
| Non-Hispanic Black | 144,042 | 21.0 | 141,951 | 20.9 | 2,091 | 34.3 | 1.5 | 409 | 33.7 | 0.29 |
| Hispanic | 217,808 | 31.8 | 216,069 | 31.8 | 1,739 | 28.5 | 0.8 | 337 | 27.8 | 0.16 |
| Other | 118,055 | 17.2 | 117,330 | 17.3 | 725 | 11.9 | 0.6 | 139 | 11.5 | 0.12 |
| Education, years | ||||||||||
| ≤8 | 47,653 | 6.9 | 47,284 | 7.0 | 369 | 6.1 | 0.8 | 77 | 6.4 | 0.16 |
| 9–11 | 112,564 | 16.4 | 111,491 | 16.4 | 1,073 | 17.6 | 1.0 | 208 | 17.2 | 0.19 |
| 12 | 160,119 | 23.3 | 158,604 | 23.3 | 1,515 | 24.9 | 0.9 | 299 | 24.7 | 0.19 |
| 13–16 | 271,703 | 39.6 | 269,374 | 39.6 | 2,329 | 38.2 | 0.9 | 458 | 37.8 | 0.17 |
| ≥17 | 91,506 | 13.3 | 90,748 | 13.3 | 758 | 12.4 | 0.8 | 155 | 12.8 | 0.17 |
| Unknown | 2,363 | 0.3 | 2,312 | 0.3 | 51 | 0.8 | 2.2 | 15 | 1.2 | 0.64 |
| Single marital status | 299,654 | 43.7 | 296,561 | 43.6 | 3,093 | 50.7 | 1.0 | 619 | 51.1 | 0.21 |
| Medicaid enrollee | 419,474 | 61.2 | 415,628 | 61.1 | 3,846 | 63.1 | 0.9 | 717 | 59.2 | 0.17 |
| Multiple births | 11,603 | 1.7 | 11,365 | 1.7 | 238 | 3.9 | 2.1 | 45 | 3.7 | 0.39 |
| Stillbirth | 9,504 | 1.4 | 9,331 | 1.4 | 173 | 2.8 | 1.8 | 39 | 3.2 | 0.41 |
| Prepregnancy body mass indexa,b | 25.1 (5.7) | 25.1 (5.7) | 25.3 (5.7) | 25.4 (5.9) | ||||||
| <18.5 | 38,023 | 5.5 | 37,693 | 5.5 | 330 | 5.4 | 0.9 | 62 | 5.1 | 0.16 |
| 18.5–24.9 | 364,595 | 53.2 | 361,536 | 53.2 | 3,059 | 50.2 | 0.8 | 594 | 49.0 | 0.16 |
| 25.0–29.9 | 162,838 | 23.7 | 161,308 | 23.7 | 1,530 | 25.1 | 0.9 | 313 | 25.8 | 0.19 |
| 30.0–34.9 | 71,810 | 10.5 | 71,114 | 10.5 | 696 | 11.4 | 1.0 | 136 | 11.2 | 0.19 |
| ≥35.0 | 42,053 | 6.1 | 41,677 | 6.1 | 376 | 6.2 | 0.9 | 81 | 6.7 | 0.19 |
| Unknown | 6,589 | 1.0 | 6,485 | 1.0 | 104 | 1.7 | 1.6 | 26 | 2.1 | 0.40 |
| Maternal smokingc | 16,233 | 2.4 | 16,011 | 2.4 | 222 | 3.6 | 1.4 | 55 | 4.5 | 0.34 |
| Chronic hypertension | 21,308 | 3.1 | 20,987 | 3.1 | 321 | 5.3 | 1.5 | 66 | 5.4 | 0.31 |
| Gestational hypertension | 18,062 | 2.6 | 17,912 | 2.6 | 150 | 2.5 | 0.8 | 19 | 1.6 | 0.11 |
| Preeclampsia | 28,383 | 4.1 | 27,633 | 4.1 | 750 | 12.3 | 2.6 | 207 | 17.1 | 0.73 |
| Pregestational diabetes | 6,095 | 1.0 | 6,279 | 1.0 | 103 | 1.7 | 1.7 | 21 | 1.7 | 0.34 |
| Gestational diabetes | 37,861 | 5.5 | 37,447 | 5.5 | 414 | 6.8 | 1.1 | 87 | 7.2 | 0.23 |
| Census tract datad | ||||||||||
| % of households below federal poverty level | 18.2 (8.6–30.2) | 18.2 (8.6–30.2) | 19.1 (9.5–29.6) | 18.2 (8.9–29.5) | ||||||
| Annual income, US dollars | 45,417 (32,150–65,595) | 45,417 (32,150–65,595) | 44,375 (31,750–62,070) | 45,714 (32,195–65,313) | ||||||
a Values are expressed as mean (standard deviation).
b Weight (kg)/height (m)2.
c Smoking in the 3 months before pregnancy or during pregnancy.
d Values are expressed as median (interquartile range).
Web Table 2 shows the distributions of PM2.5 and nitrogen dioxide exposure at 1 month prepregnancy and across the trimesters for abruption and nonabruption groups. The association between monthly PM2.5 exposure and rate of abruption is shown in Figure 2. For pregnancies with exposure data covering up to 10 months during pregnancy, the adjusted copollutant association between PM2.5 and abruption was higher at months 7–9. For instance, for exposure to PM2.5 at a concentration of 20 μg/m3 in months 7, 8, and 9, the hazard ratios for abruption were 1.39 (95% confidence interval (CI): 0.96, 2.03), 1.71 (95% CI: 1.01, 2.90), and 2.13 (95% CI: 0.98, 4.61), respectively (Figure 2, Web Table 3). These hazard ratios were considerably stronger for higher levels of exposure to PM2.5. PM2.5 was not associated with abruption for deliveries taking place in earlier months. No associations between nitrogen dioxide exposure and abruption were seen (Figure 3). These associations are consistent with the analysis of average trimester exposure (Table 2).
Figure 2.
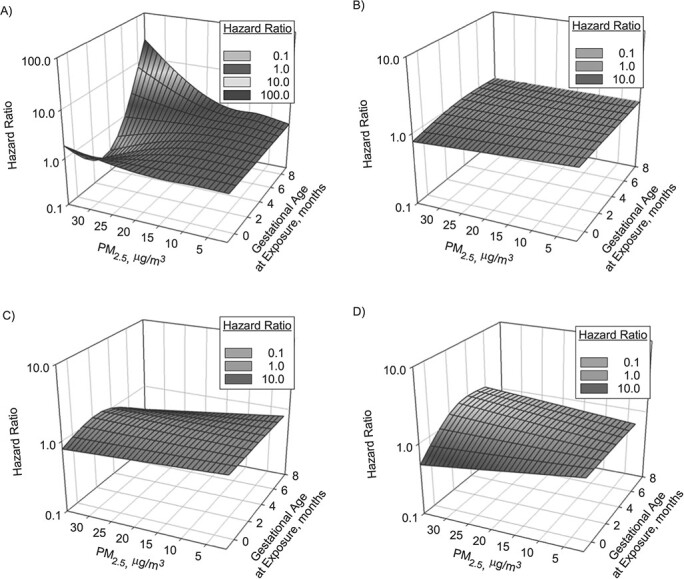
Association between exposure to particulate matter with an aerodynamic diameter ≤2.5 μm (PM2.5) from 1 month before pregnancy to 10 months of pregnancy and rate of placental abruption, by month of delivery, New York, New York, 2008–2014. Adjusted hazard ratios were based on copollutant analysis adjusting for nitrogen dioxide exposure and confounders. A) Pregnancies lasting 10 months (n = 630,808); B) pregnancies lasting 9 months (n = 43,746); C) pregnancies lasting 8 months (n = 6,938); D) pregnancies lasting 7 months (n = 893). Distributed-lag nonlinear models based on marginal Cox proportional hazards regression were developed to account for repeat pregnancies in a given woman based on generalized estimating equations, where we allowed baseline abruption rates to differ according to maternal race/ethnicity and hospital at study entry. PM2.5 exposure was modeled based on 3 degrees of freedom. Hazard ratios were adjusted for year of conception, season of conception, maternal age, maternal age squared, parity, education, smoking 3 months prior to conception or during pregnancy, prepregnancy body mass index (weight (kg)/height (m)2), body mass index squared, marital status, Medicaid enrollment, multiple births, percentage of households below the federal poverty level, percentage of households below the poverty level squared, median annual income, and median income squared.
Figure 3.

Association between nitrogen dioxide exposure from 1 month before pregnancy to 10 months of pregnancy and rate of placental abruption, by month of delivery, New York, New York, 2008–2014. Adjusted hazard ratios (circles) and 95% confidence intervals (bars) for placental abruption were based on a 6–parts per billion increase in nitrogen dioxide exposure, derived from a copollutant analysis adjusting for PM2.5 exposure and confounders. A) Pregnancies lasting 10 months (n = 630,808); B) pregnancies lasting 9 months (n = 43,746); C) pregnancies lasting 8 months (n = 6,938); D) pregnancies lasting 7 months (n = 893). Distributed-lag nonlinear models based on marginal Cox proportional hazards regression were developed to account for repeat pregnancies in a given woman based on generalized estimating equations, where we allowed baseline abruption rates to differ according to maternal race/ethnicity and hospital at study entry. Hazard ratios were adjusted for year of conception, season of conception, maternal age, maternal age squared, parity, education, smoking 3 months prior to conception or during pregnancy, prepregnancy body mass index (weight (kg)/height (m)2), body mass index squared, marital status, Medicaid enrollment, multiple births, percentage of households below the federal poverty level, percentage of households below the poverty level squared, median annual income, and median income squared.
Table 2.
Associations of Exposure to PM2.5 and Nitrogen Dioxide With Risk of Placental Abruption During the Month Before Conception and in Each Trimester of Pregnancya Among Singleton Pregnancies (Copollutant Model With Exposure Data Categorized as <75th, 75th–94th, and ≥95th Percentiles), New York, New York, 2008–2014
| PM 2.5 , μg/m 3 | Nitrogen Dioxide, ppb | ||||||||||
|---|---|---|---|---|---|---|---|---|---|---|---|
|
Level of
Exposure |
Total No.
of Births |
Placental Abruption b |
Adjusted
HR c , d |
95% CI |
Level of
Exposure |
Total No.
of Births |
Placental Abruption b | Adjusted HR c , d | 95% CI | ||
| No. of Cases | % | No. of Cases | % | ||||||||
| 1 Month Before Conception | |||||||||||
| <12 | 477,103 | 3,935 | 0.82 | 1.00 | Referent | <26 | 469,832 | 3,910 | 0.83 | 1.00 | Referent |
| 12–14 | 161,512 | 1,341 | 0.83 | 0.99 | 0.91, 1.07 | 26–29 | 145,094 | 1,176 | 0.81 | 0.90 | 0.83, 0.98 |
| ≥15 | 43,770 | 371 | 0.85 | 0.98 | 0.86, 1.13 | ≥30 | 67,459 | 561 | 0.83 | 0.95 | 0.83, 1.08 |
| First Trimester | |||||||||||
| <12 | 499,974 | 4,167 | 0.83 | 1.00 | Referent | <26 | 478,899 | 3,922 | 0.82 | 1.00 | Referent |
| 12–14 | 165,033 | 1,349 | 0.82 | 0.92 | 0.85, 1.00 | 26–29 | 147,930 | 1,296 | 0.88 | 1.11 | 1.02, 1.20 |
| ≥15 | 17,378 | 131 | 0.76 | 0.77 | 0.63, 0.94 | ≥30 | 55,556 | 429 | 0.77 | 1.06 | 0.96, 1.24 |
| Second Trimester | |||||||||||
| <12 | 530,618 | 4,372 | 0.82 | 1.00 | Referent | <26 | 504,402 | 4,207 | 0.83 | 1.00 | Referent |
| 12–14 | 142,711 | 1,201 | 0.84 | 1.05 | 0.97, 1.15 | 26–29 | 132,320 | 1,089 | 0.82 | 0.97 | 0.89, 1.06 |
| ≥15 | 9,056 | 74 | 0.82 | 1.11 | 0.86, 1.44 | ≥30 | 45,663 | 351 | 0.77 | 0.86 | 0.74, 1.01 |
| Third Trimester | |||||||||||
| <12 | 534,646 | 4,407 | 0.82 | 1.00 | Referent | <26 | 517,825 | 4,298 | 0.83 | 1.00 | Referent |
| 12–14 | 128,589 | 1,024 | 0.80 | 1.03 | 0.94, 1.13 | 26–29 | 121,508 | 985 | 0.81 | 1.00 | 0.92, 1.09 |
| ≥15 | 19,150 | 216 | 1.11 | 1.68 | 1.41, 2.00 | ≥30 | 43,052 | 364 | 0.85 | 1.05 | 0.91, 1.22 |
Abbreviations: CI, confidence interval; HR, hazard ratio; PM2.5, particulate matter with an aerodynamic diameter ≤2.5 μm; ppb, parts per billion.
a Analyses pertained to women with data on exposure in all 3 trimesters (682,385 total births; placental abruption rate = 0.83%).
b Placental abruption was based on recorded diagnoses in birth records or hospitalizationdata.
c A marginal Cox proportional hazards model was fitted to account for repeat pregnancies to a given woman using generalized estimating equations where we allowed baseline abruption rates to differ according to maternal race/ethnicity and hospital at study entry.
d Hazard ratios were adjusted for year of conception, season of conception, maternal age, maternal age squared, parity, education, smoking 3 months prior to conception or during pregnancy, prepregnancy body mass index (weight (kg)/height (m)2), body mass index squared, marital status, Medicaid enrollment, plurality, percentage of households below the federal poverty level, percentage of households below the poverty level squared, median annual income, and median income squared.
We examined the associations of trimester-specific PM2.5 and nitrogen dioxide exposure and abruption (Table 2). With available exposure data ranging between 1 month prepregnancy and all 3 trimesters of pregnancy, compared with PM2.5 less than 12 μg/m3, exposure to PM2.5 at levels of 12–14 μg/m3 and ≥15 μg/m3 in the first trimester were associated with decreased rates of abruption, whereas exposure to PM2.5 ≥15 μg/m3 in the third trimester was associated with an increased rate of abruption. In the second trimester, compared with women with PM2.5 exposure less than 12 μg/m3, abruption rates were increased with PM2.5 exposures of 12–14 μg/m3 (hazard ratio (HR) = 1.05, 95% CI: 0.97, 1.15) and ≥15 μg/m3 (HR = 1.11, 95% CI: 0.86, 1.44). In contrast, compared with nitrogen dioxide exposure less than 26 ppb, abruption rates were increased with nitrogen dioxide exposures of 26–29 ppb (HR = 1.11, 95% CI: 1.02, 1.20) and ≥30 ppb (HR = 1.06, 95% CI: 0.96, 1.24) in the first trimester.
We examined the joint association of exposure to both PM2.5 and nitrogen dioxide at concentrations ≥95th percentile and abruption (Table 3). Compared with exposure to both PM2.5 and nitrogen dioxide at <95th percentile (referent), the rate of abruption was decreased with both PM2.5 and nitrogen dioxide exposures ≥95th percentile in the first trimester and was increased with PM2.5 exposure ≥95th percentile with nitrogen dioxide either <95th percentile or ≥95th percentile in the third trimester. However, these associations showed no evidence of interactions on an additive scale.
Table 3.
Association of Joint Exposure to PM2.5 and Nitrogen Dioxide (Based on 95th Percentile Cutoffsa) With Risk of Placental Abruption Among Women With Exposure Data on 3 Trimesters of Pregnancyb, New York, New York, 2008–2014
| Placental Abruption c |
Adjusted
Hazard Ratio d , e |
95% Confidence
Interval |
|||
|---|---|---|---|---|---|
|
Joint Exposure to PM
2.5
and Nitrogen Dioxide |
Total No.
of Births |
No. of Cases | % | ||
| 1 Month Before Conception | |||||
| PM2.5 <95th and NO2 <95th | 618,099 | 5,161 | 0.83 | 1.00 | Referent |
| PM2.5 ≥95th and NO2 <95th | 24,762 | 209 | 0.84 | 0.93 | 0.80, 1.09 |
| PM2.5 <95th and NO2 ≥95th | 24,733 | 200 | 0.80 | 1.04 | 0.89, 1.23 |
| PM2.5 ≥95th and NO2 ≥95th | 9,144 | 77 | 0.84 | 1.11 | 0.87, 1.41 |
| Excess risk due to interactionf | 0.13 | −0.41, 0.67 | |||
| First Trimester | |||||
| PM2.5 <95th and NO2 <95th | 619,738 | 5,212 | 0.83 | 1.00 | Referent |
| PM2.5 ≥95th and NO2 <95th | 23,204 | 186 | 0.80 | 0.86 | 0.73, 1.01 |
| PM2.5 <95th and NO2 ≥95th | 23,070 | 177 | 0.76 | 0.90 | 0.76, 1.07 |
| PM2.5 ≥95th and NO2 ≥95th | 10,726 | 72 | 0.67 | 0.73 | 0.57, 0.94 |
| Excess risk due to interactionf | −0.03 | −0.28, 0.23 | |||
| Second Trimester | |||||
| PM2.5 <95th and NO2 <95th | 619,805 | 5,179 | 0.83 | 1.00 | Referent |
| PM2.5 ≥95th and NO2 <95th | 23,015 | 218 | 0.94 | 1.17 | 1.01, 1.35 |
| PM2.5 <95th and NO2 ≥95th | 23,110 | 178 | 0.76 | 0.95 | 0.80, 1.12 |
| PM2.5 ≥95th and NO2 ≥95th | 10,808 | 72 | 0.66 | 0.82 | 0.63, 1.05 |
| Excess risk due to interactionf | −0.30 | −0.59, 0.01 | |||
| Third Trimester | |||||
| PM2.5 <95th and NO2 <95th | 618,624 | 5,112 | 0.82 | 1.00 | Referent |
| PM2.5 ≥95th and NO2 <95th | 24,297 | 253 | 1.03 | 1.43 | 1.23, 1.66 |
| PM2.5 <95th and NO2 ≥95th | 24,396 | 188 | 0.76 | 1.00 | 0.85, 1.18 |
| PM2.5 ≥95th and NO2 ≥95th | 9,421 | 94 | 0.99 | 1.44 | 1.15, 1.80 |
| Excess risk due to interactionf | 0.01 | −0.39, 0.42 | |||
Abbreviations: NO2, nitrogen dioxide; PM2.5, particulate matter with an aerodynamic diameter ≤2.5 μm.
a The 95th percentile cutoffs for PM2.5 and NO2 were derived from the nonabruption births shown in Web Table 2.
b Analyses pertained to women with exposure data in 3 trimesters (682,385 total births; placental abruption rate, 0.83%).
c Abruption was based on recorded diagnoses in birth records or hospitalizationdata.
d A marginal Cox proportional hazards model was fitted to account for repeat pregnancies to a given woman using generalized estimating equations where we allowed baseline abruption rates to differ according to race and individual hospital at study entry.
e Hazard ratios were adjusted for year of conception, season of conception, maternal age, maternal age squared, parity, education, smoking 3 months prior to conception or during pregnancy, prepregnancy body mass index (weight (kg)/height (m)2), body mass index squared, marital status, Medicaid enrollment, multiple births, percentage of households below the federal poverty level, percentage of households below the poverty level squared, median annual income, and median income squared.
f Values are expressed as relative excess risk due to interaction.
Sensitivity analyses
We conducted a sensitivity analysis by identifying the abruption cases based on both birth certificates and hospitalization records in order to improve the specificity of abruption diagnosis (Web Table 4). We found that restricting the analysis to highly confirmative abruption cases yielded stronger associations between exposure to high levels of PM2.5 and nitrogen dioxide and placental abruption.
The rates of abruption among women with consistently high exposures to PM2.5 between 1 month preconception and through all 3 trimesters at the 95th percentile or higher versus less than the 95th percentile were 1.26% and 0.83%, respectively (HR = 1.74, 95% CI 1.06, 2.84; Web Table 5). No such associations were evident for consistently high exposure to nitrogen dioxide. In an analysis restricted to singleton births, the associations of PM2.5 and nitrogen dioxide with abruption (Web Table 6) were very similar to those in the overall analyses.
DISCUSSION
This large cohort study of births in NYC showed 3 important findings. First, exposures to high levels of PM2.5 in the third trimester and high levels of nitrogen dioxide in the first trimester were associated with increased rates of abruption (Table 2). Second, exposure to high levels of PM2.5 in the first trimester was associated with slightly reduced rates of abruption. Third, a higher risk of abruption was seen among women with consistently high exposure to PM2.5 ≥95th percentile (but not nitrogen dioxide) between 1 month preconception and the third trimester in comparison with women with consistently low exposure to PM2.5 (all exposure windows <95th percentile; Web Table 4). These findings, coupled with those of previous studies (34, 48, 49), suggest that air pollution exposures incurred several months before delivery may be associated with an increased rate of placental abruption.
Strengths of the study
The large cohort of NYC births allowed precise estimation of associations. Second, women who deliver in NYC are very socioeconomically and racially diverse, and this enhances the generalizability of our findings. Third, exposure assignment was based on state-of-the-art prediction models with high spatial resolution. Fourth, the replication of findings based on 2 measures of abruption diagnosis (birth records or hospital discharge records vs. both sources) underscores that the associations were robust to the source of information used to define abruption.
Limitations of the data
First, we recognize the potential for error in the measurement of exposures to both PM2.5 and nitrogen dioxide (50), since exposure assignment was based on the location of residence recorded at the time of delivery; we did not have data on daily activity patterns or on time spent away from the home. We speculate that any bias was probably nondifferential, since we do not believe that this error would have differed for abruption births and nonabruption births. Second, potential exposure misclassification due to maternal residential mobility during pregnancy (residing in NYC but working outside the city or vice versa) or the birth address differing from the early-pregnancy address is likely to have affected the associations to some extent. Only residential address was available at delivery, which may have introduced additional exposure measurement error (51). Third, there is a potential for misclassification of abruption diagnosis on birth records. However, since we based the abruption diagnosis on either birth records or the linked hospitalization records (which results in improved sensitivity when validated against medical record abstraction (52)), we anticipate that the misclassification would be small. The sensitivity analysis restricted to abruptions recorded in both birth and hospitalization records (to improve the specificity) yielded stronger associations between exposure to high levels of PM2.5 and abruption. Fourth, the potential for the associations being affected by unmeasured confounding, particularly measures of socioeconomic status not considered in this study (53), cannot be overlooked.
Interpretation
Studies have documented increased risks of hypertensive disorders (6–8), gestational diabetes (54, 55), stillbirth (56, 57), small-for-gestational-age birth (58), and preterm delivery (59–61) among women exposed to increased levels of air pollutants, particularly PM2.5 and nitrogen dioxide (62–64). We initially hypothesized that increased exposure to PM2.5 and nitrogen dioxide during the month before conception or early in pregnancy would predispose women to abruption. This hypothesis was posited on the premise that abruption can be characterized as an obstetrical complication with defective placental implantation, a process whose origins extend to very early stages of pregnancy. The pathophysiological mechanisms for abruption include uteroplacental ischemia, decidual vasculopathy, inflammation, and oxidative stress (11, 65), all of which are also associated with increased exposure to air pollution (60).
Women exposed to PM2.5 at concentrations ≥15 μg/m3 in the third trimester and those exposed to PM2.5 ≥95th percentile were at increased risk of abruption, independent of nitrogen dioxide levels. The only other study that examined PM2.5 in relation to abruption found no evidence of an association (49). There are some data to support a biologically plausible association between particulate matter and abruption. In a study on the Generation R cohort, van den Hooven et al. (2) reported that PM10 (and nitrogen dioxide) exposures averaged over total pregnancy were associated with higher soluble fms-like tyrosine kinase 1 and lower placental growth factor levels in fetal umbilical cord blood, which is consistent with an anti-angiogenic state and is a phenomenon associated with increased risk of abruption (66).
The increased rate of abruption among women exposed to high levels of PM2.5 in the third trimester is biologically plausible (67, 68). There is some evidence that exposure to particulate matter is associated with increased risk of premature rupture of the membranes (69, 70), which, in turn, is a strong risk factor for placental abruption (67, 68). The association between nitrogen dioxide in the first and third trimesters and abruption is weak, but it may suggest that nitrogen dioxide exposure may be important for both defective placental implantation and premature placental separation. The associations between third-trimester exposures to PM2.5 and nitrogen dioxide and abruption are also supported by similar findings in case-crossover studies (34, 48). The observed protective effect of first-trimester PM2.5 exposure against abruption in our study may have been a consequence of apparent left-truncation bias (71–73). Entry into the cohort was restricted to deliveries occurring at ≥20 weeks’ gestation, so earlier losses, arguably attributable to air pollution (71, 74) and/or abruption (23, 75–78), may have been selectively excluded.
Conclusions
This study of over 685,000 births in NYC showed that exposure to high levels of PM2.5 in the third trimester and nitrogen dioxide in the first trimester were associated with increased rates of abruption. These findings, coupled with prior research on air pollution exposures a few days prior to delivery (34, 48), underscore that these exposures may be implicated as important environmental triggers of premature placental separation through different pathways (10).
Supplementary Material
ACKNOWLEDGMENTS
Author affiliations: Department of Obstetrics and Gynecology, Vagelos College of Physicians and Surgeons, Columbia University, New York, New York, United States (Yongmei Huang, Alexander M. Friedman, Ronald J. Wapner); Department of Environmental Health Sciences, Joseph L. Mailman School of Public Health, Columbia University, New York, New York, United States (Marianthi-Anna Kioumourtzoglou); Department of Epidemiology, Harvard T.H. Chan School of Public Health, Boston, Massachusetts, United States (Murray A. Mittleman, Michelle A. Williams, Joel Schwartz); ZevRoss Spatial Analysis, Ithaca, New York, United States (Zev Ross); Department of Environmental Health, Harvard T.H. Chan School of Public Health, Boston, Massachusetts, United States (Joel Schwartz); Division of Epidemiology and Biostatistics, Department of Obstetrics, Gynecology, and Reproductive Sciences, Robert Wood Johnson Medical School, Rutgers University, New Brunswick, New Jersey, United States (Cande V. Ananth); Environmental and Occupational Health Sciences Institute, Robert Wood Johnson Medical School, Rutgers University, Piscataway, New Jersey, United States (Cande V. Ananth); Cardiovascular Institute of New Jersey, Robert Wood Johnson Medical School, Rutgers University, New Brunswick, New Jersey, United States (Cande V. Ananth); and Department of Biostatistics and Epidemiology, School of Public Health, Rutgers University, Piscataway, New Jersey, United States (Cande V. Ananth).
This project was funded by grant ES025845 (to C.V.A.) from the National Institute of Environmental Health Sciences (NIEHS), National Institutes of Health. M.A.K. was partially supported by grant R01 ES029943 from the NIEHS and partially supported by NIEHS Center Development Grant P30-ES009089. J.S. was supported by grant RD-83587201 from the Environmental Protection Agency.
We acknowledge the thoughtful suggestions of Drs. Antonio Gasparrini (London School of Hygiene and Tropical Medicine, London, United Kingdom), Ander Wilson (Colorado State University, Fort Collins, Colorado), and Andreas Neophytou (Colorado State University) regarding distributed-lag models.
Conflict of interest: none declared.
REFERENCES
- 1. Shah PS, Balkhair T, Knowledge Synthesis Group on Determinants of Preterm/LBW Births . Air pollution and birth outcomes: a systematic review. Environ Int. 2011;37(2):498–516. [DOI] [PubMed] [Google Scholar]
- 2. Hooven EH, Pierik FH, Kluizenaar Y, et al. Air pollution exposure during pregnancy, ultrasound measures of fetal growth, and adverse birth outcomes: a prospective cohort study. Environ Health Perspect. 2012;120(1):150–156. [DOI] [PMC free article] [PubMed] [Google Scholar]
- 3. Nieuwenhuijsen MJ, Dadvand P, Grellier J, et al. Environmental risk factors of pregnancy outcomes: a summary of recent meta-analyses of epidemiological studies. Environ Health. 2013;12:Article 6. [DOI] [PMC free article] [PubMed] [Google Scholar]
- 4. Pereira G, Bracken MB, Bell ML. Particulate air pollution, fetal growth and gestational length: the influence of residential mobility in pregnancy. Environ Res. 2016;147:269–274. [DOI] [PMC free article] [PubMed] [Google Scholar]
- 5. Mendola P, Ha S, Pollack AZ, et al. Chronic and acute ozone exposure in the week prior to delivery is associated with the risk of stillbirth. Int J Environ Res Public Health. 2017;14(7):Article 731. [DOI] [PMC free article] [PubMed] [Google Scholar]
- 6. Savitz DA, Elston B, Bobb JF, et al. Ambient fine particulate matter, nitrogen dioxide, and hypertensive disorders of pregnancy in New York City. Epidemiology. 2015;26(5):748–757. [DOI] [PMC free article] [PubMed] [Google Scholar]
- 7. Malmqvist E, Jakobsson K, Tinnerberg H, et al. Gestational diabetes and preeclampsia in association with air pollution at levels below current air quality guidelines. Environ Health Perspect. 2013;121(4):488–493. [DOI] [PMC free article] [PubMed] [Google Scholar]
- 8. Dadvand P, Figueras F, Basagana X, et al. Ambient air pollution and preeclampsia: a spatiotemporal analysis. Environ Health Perspect. 2013;121(11-12):1365–1371. [DOI] [PMC free article] [PubMed] [Google Scholar]
- 9. Ananth CV, Wilcox AJ. Placental abruption and perinatal mortality in the United States. Am J Epidemiol. 2001;153(4):332–337. [DOI] [PubMed] [Google Scholar]
- 10. Ananth CV. Ischemic placental disease: a unifying concept for preeclampsia, intrauterine growth restriction, and placental abruption. Semin Perinatol. 2014;38(3):131–132. [DOI] [PubMed] [Google Scholar]
- 11. Roberts JM. Pathophysiology of ischemic placental disease. Semin Perinatol. 2014;38(3):139–145. [DOI] [PMC free article] [PubMed] [Google Scholar]
- 12. Hoogendoorn B, Berube K, Gregory C, et al. Gene and protein responses of human lung tissue explants exposed to ambient particulate matter of different sizes. Inhal Toxicol. 2012;24(14):966–975. [DOI] [PubMed] [Google Scholar]
- 13. Burton GJ, Jauniaux E. Oxidative stress. Best Pract Res Clin Obstet Gynaecol. 2011;25(3):287–299. [DOI] [PMC free article] [PubMed] [Google Scholar]
- 14. Arroyo V, Díaz J, Carmona R, et al. Impact of air pollution and temperature on adverse birth outcomes: Madrid, 2001–2009. Environ Pollut. 2016;218:1154–1161. [DOI] [PubMed] [Google Scholar]
- 15. Risom L, Møller P, Loft S. Oxidative stress-induced DNA damage by particulate air pollution. Mutat Res. 2005;592(1-2):119–137. [DOI] [PubMed] [Google Scholar]
- 16. Li W, Nyhan MM, Wilker EH, et al. Recent exposure to particle radioactivity and biomarkers of oxidative stress and inflammation: the Framingham Heart Study. Environ Int. 2018;121(2):1210–1216. [DOI] [PMC free article] [PubMed] [Google Scholar]
- 17. Ananth CV, Kinzler WL. Placental abruption: pathophysiology, clinical features, diagnosis, and consequences. https://www.uptodate.com/contents/placental-abruption-pathophysiology-clinical-features-diagnosis-and-consequences?sectionName=DIFFERENTIAL%20DIAGNOSIS&topicRef=5439&anchor=H23230079&source=see_link. (Literature review current through February 2021. Topic last updated February 22, 2021). Accessed February 27, 2021.
- 18. Oyelese Y, Ananth CV. Placental abruption. Obstet Gynecol. 2006;108(4):1005–1016. [DOI] [PubMed] [Google Scholar]
- 19. Downes KL, Grantz KL, Shenassa ED. Maternal, labor, delivery, and perinatal outcomes associated with placental abruption: a systematic review. Am J Perinatol. 2017;34(10):935–957. [DOI] [PMC free article] [PubMed] [Google Scholar]
- 20. Ananth CV, Skjaerven R, Klunssoyr K. Change in paternity, risk of placental abruption and confounding by birth interval: a population-based prospective cohort study in Norway, 1967–2009. BMJ Open. 2015;5(2):e007023. [DOI] [PMC free article] [PubMed] [Google Scholar]
- 21. Tikkanen M. Placental abruption: epidemiology, risk factors and consequences. Acta Obstet Gynecol Scand. 2011;90(2):140–149. [DOI] [PubMed] [Google Scholar]
- 22. Tikkanen M, Nuutila M, Hiilesmaa V, et al. Prepregnancy risk factors for placental abruption. Acta Obstet Gynecol Scand. 2006;85(1):40–44. [DOI] [PubMed] [Google Scholar]
- 23. Downes KL, Shenassa ED, Grantz KL. Neonatal outcomes associated with placental abruption. Am J Epidemiol. 2017;186(12):1319–1328. [DOI] [PMC free article] [PubMed] [Google Scholar]
- 24. Ananth CV, Friedman AM, Lavery JA, et al. Neurodevelopmental outcomes in children in relation to placental abruption. BJOG. 2017;124(3):463–472. [DOI] [PubMed] [Google Scholar]
- 25. Ananth CV, Friedman AM. Ischemic placental disease and risks of perinatal mortality and morbidity and neurodevelopmental outcomes. Semin Perinatol. 2014;38(3):151–158. [DOI] [PubMed] [Google Scholar]
- 26. Ananth CV, Hansen AV, Elkind MSV, et al. Cerebrovascular disease after placental abruption: a population-based prospective cohort study. Neurology. 2019;93(12):e1148–e1158. [DOI] [PubMed] [Google Scholar]
- 27. Ananth CV, Hansen AV, Williams MA, et al. Cardiovascular disease in relation to placental abruption: a population-based cohort study from Denmark. Paediatr Perinat Epidemiol. 2017;31(3):209–218. [DOI] [PubMed] [Google Scholar]
- 28. Cain MA, Salemi JL, Tanner JP, et al. Pregnancy as a window to future health: maternal placental syndromes and short-term cardiovascular outcomes. Am J Obstet Gynecol. 2016;215(4):484e1–484.e14. [DOI] [PubMed] [Google Scholar]
- 29. DeRoo L, Skjærven R, Wilcox A, et al. Placental abruption and long-term maternal cardiovascular disease mortality: a population-based registry study in Norway and Sweden. Eur J Epidemiol. 2016;31(5):501–511. [DOI] [PMC free article] [PubMed] [Google Scholar]
- 30. Pariente G, Shoham-Vardi I, Kessous R, et al. Placental abruption as a significant risk factor for long-term cardiovascular mortality in a follow-up period of more than a decade. Paediatr Perinat Epidemiol. 2014;28(1):32–38. [DOI] [PubMed] [Google Scholar]
- 31. Pariente G, Wainstock T, Walfisch A, et al. Placental abruption and long-term neurological hospitalisations in the offspring. Paediatr Perinat Epidemiol. 2019;33(3):215–222. [DOI] [PubMed] [Google Scholar]
- 32. Ray JG, Vermeulen MJ, Schull MJ, et al. Cardiovascular Health After Maternal Placental Syndromes (CHAMPS): population-based retrospective cohort study. Lancet. 2005;366(9499):1797–1803. [DOI] [PubMed] [Google Scholar]
- 33. Grandi SM, Filion KB, Yoon S, et al. Cardiovascular disease-related morbidity and mortality in women with a history of pregnancy complications. Circulation. 2019;139(8):1069–1079. [DOI] [PubMed] [Google Scholar]
- 34. Ananth CV, Kioumourtzoglou MA, Huang Y, et al. Exposures to air pollution and risk of acute-onset placental abruption: a case-crossover study. Epidemiology. 2018;29(5):631–638. [DOI] [PMC free article] [PubMed] [Google Scholar]
- 35. New York State Department of Health . Statewide Planning and Research Cooperative System (SPARCS). https://www.health.ny.gov/statistics/sparcs/. Published 2007.Accessed February 4, 2015.
- 36. Environmental Protection Agency . Pre-generated data files. https://aqs.epa.gov/aqsweb/airdata/download_files.html. Accessed June 1, 2016.
- 37. Gasparrini A. Modeling exposure-lag-response associations with distributed lag non-linear models. Stat Med. 2014;33(5):881–899. [DOI] [PMC free article] [PubMed] [Google Scholar]
- 38. Gasparrini A, Scheipl F, Armstrong B, et al. A penalized framework for distributed lag non-linear models. Biometrics. 2017;73(3):938–948. [DOI] [PubMed] [Google Scholar]
- 39. Weisskopf MG, Kioumourtzoglou MA, Roberts AL. Air pollution and autism spectrum disorders: causal or confounded? Curr Environ Health Rep. 2015;2(4):430–439. [DOI] [PMC free article] [PubMed] [Google Scholar]
- 40. Weisskopf MG, Tchetgen Tchetgen EJ, Raz R. Commentary: on the use of imperfect negative control exposures in epidemiologic studies. Epidemiology. 2016;27(3):365–367. [DOI] [PMC free article] [PubMed] [Google Scholar]
- 41. Chang HH, Reich BJ, Miranda ML. Time-to-event analysis of fine particle air pollution and preterm birth: results from North Carolina, 2001–2005. Am J Epidemiol. 2012;175(2):91–98. [DOI] [PubMed] [Google Scholar]
- 42. Mitchell EM, Hinkle SN, Schisterman EF. It’s about time: a survival approach to gestational weight gain and preterm delivery. Epidemiology. 2016;27(2):182–187. [DOI] [PMC free article] [PubMed] [Google Scholar]
- 43. Gasparrini A, Armstrong B, Kenward MG. Distributed lag non-linear models. Stat Med. 2010;29(21):2224–2234. [DOI] [PMC free article] [PubMed] [Google Scholar]
- 44. Gasparrini A, Leone M. Attributable risk from distributed lag models. BMC Med Res Methodol. 2014;14:Article 55. [DOI] [PMC free article] [PubMed] [Google Scholar]
- 45. Wagenmakers EJ, Farrell S. AIC model selection using Akaike weights. Psychon Bull Rev. 2004;11(1):192–196. [DOI] [PubMed] [Google Scholar]
- 46. Knol MJ, VanderWeele TJ, Groenwold RH, et al. Estimating measures of interaction on an additive scale for preventive exposures. Eur J Epidemiol. 2011;26(6):433–438. [DOI] [PMC free article] [PubMed] [Google Scholar]
- 47. Gasparrini A. Distributed lag linear and non-linear models in R: the package dlnm. J Stat Softw. 2011;43(8):1–20. [PMC free article] [PubMed] [Google Scholar]
- 48. Michikawa T, Morokuma S, Yamazaki S, et al. Air pollutant exposure within a few days of delivery and placental abruption in Japan. Epidemiology. 2017;28(2):190–196. [DOI] [PubMed] [Google Scholar]
- 49. Ibrahimou B, Albatineh AN, Salihu HM, et al. Ambient PM2.5 aluminum and elemental carbon and placental abruption morbidity. J Occup Environ Med. 2017;59(2):148–153. [DOI] [PubMed] [Google Scholar]
- 50. Kioumourtzoglou MA, Spiegelman D, Szpiro AA, et al. Exposure measurement error in PM2.5 health effects studies: a pooled analysis of eight personal exposure validation studies. Environ Health. 2014;13(1):Article 2. [DOI] [PMC free article] [PubMed] [Google Scholar]
- 51. Bell ML, Belanger K. Review of research on residential mobility during pregnancy: consequences for assessment of prenatal environmental exposures. J Expo Sci Environ Epidemiol. 2012;22(5):429–438. [DOI] [PMC free article] [PubMed] [Google Scholar]
- 52. Yasmeen S, Romano PS, Schembri ME, et al. Accuracy of obstetric diagnoses and procedures in hospital discharge data. Am J Obstet Gynecol. 2006;194(4):992–1001. [DOI] [PubMed] [Google Scholar]
- 53. Shmool JLC, Kinnee E, Sheffield PE, et al. Spatio-temporal ozone variation in a case-crossover analysis of childhood asthma hospital visits in New York City. Environ Res. 2016;147:108–114. [DOI] [PMC free article] [PubMed] [Google Scholar]
- 54. Fleisch AF, Kloog I, Luttmann-Gibson H, et al. Air pollution exposure and gestational diabetes mellitus among pregnant women in Massachusetts: a cohort study. Environ Health. 2016;15:Article 40. [DOI] [PMC free article] [PubMed] [Google Scholar]
- 55. Robledo CA, Mendola P, Yeung E, et al. Preconception and early pregnancy air pollution exposures and risk of gestational diabetes mellitus. Environ Res. 2015;137:316–322. [DOI] [PMC free article] [PubMed] [Google Scholar]
- 56. Faiz AS, Rhoads GG, Demissie K, et al. Ambient air pollution and the risk of stillbirth. Am J Epidemiol. 2012;176(4):308–316. [DOI] [PMC free article] [PubMed] [Google Scholar]
- 57. Pereira LA, Loomis D, Conceição GM, et al. Association between air pollution and intrauterine mortality in Sao Paulo, Brazil. Environ Health Perspect. 1998;106(6):325–329. [DOI] [PMC free article] [PubMed] [Google Scholar]
- 58. Rich DQ, Demissie K, Lu SE, et al. Ambient air pollutant concentrations during pregnancy and the risk of fetal growth restriction. J Epidemiol Community Health. 2009;63(6):488–496. [DOI] [PMC free article] [PubMed] [Google Scholar]
- 59. Bell ML, Ebisu K, Belanger K. Ambient air pollution and low birth weight in Connecticut and Massachusetts. Environ Health Perspect. 2007;115(7):1118–1124. [DOI] [PMC free article] [PubMed] [Google Scholar]
- 60. van den HoovenEH, Pierik FH, Kluizenaar Y, et al. Air pollution exposure and markers of placental growth and function: the Generation R Study. Environ Health Perspect. 2012;120(12):1753–1759. [DOI] [PMC free article] [PubMed] [Google Scholar]
- 61. Woodruff TJ, Darrow LA, Parker JD. Air pollution and postneonatal infant mortality in the United States, 1999–2002. Environ Health Perspect. 2008;116(1): 110–115. [DOI] [PMC free article] [PubMed] [Google Scholar]
- 62. Woodruff TJ, Parker JD, Kyle AD, et al. Disparities in exposure to air pollution during pregnancy. Environ Health Perspect. 2003;111(7):942–946. [DOI] [PMC free article] [PubMed] [Google Scholar]
- 63. Ritz B, Wilhelm M, Hoggatt KJ, et al. Ambient air pollution and preterm birth in the Environment and Pregnancy Outcomes Study at the University of California, Los Angeles. Am J Epidemiol. 2007;166(9):1045–1052. [DOI] [PubMed] [Google Scholar]
- 64. Stieb DM, Chen L, Hystad P, et al. A national study of the association between traffic-related air pollution and adverse pregnancy outcomes in Canada, 1999–2008. Environ Res. 2016;148:513–526. [DOI] [PubMed] [Google Scholar]
- 65. Rasmussen S, Irgens LM, Dalaker K. A history of placental dysfunction and risk of placental abruption. Paediatr Perinat Epidemiol. 1999;13(1):9–21. [DOI] [PubMed] [Google Scholar]
- 66. Signore C, Mills JL, Qian C, et al. Circulating angiogenic factors and placental abruption. Obstet Gynecol. 2006;108(2):338–344. [DOI] [PubMed] [Google Scholar]
- 67. Ananth CV, Oyelese Y, Srinivas N, et al. Preterm premature rupture of membranes, intrauterine infection, and oligohydramnios: risk factors for placental abruption. Obstet Gynecol. 2004;104(1):71–77. [DOI] [PubMed] [Google Scholar]
- 68. Ananth CV, Oyelese Y, Yeo L, et al. Placental abruption in the United States, 1979 through 2001: temporal trends and potential determinants. Am J Obstet Gynecol. 2005;192(1):191–198. [DOI] [PubMed] [Google Scholar]
- 69. Wallace ME, Grantz KL, Liu D, et al. Exposure to ambient air pollution and premature rupture of membranes. Am J Epidemiol. 2016;183(12):1114–1121. [DOI] [PMC free article] [PubMed] [Google Scholar]
- 70. Dadvand P, Basagaña X, Figueras F, et al. Air pollution and preterm premature rupture of membranes: a spatiotemporal analysis. Am J Epidemiol. 2014;179(2):200–207. [DOI] [PubMed] [Google Scholar]
- 71. Raz R, Kioumourtzoglou MA, Weisskopf MG. Live-birth bias and observed associations between air pollution and autism. Am J Epidemiol. 2018;187(11):2292–2296. [DOI] [PMC free article] [PubMed] [Google Scholar]
- 72. Lisonkova S, Joseph KS. Left truncation bias as a potential explanation for the protective effect of smoking on preeclampsias. Epidemiology. 2015;26(3):436–440. [DOI] [PMC free article] [PubMed] [Google Scholar]
- 73. Schisterman EF, Cole SR, Ye A, et al. Accuracy loss due to selection bias in cohort studies with left truncation. Paediatr Perinat Epidemiol. 2013;27(5):491–502. [DOI] [PMC free article] [PubMed] [Google Scholar]
- 74. Kioumourtzoglou MA, Raz R, Wilson A, et al. Traffic-related air pollution and pregnancy loss. Epidemiology. 2019;30(1):4–10. [DOI] [PMC free article] [PubMed] [Google Scholar]
- 75. Ananth CV, Lavery JA, Vintzileos AM, et al. Severe placental abruption: clinical definition and associations with maternal complications. Am J Obstet Gynecol. 2016;214(2):272e1–272e9. [DOI] [PubMed] [Google Scholar]
- 76. Rasmussen S, Irgens LM, Dalaker K. Outcome of pregnancies subsequent to placental abruption: a risk assessment. Acta Obstet Gynecol Scand. 2000;79(6):496–501. [PubMed] [Google Scholar]
- 77. Raymond EG, Mills JL. Placental abruption: maternal risk factors and associated fetal conditions. Acta Obstet Gynecol Scand. 1993;72(8):633–639. [DOI] [PubMed] [Google Scholar]
- 78. Tikkanen M, Luukkaala T, Gissler M, et al. Decreasing perinatal mortality in placental abruption. Acta Obstet Gynecol Scand. 2013;92(3):298–305. [DOI] [PubMed] [Google Scholar]
Associated Data
This section collects any data citations, data availability statements, or supplementary materials included in this article.