

Abstract
In the present work, gadolinium substitution effects on the properties of yttrium manganite YxGd1−xMn0.97Fe0.03O3 (x from 0 to 1 with a step of 0.2) synthesized by an aqueous sol–gel method have been investigated. Partial substitution of Mn3+ by 57Fe3+ in the manganite was also performed in order to investigate deeper the structural properties of synthesized compounds applying Mössbauer spectroscopy. It was demonstrated that substitution of Y3+ by Gd3+ ions leads to the changes of structural, magnetic and morphological properties of investigated system. The crystal structure gradually transformed from hexagonal to orthorhombic with an increase of Gd3+ content in the crystal lattice. The mixed phase was obtained when x = 0.6, whereas other compounds were determined to be monophasic. Magnetization measurements revealed paramagnetic behavior of all specimens, however magnetization values were found to be dependent on chemical composition of the samples. Solid solutions with orthorhombic structure revealed higher magnetization values compared to those of hexagonal samples. The highest magnetization was observed for pure GdMn0.97Fe0.03O3. Structural properties were investigated by powder X-ray diffraction, Mössbauer, FTIR and Raman spectroscopies. Morphological features of the synthesized specimens were studied by scanning electron microscopy (SEM).
Subject terms: Inorganic chemistry, Materials chemistry, Chemical synthesis
Introduction
Perovskite-type lanthanide manganites LnMnO3 (Ln—lanthanide element) have attracted a lot of interest due to their unique properties including colossal magnetoresistance and multiferroicity1,2. These compounds could be used as microwave phase shifters, cooling materials as well as applied in photovoltaic solar cells3. Depending on lanthanide element, there are two possible perovskite structures: noncentrosymmetric hexagonal (for Ln = Ho-Lu) and orthorhombic (for Ln = La-Dy)4. Under certain temperature and pressure one structure can be transformed to another and vice versa5,6. Those two perovskite phases demonstrate different magnetic configurations and electric polarization, which is higher in hexagonal structure7.
YMnO3 can be obtained in both crystal structures: thermodynamically stable hexagonal and metastable orthorhombic structure. Hexagonal YMnO3 is known as a single-phase multiferroic material with room-temperature ferroelectricity (Tc ≈ 900 K) and low-temperature antiferromagnetism (TN ≈ 70 K)8,9. Orthorhombic YMnO3 is also considered as multiferroic at low temperatures, however it is characterized by lower electric polarization10. In addition to ferroelectric and antiferromagnetic properties, hexagonal YMnO3 is a narrow-band gap semiconductor, which can be utilized as photocatalyst for the degradation of organic pollutants under ultraviolet and visible light irradiation and gas sensing application11–13. According to literature, YMnO3 with orthorhombic structure can be prepared by a number of synthetic approaches such as mechanochemical synthesis14, epitaxial strain15 or other low-temperature syntheses16. For the preparation of hexagonal YMnO3 few synthesis methods were also reported, including sol–gel17, solid-state18, hydrothermal19, polymerized complex method20 and glycine-nitrate combustion21.
Orthorhombic GdMnO3 is another multiferroic rare-earth manganite, which shows few temperature-dependent magnetic transitions (from paramagnetic to antiferromagnetic collinear at 44 K, changing to A type antiferromagnetic at 23 K and weak ferromagnetism below 6 K)22 and large spontaneous polarization Pa ~ 4900 μC/m2 for thin films23. Hexagonal phase of this compound can be stabilized only in the form of epitaxial thin film, which was characterized by enhanced ferromagnetic properties24. Furthermore, this compound has high magnetoelectric coefficient and possesses pyroelectric properties25,26. For the preparation of GdMnO3 compound sol–gel27, solid-state28, sol–gel combustion29 and co-precipitation30 methods were previously applied.
There are few studies considering synthesis and characterization of YxGd1−xMnO3 system31–35. Vilarinho et al.33 and Bos et al.35 demonstrated the formation of YxGd1−xMnO3 solid solutions in a whole compositional range, while others investigated dielectric, magnetic and ferroelectric properties of Gd-rich orthorhombic compounds with x ≤ 0.431,32,34. It was observed that partial substitution of Gd3+ by Y3+ can lead to the stabilization of ferroelectric phase when x = 0.1. Furthermore, when x > 0.1 weak ferromagnetic character disappears and antiferromagnetic ordering is established34. The monophasic YxGd1−xMnO3 and related systems could be employed to study and understand the charge transport across the interfaces, to investigate deeper spin-disorder state near nonmagnetic impurities, to determine substitutional–driven structure-ferroelectricity relationship and other fundamental physical properties of such complex oxides. These new knowledges obtained could be used in future for the construction of specific functionalities in novel ferroelectrics.
In this work, the solid solutions of YxGd1−xMn0.97Fe0.03O3 (x = 0–1 with a step of 0.2) with partial substitution of Mn3+ by Fe3+ (or by 57Fe3+) ions were prepared for the first time by our best knowledge using environmentally friendly and simple sol–gel technique. Partial substitution of Mn3+ by 57Fe3+ in the manganites was performed in order to investigate deeper the structural and magnetic properties of synthesized compounds applying Mössbauer spectroscopy. The dependence and evolution of structural, magnetic and morphological properties on chemical composition were investigated and discussed herein.
Materials and methods
Synthesis
Synthesis of all samples was performed by sol–gel method using modified previously reported procedure36. For the preparation of YxGd1−xMn0.97Fe0.03O3 series by changing x from 0 to 1 with a step of 0.2, yttrium (III) nitrate hexahydrate (Y(NO3)3·6H2O, Sigma-Aldrich, 99.9%), gadolinium (III) nitrate hexahydrate (Gd(NO3)3·6H2O, Sigma-Aldrich, 99.99%), manganese (II) nitrate tetrahydrate (Mn(NO3)2·4H2O, Alfa Aesar, 99.9%) and iron powders (Fe, Carl Roth, 99.5%) were used as the starting materials. Firstly, iron powders were dissolved in 6 M nitric acid (HNO3, Carl Roth, 65%) and citric acid monohydrate (C6H8O7·H2O, Chempur, 99.9%) was separately dissolved in 20 ml of distilled water. After the dissolution of citric acid, all metal nitrates and required aliquot of iron solution were added. Next, the obtained mixture was heated on a hot plate at 90 °C under constant stirring until a clear and transparent solution was obtained. After it, an appropriate amount of ethylene glycol (C2H6O2, Sigma-Aldrich, ≥ 99.5%) was added to the above solution (total metal ions to citric acid to ethylene glycol molar ratio was 1:3:10). The obtained liquid precursor was homogenized under constant stirring at 90 °C for 1.5 h. For the formation of the gel the temperature of magnetic stirrer was increased to 150 °C, which led to the evaporation of water. The resulted gel was dried in the oven at 140 °C for 12 h, ground in agate mortar and annealed at 1100 °C for 5 h in air with a heating rate of 5 °C/min. Identical synthesis procedure was applied for the preparation of YxGd1−xMn0.97Fe0.03O3 (x = 0.0, 0.4 and 1.0) samples with 57Fe. These specimens were used only for Mössbauer spectroscopy measurements.
Characterization
Thermal decomposition of precursor gels was investigated by thermogravimetric and differential scanning calorimetric (TG/DTG/DSC) analysis using PerkinElmer STA 6000 Simultaneous Thermal Analyzer. About 5–10 mg of dried sample was heated from 30 °C to 900 °C at 10 °C/min heating rate in a dry flowing air (20 mL/min). X-ray diffraction (XRD) analysis was performed with Rigaku Miniflex II diffractometer using a primary beam Cu Kα radiation (λ = 1.541838 Å) in 2θ range from 10° to 70° with a step of 0.02° and scanning speed of 2°/min. The obtained diffraction data were refined by the Rietveld method using the Fullprof suite. PerkinElmer FT-IR spectrometer was used for FT-IR analysis of compounds. All spectra were recorded at ambient temperature in the range of 4000–400 cm−1. Raman spectra were recorded using inVia Raman (Renishaw, United Kingdom) spectrometer equipped with thermoelectrically cooled (− 70 °C) CCD camera and microscope. Raman spectra were excited with 532 nm beam from the CW diode pumped solid state (DPSS) laser (Renishaw, UK). The laser power at the sample was restricted to 0.6 mW to avoid laser-induced sample heating and photodegradation. The 20×/0.40 NA objective was used during all the measurements. The overall integration time was 400 s. Position of the Raman bands on the wavenumber axis was calibrated by the polystyrene film standard spectrum. Parameters of the bands were determined by fitting the experimental spectra with Gaussian–Lorentzian shape components using GRAMS/Al 8.0 (Thermo Scientific, USA) software. The morphology of samples was investigated using a scanning electron microscope (SEM) Hitachi SU-70. Grain size distribution was estimated from SEM micrographs using ImageJ software. Magnetometer consisting of the lock-in amplifier SR510 (Stanford Research Systems), the gauss/teslameter FH-54 (Magnet Physics) and the laboratory magnet supplied by the power source SM 330-AR-22 (Delta Elektronika) was used to record magnetization dependences on applied magnetic field. Mössbauer spectra were measured using 57Co(Rh) source and Mössbauer spectrometer (Wissenschaftliche Elektronik GmbH) at room (≈296 K) temperature and within 10–70 K temperature range. Closed cycle He cryostat (Advanced Research Systems) was applied for low temperature measurements. The doublets, sextets, quadrupole splitting and hyperfine field distributions, and Hamiltonian method were used to fit to Mössbauer spectra applying WinNormos Site and Dist software. Combined quadrupole and magnetic dipole interactions were described using Hamiltonian method applying the parameters: hyperfine field B, term (main component) of quadrupole interaction , asymmetry parameter η, and the angles θ and φ. Q is nuclear quadrupole moment and Vzz is z component of electric field gradient (EFG) diagonalized tensor choosing the principal axis system so that 37. The asymmetry parameter . The angle θ is between magnetization direction and EFG z axis while the angle φ is between magnetization projection into the xy plane and EFG x axis. In case of pure quadrupole or magnetic dipole interactions the parameters of doublets and sextets, respectively, are determined by simple solution of Hamiltonian. The quadrupole splitting of doublet which is observed in paramagnetic state when B = 0 is defined by:
| 1 |
When the quadrupole shifts ε of sextets lines defined by hyperfine magnetic field B are small they can be approximated by first order correction:
| 2 |
The outer lines of sextet shift by + ε, i.e. in different direction than inner four lines shifting by –ε.
The influence of quadrupole and magnetic dipole interactions was of comparable strength in case of YMn0.97Fe0.03O3. Therefore, direct solution Hamiltonian was used for YMn0.97Fe0.03O3 at low temperature. For Mössbauer measurements 3 mol% of Mn was substituted by Fe (90% enriched with 57Fe). Because of exchange interactions iron atoms generally reflect magnetic ordering and dynamics of Mn spins in studied manganites38–43.
Results and discussion
The XRD patterns of YxGd1−xMn0.97Fe0.03O3 samples annealed at 1100 °C are represented in Fig. 1. As was mentioned previously, few possible structures can be observed for YMnO3. In our case, high annealing temperature resulted in the formation of hexagonal YMn0.97Fe0.03O3 with P63cm space group (#185). All diffraction peaks match very well with standard XRD data of hexagonal YMnO3 (COD #96-153-3979). The same structure was observed for x = 0.8 sample, only with a slight shift of the peaks to lower 2θ values due to the difference in the ionic radii of Gd3+ and Y3+ (ionic radius of Gd3+ in VII-fold coordination is 1.0 Å and for Y3+–0.96 Å)44. There was no mixture of hexagonal and orthorhombic structures observed as was suggested before for this composition35. With increasing the amount of Gd3+ the phase transition from hexagonal to orthorhombic structure can be clearly seen. In the XRD pattern of x = 0.6 sample the diffraction peaks belonging to both orthorhombic and hexagonal structures were detected. Employing Rietveld refinement for this sample, the ratio between these structures was calculated to be around 1 to 9 (10.2%—hexagonal phase, 89.8%—orthorhombic phase). These results show a significant shift towards orthorhombic structure in comparison with previous study. In33 the authors reported on the coexistence of nearly equal amounts of hexagonal and orthorhombic phases in Y0.6Gd0.4MnO3 ceramics sintered at 1350 ºC. The structure of the samples with x = 0–0.4 was determined as orthorhombic with Pnma space group (#62). Similarly, the increase in Gd3+ content caused the slight shift of the peaks to lower 2θ values. The narrow 2θ ranges of the XRD patterns showing gradual shift of the most intense diffraction peaks depending on chemical composition of synthesized powders are given in Figures S2 and S3. The specimens with 57Fe isotope (YxGd1−xMn0.9757Fe0.03O3) demonstrated the identical structures (see Figure S4). No secondary phases were identified in the XRD patterns of all synthesized samples.
Figure 1.
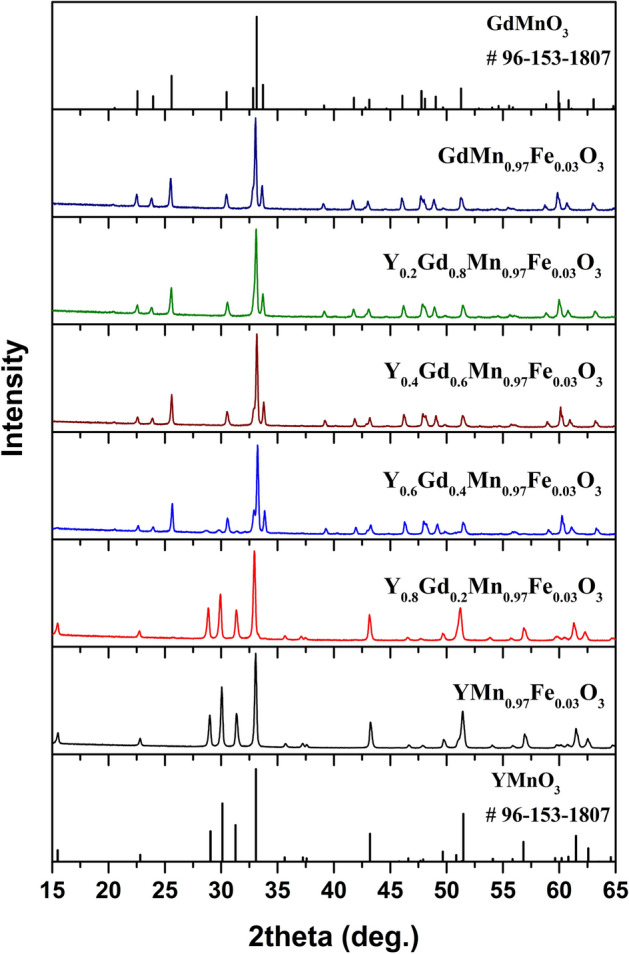
XRD patterns of YxGd1−xMn0.97Fe0.03O3 samples.
Rietveld refinement was performed for all synthesized samples. Calculated cell parameters and cell volumes are summarized in Table 1 and Table S1. It is seen that replacement of Y3+ by Gd3+ leads to the increase of unit cell parameters in the whole compositional range. Nearly linear dependence between chemical composition and cell parameters can be observed. The cell volume also increased with an increase of Gd3+ content. On the other hand, only minimal increase of c parameter in hexagonal structure can be seen.
Table 1.
Cell parameters of YxGd1−xMn0.97Fe0.03O3 samples.
| Sample | Lattice parameters (Å) | |||
|---|---|---|---|---|
| a | b | c | V | |
| YMn0.97Fe0.03O3 | 6.1438(4) | 6.1438(4) | 11.3724(0) | 371.76(0) |
| Y0.8Gd0.2Mn0.97Fe0.03O3 | 6.1666(7) | 6.1666(7) | 11.3728(8) | 374.54(3) |
| h-Y0.6Gd0.4Mn0.97Fe0.03O3 | 6.1813(5) | 6.1813(5) | 11.3732(0) | 375.34(8) |
| o-Y0.6Gd0.4Mn0.97Fe0.03O3 | 5.8266(8) | 7.3934(6) | 5.2764(1) | 227.30(4) |
| Y0.4Gd0.6Mn0.97Fe0.03O3 | 5.8285(5) | 7.4035(0) | 5.2846(7) | 228.04(2) |
| Y0.2Gd0.8Mn0.97Fe0.03O3 | 5.8307(7) | 7.4333(5) | 5.3030(2) | 229.84(4) |
| GdMn0.97Fe0.03O3 | 5.8375(4) | 7.4384(8) | 5.3137(5) | 231.13(1) |
Figure 2 represents FT-IR spectra of YxGd1−xMn0.97Fe0.03O3 specimens. Three absorption bands can be observed for hexagonal samples (x = 1 and 0.8). The broad bands centered at 663 cm−1 (x = 1) and 652 cm−1 (x = 0.8) can be associated with stretching mode of Mn–O bond. This signal can be observed for all samples in the spectral range of 663–635 cm−1. The low intensity peaks at 592 and 584 cm−1 can also be attributed to the stretching vibration of Mn–O bond. Lastly, the peaks at 416 and 415 cm−1 can be associated with vibrations of Y–O bond, which were previously reported in45. Introduction of Gd3+ ions into the YMn0.97Fe0.03O3 structure obviously caused some changes in FT-IR spectra of the samples. Firstly, the sharp peak appeared in 574–568 cm−1 range can be clearly seen. Another lower intensity signal can be observed at 493–483 cm−1. Both of them are attributed to vibrations of Gd–O bond46. Furthermore, appearance of two peaks can also be seen for the samples with orthorhombic structure. One of them is centered at 405 cm−1 for all orthorhombic samples, it is associated with Mn–O vibrations47. The absorption band at 530 cm−1 is ascribed to O–Mn–O bending mode48. The observed spectral changes can be explained by the fact that in hexagonal structure the Mn3+ ions are located in trigonal bipyramid with the coordination number of 5, whereas in orthorhombic structure Mn3+ and six O2− anions form octahedra (coordination number 6)49.
Figure 2.
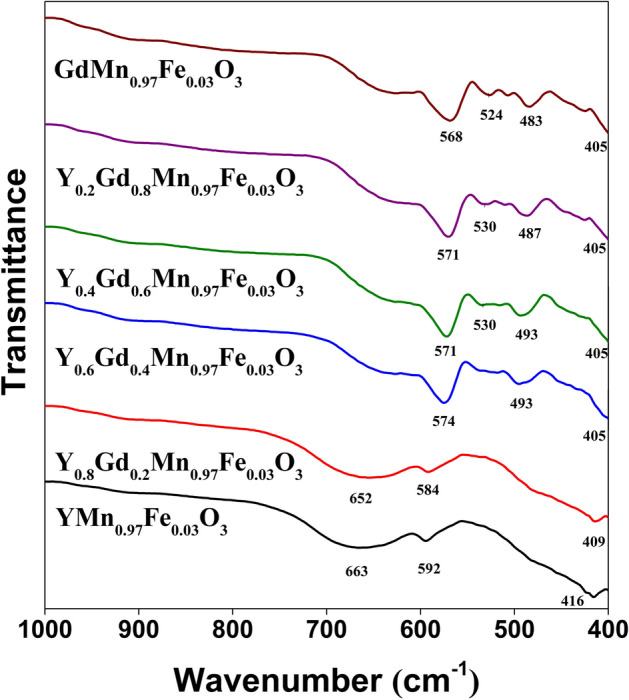
FT-IR spectra of YxGd1−xMn0.97Fe0.03O3 samples.
Raman scattering provides detailed molecular level information on short range arrangement or local symmetry which is difficult to acquire by other techniques. The method is also sensitive to structural distortions. Figure 3 compares Raman spectra of polycrystalline YMn0.97Fe0.03O3 and GdMn0.97Fe0.03O3 samples. Detailed vibrational analysis of hexagonal YMnO3 was performed previously by Iliev et al.50. The most intense band of YMn0.97Fe0.03O3 compound visible at 681 cm−1 belongs to very small or zero splitting transverse optical (TO) and longitudinal optical (LO) phonons with A1 symmetry considering the hexagonal structure. This mode is related to displacement of mainly oxygen atoms50. The shoulder at lower wavenumber side near 638 cm−1 is associated with TO-LO phonons of E1 symmetry50. Similarly, two low intensity bands located at 450 cm−1 (displacement of mainly oxygen and Mn atoms) and 405 cm−1 (displacement of mainly oxygen atoms) belong to A1 and E1 symmetry TO–LO modes, respectively. The low intensity band near 229 cm−1 can be assigned to E2 symmetry mode associated mainly with deformation vibration of oxygen and Mn atoms. Finally, the intense low frequency band at 135 cm−1 belongs to E2 symmetry mode related with motion of heavy Y atom. The low intensity feature near 1277 cm−1 is associated with overtone of oxygen stretching vibration51. Raman spectrum of GdMn0.97Fe0.03O3 differs considerably comparing with YMn0.97Fe0.03O3 (Fig. 3). Detailed assignments of Raman bands of orthorhombic perovskite GdMnO3 are provided in the publications of Illiev et al.52 and Oliveira et al.53. Thus, the most intense band at 609 cm−1 belongs to B2g(1) Jahn–Teller symmetry in-phase oxygen stretching mode. The Ag(1) symmetry MnO6 bending mode is located at 503 cm−1. The strong band at 484 cm−1 is associated with Ag(3) Jahn–Teller asymmetric stretching vibration of oxygen atoms. Finally, the well-defined band at 368 cm−1 belongs to Ag(4) symmetry mode. This mode is associated with out-of-phase rotation of MnO6 octahedra52. The broad and low intensity band at 1301 cm−1 is related with overtone of oxygen stretching vibration51.
Figure 3.
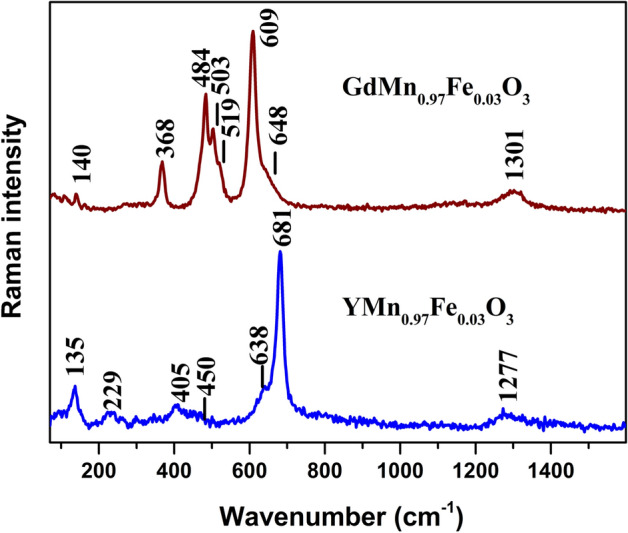
Raman spectra of polycrystalline YMn0.97Fe0.03O3 and GdMn0.97Fe0.03O3. Intensities are normalized to the intensity of the most intense band and spectra are shifted vertically for clarity. The excitation wavelength is 532 nm (0.6 mW). Parameters of the bands were determined by fitting the experimental spectra using GRAMS/Al software (version 8.0, https://www.thermofisher.com).
Figure 4a shows composition-dependent Raman spectra of YxGd1−xMn0.97Fe0.03O3 compounds. The spectra corresponding to x = 1 and 0.8 are very similar indicating preservation of hexagonal YMnO3 structure in the case of Y0.8Gd0.2Mn0.097Fe0.03O3. Small distortions in the lattice are visible from the downshift of the intense A1 symmetry band from 681.3 to 678.7 cm−1, increase in relative intensities of E1 and E2 modes, and downshift of low frequency band associated with motion of Y3+ ion from 135.4 to 131.7 cm−1. Such frequency downshift correlates with larger ionic radius of Gd3+44.
Figure 4.

Composition dependent Raman spectra of polycrystalline YxGd1−xMn0.97Fe0.03O3 compounds. Intensities are normalized to the intensity of the most intense band and spectra are shifted vertically for clarity. The excitation wavelength is 532 nm (0.6 mW) (a). Composition variation of Raman wavenumber of YxGd1−xMn0.097Fe0.03O3 compounds for Ag(3) mode associated with asymmetric stretching vibration of oxygens (b) and Ag(4) mode associated with out-of-phase rotation of MnO6 octahedra (c). Parameters of the bands were determined by fitting the experimental spectra using GRAMS/Al software (version 8.0, https://www.thermofisher.com).
However, drastic spectral changes take place after an additional introduction of Gd3+ to the level corresponding to Y0.6Gd0.4MnO3 composition. Characteristic vibrational bands of hexagonal YMnO3 completely disappeared. Instead, new bands characteristic to orthorhombic perovskite GdMnO3 appeared. Peak positions of all the observed bands downshift upon increasing the Gd3+ content corresponding to x = 0.6. Interestingly, further increase in Gd3+ amount does not affect the positions of intense bands at 609 or 484 cm−1 (Fig. 4b). However, different behavior was detected for the Ag(4) mode near 368 cm−1 (Fig. 4c). Previously, it was demonstrated that phonon frequency of Ag(4) mode depends linearly on the MnO6 hexagon rotation angle; frequency decreases with decreasing the angle52,54.
Figure 5 shows SEM micrographs of YxGd1−xMn0.097Fe0.03O3 powders annealed at 1100 ºC and histograms of grain sizes with corresponding derivatives of cumulative distribution. It can be seen that YMn0.97Fe0.03O3 powder (Fig. 5a) possesses porous structure and consists of sintered aggregates which are composed of smaller and mostly uniform particles necked to each other. The histogram of grain size distribution (Fig. 5e) shows that grain size varies in the range of approximately 200–700 nm (around 90% of the grains; derivative of the cumulative distribution has maximum at 433 nm). The SEM micrographs of Y0.6Gd0.4Mn0.097Fe0.03O3 and Y0.4Gd0.6Mn0.097Fe0.03O3 powders (Fig. 5b,c) show that particles having similar sizes and shape were formed, but slightly narrower size range was observed compared to the undoped sample (derivative maxima were obtained at 384 nm and 415 nm for Y0.6Gd0.4Mn0.097Fe0.03O3 and Y0.4Gd0.6Mn0.097Fe0.03O3, respectively). Porous structure was also maintained after the Gd was introduced as dopant. The different morphology was observed for the GdMn0.97Fe0.03O3 material (Fig. 5d). As seen, GdMn0.97Fe0.03O3 powder possesses the smallest grains; and the histogram shows that around 90% of all grains are distributed in 100–500 nm range and around 70% of grains lie in considerably narrower range from 200 to 400 nm (derivative maximum at 320 nm). This shows that with an increase in Gd content the average grain size of Y–Gd–Mn–Fe–O powders becomes smaller and suggests that the surface area and porosity of such ceramic materials could be tailored by changing chemical composition.
Figure 5.

SEM micrographs of YMn0.97Fe0.03O3 (a), Y0.6Gd0.4Mn0.97Fe0.03O3 (b), Y0.4Gd0.6Mn0.97Fe0.03O3 (c) and GdMn0.97Fe0.03O3 (d) powders and histograms of grain sizes with corresponding derivatives of the cumulative distribution (e). Grain size distribution was calculated using ImageJ software (version 1.52 s, https://imagej.nih.gov).
Dependence of the magnetization on applied magnetic field strength was studied for all samples and results are presented in Fig. 6. Linear magnetization dependences were observed for all YxGd1−xMn0.97Fe0.03O3 solid solutions, which corresponds to paramagnetic state of the materials. Magnetic susceptibility of rare earth manganites is due to both Gd and Mn magnetic moments. The Curie–Weiss law was used to describe dependence of magnetic (molar) susceptibility, where NA and kB are the Avogadro number and Boltzmann constant on temperature. Application of Curie–Weiss law gave Curie–Weiss temperature θ = -421 K and θ ≈-35 K for YMnO3 and GdMnO339,55, respectively. The effective magnetic moment μeff≈9.4 μB of GdMnO3 was considerably larger than μeff = 4.98 μB for YMnO3, where μB is Bohr magneton. Therefore, the inclination magnetization lines increase with amount of Gd3+ because of both change in θ and μeff. It can be noticed that more significant decrease in magnetization values was observed along with transformation from orthorhombic structure to hexagonal (between x = 0.6 and 0.8).
Figure 6.
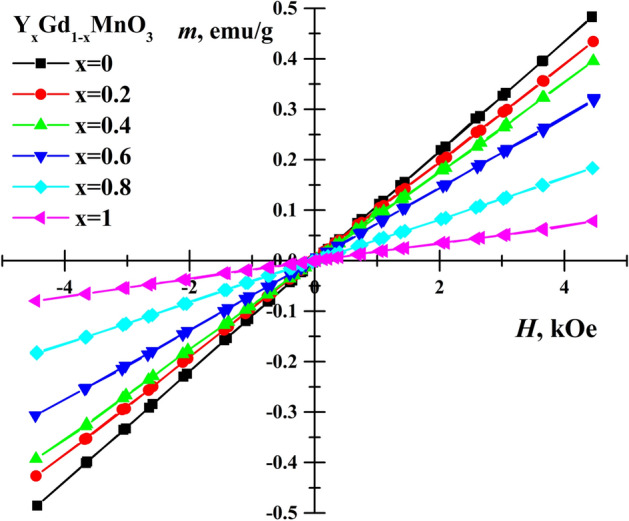
Magnetization hysteresis of YxGd1−xMn0.97Fe0.03O3 samples at room temperature.
Two alternative methods, quadrupole splitting distributions P(∆) with quadrupole splitting ∆ step of 0.1 mm/s and three or four doublets with freely variable parameters, were used for fitting to the room temperature Mössbauer spectra of YxGd1−xMn0.97Fe0.03O3 (Fig. 7, Table 2). Quadrupole splitting distributions P(∆) have peaks approximately at 1.60, 1.58 and 1.95 mm/s for x = 0, 0.4 and 1, respectively. However, the distributions are wide; therefore, they indicate that Fe sites differ significantly by quadrupole splitting. The wider distribution of mixed Y0.4Gd0.6Mn0.97Fe0.03O3 in comparison to other two (Fig. 7b) can be explained by different influence of Y3+ and Gd3+ to the local crystal structure. In case of application of separate doublets, the most intense doublet has largest quadrupole splitting ∆ (Table 2) which value can be explained by significant distortions of bipyramid MnO5 and octahedra MnO6 in hexagonal and orthorhombic RMnO3 (R is rare earth) structures evaluating EFG components with application of point charge model38,40,41. The doublets of smaller splitting should be attributed to more symmetric Fe sites. According to previous Mössbauer study of hexagonal YFeyMn1−yO338 the relative area of doublet with smaller ∆ increased with Mn substitution by Fe. In the studies39,42 additional doublets at y = 0.1; 0.2 were related with Fe atoms occupying Mn sites in nearest neighborhood. However, at 3% Mn substitution the observed intensity of additional doublet was much larger than could be according to random occupation of six neighboring sites by Fe. Probably, the number of defects which increases in case of ultrafine structure, may also have similar influence. The isomer shift which is proportional to electron density at Fe nucleus37 depends on the Fe coordination number because of redistribution of electron charge. The isomer shift δ≈0.29 mm/s of hexagonal YMn0.97Fe0.03O3 was smaller than δ≈0.36 mm/s for orthorhombic phases YxGd1−xMn0.97Fe0.03O3 with x = 0, 0.4 (Table 2). Comparing hexagonal and orthorhombic phases it can be noticed that the dependence of isomer shift δ on quadrupole splitting ∆ is of different sign (Fig. 7b). Moreover, it can be noted that the ratio of intensities of doublet lines A12 is slightly deviated from 1 (Table 2). Such effect can be caused by Goldanskii-Karyagin effect or sample anisotropy56.
Figure 7.

Mössbauer spectra of YxGd1−xMn0.97Fe0.03O3 at room temperature fitted to doublets (a) and quadrupole splitting distribution P(∆) with dependence of isomer shift δ on quadrupole splitting ∆ (b). Fitting of the spectra was performed using WinNormos-for-Igor software package (version 3.0, http://www.wissel-gmbh.de).
Table 2.
Parameters of doublets used to fit to YxGd1−xMn0.97Fe0.03O3 Mössbauer spectra at room temperature: S is relative area, Γ—linewidth, δ—isomer shift relatively to α-Fe at room temperature, Δ—quadrupole splitting, A12—line area ratio.
| x | S, % | Γ, mm/s | δ, mm/s | Δ, mm/s | A12 |
|---|---|---|---|---|---|
| 0 | 38 | 0.254 ± 0.014 | 0.356 ± 0.001 | 1.668 ± 0.013 | 0.952 ± 0.004 |
| χ2 = 1.12 | 32 | 0.26 ± 0.03 | 0.362 ± 0.003 | 1.435 ± 0.017 | 0.952* |
| 30 | 0.345 ± 0.012 | 0.376 ± 0.003 | 1.113 ± 0.017 | 0.952* | |
| average | 0.364 ± 0.001 | 1.425 ± 0.009 | |||
| 0.4 | 34 | 0.27 ± 0.01 | 0.352 ± 0.001 | 1.662 ± 0.013 | 0.954 ± 0.003 |
| χ2 = 1.34 | 29 | 0.30 ± 0.04 | 0.358 ± 0.001 | 1.403 ± 0.016 | 0.954* |
| 37 | 0.41 ± 0.01 | 0.370 ± 0.002 | 1.065 ± 0.015 | 0.954* | |
| average | 0.361 ± 0.001 | 1.425 ± 0.009 | |||
| 1 | 42 | 0.254 ± 0.004 | 0.298 ± 0.001 | 2.039 ± 0.008 | 0.983 ± 0.002 |
| χ2 = 1.53 | 28 | 0.23 ± 0.04 | 0.290 ± 0.001 | 1.828 ± 0.011 | 0.983* |
| 18 | 0.26 ± 0.05 | 0.293 ± 0.001 | 1.61 ± 0.04 | 0.983* | |
| 12 | 0.339 ± 0.015 | 0.282 ± 0.002 | 1.190 ± 0.009 | 0.983* | |
| average | 0.292 ± 0.001 | 1.801 ± 0.006 |
*All equal.
According to low temperature Mössbauer spectra the magnetic ordering occurs at ≈ 36, 39, 70 K for YxGd1−xMn0.97Fe0.03O3 with x = 0, 0.4 and 1, respectively (Figs. 8 and 9a). It was previously observed for YFeyMn1−yO3 that increasing y from 0.02 to 0.2 magnetic ordering temperature decreased from 73 to 60 K38. Crystal structure (hexagonal or orthorhombic) of RMnO3 and Mn–O-Mn angle in orthorhombic RMnO3 affect magnetic ordering temperature according to38–43,55,57,58. Mössbauer spectrum of YMn0.97Fe0.03O3 measured at 12 K (Fig. 8a) was fitted to subspectra using Hamiltonian method as the quadrupole shifts were too large to consider only first order corrections (Eq. (2)). The term of quadrupole interaction was fixed according to room temperature data, (Eq. (1), Tables 2 and 3). In case of hexagonal YMn0.97Fe0.03O3 the angle θ = 90° (Table 3) corresponds to EFG z axis along crystal c axis and the magnetization in ab plane39,42,58,59. The angle φ between magnetization projection into EFG xy plane and x axis had small influence on fitting quality and was fixed to 0 or 90° trying to keep 0 < η < 1 (Table 3). When asymmetry of EFG37 which expressed by parameter η is small, according to Eq. (2) the spins of Fe lying at different angles in ab plane resulted only in small changes in position of lines of Mössbauer spectrum and can be ascribed to the same subspectrum with slightly larger width of lines. Negative sign of for YMn0.97Fe0.03O3 was in agreement with point charge calculations of EFG in case of hexagonal structure of rare earth manganites YMnO3 and YbMnO338,40. Four subspectra (Table 3) which were fitted to Mössbauer spectrum of YMn0.97Fe0.03O3 measured at 12 K correspond to doublets because of fixing and area ratios of subspectra. Largest difference in hyperfine field B values of subspectra was ≈3 T indicating that the spectrum is broadened because of variation of both dipole magnetic and quadrupole interactions.
Figure 8.

Mössbauer spectra of YMn0.97Fe0.03O3 (a), Y0.4Gd0.6 Mn0.97Fe0.03O3 (b) and GdMn0.97Fe0.03O3 (c) at indicated temperatures. Fitting of the spectra was performed using WinNormos-for-Igor software package (version 3.0, http://www.wissel-gmbh.de).
Figure 9.

Dependence of average hyperfine field < B > (left), relative area of doublet S (right) (a), average quadrupole shift < 2ε> (b) for YMn0.97Fe0.03O3, Y0.4Gd0.6Mn0.97Fe0.03O3, and GdMn0.97Fe0.03O3 on temperature. The peaks positions (c) and the relative area of hyperfine field distributions P(B) (d) within 0–25 and 25–45 T regions on temperature.
Table 3.
Parameters of sextets and Hamiltonian used to fit to YxGd1−xMn0.97Fe0.03O3 Mössbauer spectra measured at 11–12 K: S is relative area, Γ–linewidth, δ—isomer shift relatively to α-Fe at room temperature, 2ε—quadrupole shift, —term of quadrupole interaction, B—hyperfine field, η—asymmetry parameter, θ is the angle between magnetization and EFG z axis and φ is the angle between magnetization projection and EFG x axis.
| x | S, % | Γ mm/s | δ, mm/s | 2ε, mm/s | B, T | |||
|---|---|---|---|---|---|---|---|---|
| 0 | 52 | 0.67 ± 0.03 | 0.493 ± 0.006 | 0.22 ± 0.01 | 42.33 ± 0.08 | – | – | – |
| 15 | 0.48 ± 0.08 | 0.463 ± 0.013 | 0.13 ± 0.03 | 39.80 ± 0.13 | – | – | – | |
| 15 | 0.74 ± 0.10 | 0.50 ± 0.02 | − 0.06 ± 0.05 | 36.0 ± 0.2 | – | – | – | |
| 18 | 2.1 ± 0.4 | 0.493* | − 0.2 ± 0.2 | 20.0 ± 0.8 | – | – | – | |
| 0.4 | 34 | 0.75 ± 0.05 | 0.481 ± 0.007 | 0.57 ± 0.02 | 43.6 ± 0.1 | – | – | – |
| 27 | 0.84 ± 0.09 | 0.481* | 0.41 ± 0.03 | 39.9 ± 0.2 | – | – | – | |
| 26 | 1.04 ± 0.09 | 0.481* | 0.04 ± 0.04 | 35.1 ± 0.2 | – | – | – | |
| 13 | 0.78 ± 0.08 | 0.481* | − 0.64 ± 0.05 | 20.9 ± 0.2 | – | – | – |
| , mm/s | η | θ, ° | ϕ, ° | |||||
|---|---|---|---|---|---|---|---|---|
| 1 | 42 | 0.36 ± 0.01 | 0.413 ± 0.001 | − 2.039* | 42.97 ± 0.01 | 0.128 ± 0.003 | 90* | 0* |
| 28 | 0.33 ± 0.01 | 0.418 ± 0.002 | − 1.828* | 44.42 ± 0.01 | 0.066 ± 0.004 | 90* | 0* | |
| 18 | 0.42 ± 0.01 | 0.423 ± 0.004 | − 1.61* | 41.89 ± 0.04 | 0.018 ± 0.009 | 90* | 90* | |
| 12 | 0.73 ± 0.03 | 0.405 ± 0.012 | − 1.19* | 40.07 ± 0.11 | 0.38 ± 0.04 | 90* | 90* |
*Fixed.
At lowest 11–12 K temperature the lines of Mössbauer spectra of GdMn0.97Fe0.03O3 and especially Y0.4Gd0.6Mn0.97Fe0.03O3 (Fig. 8b,c) were broader than those of YMn0.97Fe0.03O3. Four sextets with different parameters B and 2ε were fitted to Mössbauer spectra (Table 3). Quadrupole shifts of subspectra were smaller than those of YMn0.97Fe0.03O3 calculated according to Eq. (2) as shown in Fig. 9b, but hyperfine field B of sextets varied from 20 to ≈42 T. Such differences arise because of lower magnetic ordering temperature, crystal structure and spin ordering specifics.
Hyperfine field distributions P(B) were used for fitting to the Mössbauer spectra (Figs. 8 and 10) measured at higher then 11–12 K temperature up to transition to paramagnetic state. The shape of distributions is characterized by the features that are specific of different studied samples. Hyperfine distributions of YMn0.97Fe0.03O3 exhibited one peak within 35–45 T hyperfine field range which intensity decreased as temperature increased (Figs. 9c and 10a). Two peaks within 30–45 and 10–20 T hyperfine field regions (Fig. 9c) were characteristic of hyperfine field distributions P(B) of GdMn0.97Fe0.03O3. Broader hyperfine distributions of Y0.4Gd0.6Mn0.97Fe0.03O3 were observed because of different influence of Y and Gd on Fe local surrounding.
Figure 10.

Hyperfine field distributions P(B) of YMn0.97Fe0.03O3 (a), Y0.4Gd0.6Mn0.97Fe0.03O3 (b), and GdMn0.97Fe0.03O3 (c). Fitting was performed using WinNormos-for-Igor software package (version 3.0, http://www.wissel-gmbh.de).
Dividing P(B) of GdMn0.97Fe0.03O3 into two parts (hyperfine field B varies in the range of 0–25 and 25–45 T) it can be shown that intensities of high and low hyperfine field regions were approximately equal at 23 K (Fig. 9d) when the magnetic ordering transition in GdMnO3 occurs55,57,58,60. P(B) within 25–45 T region dominates at low 11–12 K temperature (Fig. 10c, Table 3) when Mn spin order in GdMnO3 is A type antiferromagnetic. Incommensurate collinear (IC) sinusoidal amplitude modulated spin order (spin lying along a axis of Pnma space group or b axis in Pbnm) at temperature higher than 23 K should lead to P(B) distribution in a wide hyperfine field range as observed for FeVO4 and orthorhombic Fe-doped YbMnO343,61 with a maximum of B≈38 T. However, we observed the distribution of P(B) for GdMn0.97Fe0.03O3 having another peak at B = 10–20 T and minimum at B = 20–25 T which could be hardly related with IC sinusoidal amplitude modulated spin order. Certainly, Fe spin coupled by exchange interactions with nearest-neighbor Mn should be affected by Mn spin modulation. The exchange interactions of Mn–O–Mn in studied materials are ferromagnetic or antiferromagnetic depending on crystallographic directions57. However, the doping with Fe may lead to some changes in spin order compared to GdMnO3 because of the exchange interactions of Mn–O–Mn being of different strength compared to ferromagnetic Mn–O–Fe or antiferromagnetic Fe–O–Fe exchange interactions. Structural differences in Fe sites which are indicated by quadrupole splitting changes at room temperature should also affect spin order. In case of Y0.4Gd0.6Mn0.97Fe0.03O3 three hyperfine field distributions P(B) were used (Fig. 10b). Two P(B) having different quadrupole shift were needed in 25–45 T range, probably because of different Y and Gd influence on Fe local surrounding. In this case even more complicated spin order may exist.
Mössbauer spectra broadening and lines shift to center when temperature increases are explained by the increase in spin relaxation rate. According to Mössbauer spectra line shape theory62,63 the shape depends on population of stochastic spin states and transition rate between these states. Different stochastic states of Fe occur because of thermal excitations of spins, collective excitations such as magnons. At characteristic time of transition between stochastic states less than 10–7 s the shape of spectra starts to change (Mössbauer lines broaden) and at less than 10–9–10–10 s averaged states (merged sextet lines to doublet/singlet at paramagnetic state) are observed. The change in peak positions Bpeak of GdMn0.97Fe0.03O3 within 25–45 and 0–25 T hyperfine field regions, when temperature increases, was rather slow similarly to that of one peak position of YMn0.97Fe0.03O3 in Figs. 9c and 10a. The gradual probability shift from the higher B region with P(B) peak at B = 30–45 T to another one with 10–20 T peak with increasing temperature is associated with the decrease in hyperfine field because of thermal excitation and averaging of states. The spin order transitions can also contribute to lowering of hyperfine field, however, we do not observe any abrupt changes at 23 K (Fig. 9a).
Conclusions
A series of YxGd1−xMn0.97Fe0.03O3 (x from 0 to 1 with a step of 0.2) powders has been synthesized by an aqueous sol–gel method, and gadolinium substitution effects in yttrium manganite were investigated. Partial substitution of Mn3+ by 57Fe3+ was performed in order to investigate deeper the structural properties of synthesized compounds applying Mössbauer spectroscopy. With increasing the Gd3+ content in the samples the crystal structure of YxGd1−xMn0.97Fe0.03O3 gradually transformed from hexagonal to orthorhombic. The mixed phase was obtained when x = 0.6, whereas other compounds were determined to be monophasic. It was demonstrated that cell parameters increased almost linearly with increasing amount of Gd3+ in YxGd1−xMn0.97Fe0.03O3. The results of FTIR and Raman spectroscopies were in good agreement with ones obtained by XRD analysis. According to SEM micrographs, the most of the samples were composed of porous aggregates which are organized of significantly smaller and mostly uniform particles necked to each other. The particle size varies in the range of approximately 100–600 nm depending on the chemical composition of gadolinium-substituted yttrium manganites. All synthesized compounds were characterized by paramagnetic behavior at room temperature; however, magnetization values were found to be dependent on chemical composition of the samples. Solid solutions with orthorhombic structure revealed higher magnetization values compared to those of hexagonal samples. According to Mössbauer spectroscopy data the magnetic ordering occurs at ≈ 36, 39 and 70 K for YxGd1−xMn0.97Fe0.03O3 with x = 0, 0.4 and 1, respectively. For orthorhombic GdMn0.97Fe0.03O3 the change in types of antiferromagnetic ordering at 23 K is associated with the increase in hyperfine field probability of distribution within 25–45 T relatively to 10–20 T region which is more intense at higher temperature.
Supplementary Information
Acknowledgements
This work was supported by a Research grant BUNACOMP (No. S-MIP-19-9) from the Research Council of Lithuania (LMTLT). G.N. gratefully acknowledges the Center of Spectroscopic Characterization of Materials and Electronic/Molecular Processes (SPECTROVERSUM Infrastructure) for use of Raman spectrometer. E.G. gratefully acknowledges financial support by the Swedish Research Council for Environment, Agricultural Sciences and Spatial Planning (FORMAS) Project “Utilization of solid inorganic waste from the aquaculture industry as wood reinforcement material for flame retardancy” (grant no. 2018-01198). The World Federation of Scientists is highly acknowledged for a National Scholarship to A.Z.
Author contributions
Conceptualization, A.Z. and A.K.; methodology, D.K. and A.Z.; formal analysis, D.K., A.Z. E.G., K.M., D.B., G.N. A.B.; investigation, D.K., A.Z. E.G., K.M., D.B., G.N., A.B.; resources, E.G., A.K.; writing—original draft preparation, D.K.; writing—review and editing, A.K.; supervision, A.K.; funding acquisition, E.G., A.B. All authors reviewed the manuscript.
Competing interests
The authors declare no competing interests.
Footnotes
Publisher's note
Springer Nature remains neutral with regard to jurisdictional claims in published maps and institutional affiliations.
Supplementary Information
The online version contains supplementary material available at 10.1038/s41598-021-82621-6.
References
- 1.Dong S, Liu JM. Recent progress of multiferroic perovskite manganites. Mod. Phys. Lett. B. 2012;26:1230004. doi: 10.1142/S0217984912300049. [DOI] [Google Scholar]
- 2.Tokura Y, Tomioka Y. Colossal magnetoresistive manganites. J. Magn. Magn. Mater. 1999;200:1–23. doi: 10.1016/S0304-8853(99)00352-2. [DOI] [Google Scholar]
- 3.Vopson MM. Fundamentals of multiferroic materials and their possible applications. Crit. Rev. Solid State Mater. Sci. 2015;40:223–250. doi: 10.1080/10408436.2014.992584. [DOI] [Google Scholar]
- 4.Tan H, Xu C, Li M, Wang S, Gu BL, Duan W. Pressure and strain effects of hexagonal rare-earth manganites: A first-principles study. J. Phys. Condens. Matter. 2016;28:8. doi: 10.1088/0953-8984/28/12/126002. [DOI] [PubMed] [Google Scholar]
- 5.Feng SM, Chai YS, Zhu JL, Manivannan N, Oh YS, Wang LJ, Yang YS, Jin CQ. Determination of the intrinsic ferroelectric polarization in orthorhombic HoMnO3. New J. Phys. 2010;12:100411. doi: 10.1088/1367-2630/12/7/073006. [DOI] [Google Scholar]
- 6.Ivanov VY, Mukhin AA, Prokhorov AS, Balbashov AM, Ishakova LD. Magnetic properties and phase transitions in hexagonal DyMnO3 single crystals. Phys. Solid State. 2006;48:1726–1729. doi: 10.1134/S1063783406090186. [DOI] [Google Scholar]
- 7.Ren CY. Atomic, electronic, and ferroelectric properties of manganite RMnO3 (R=Ho, Er, Tm, Lu) in hexagonal and orthorhombic phases. Phys. Rev. B Condens. Matter Mater. Phys. 2009;79:1–10. [Google Scholar]
- 8.Khomskii D. Classifying multiferroics: Mechanisms and effects. Physics. 2009;2:20. doi: 10.1103/Physics.2.20. [DOI] [Google Scholar]
- 9.Gibbs AS, Knight KS, Lightfoot P. High-temperature phase transitions of hexagonal YMnO3. Phys Rev. B - Condens. Matter Mater. Phys. 2011;83:1–9. doi: 10.1103/PhysRevB.83.094111. [DOI] [Google Scholar]
- 10.Zhou JS, Goodenough JB, Gallardo-Amores JM, Moran E, Alario-Franco MA, Caudillo R. Hexagonal versus perovskite phase of manganite RMnO3 (R=Y, Ho, Er, Tm, Yb, Lu) Phys. Rev. B Condens. Matter Mater. Phys. 2006;74:1–7. [Google Scholar]
- 11.Medvedeva JE, Anisimov VI, Korotin MA, Mryasov ON, Freeman AJ. Effect of Coulomb correlation and magnetic ordering on the electronic structure of two hexagonal phases of ferroelectromagnetic YMnO3. J. Phys. Condens. Matter. 2001;12:4947–4958. doi: 10.1088/0953-8984/12/23/304. [DOI] [Google Scholar]
- 12.Addabbo T, Bertocci F, Fort A, Gregorkiewitz M, Mugnaini M, Spinicci R, Vignoli V. Gas sensing properties of YMnO3 based materials for the detection of NOx and CO. Sensors Actuators B Chem. 2017;244:1054–1070. doi: 10.1016/j.snb.2017.01.054. [DOI] [Google Scholar]
- 13.Wang SF, Yang H, Xian T, Liu XQ. Size-controlled synthesis and photocatalytic properties of YMnO3 nanoparticles. Catal. Commun. 2011;12:625–628. doi: 10.1016/j.catcom.2010.11.023. [DOI] [Google Scholar]
- 14.Počuča-Nešić M, Marinkovic Stanojevic Z, Brankovic Z, Cotič P, Bernik S, Sousa Goes M, Marinkovic BA, Varela JA, Brankovic G. Mechanochemical synthesis of yttrium manganite. J. Alloys Compd. 2013;552:451–456. doi: 10.1016/j.jallcom.2012.11.031. [DOI] [Google Scholar]
- 15.Uusi-Esko K, Malm J, Karppinen M. Atomic layer deposition of hexagonal and orthorhombic YMnO3 thin films. Chem. Mater. 2009;21:5691–5694. doi: 10.1021/cm9020172. [DOI] [Google Scholar]
- 16.Brinks HW, Fjellvåg H, Kjekshus A. Synthesis of metastable perovskite-type YMnO3 and HoMnO3. J. Solid State Chem. 1997;129:334–340. doi: 10.1006/jssc.1996.7261. [DOI] [Google Scholar]
- 17.Kim KT, Kim CI. The effects of drying temperature on the crystallization of YMnO3 thin films prepared by sol-gel method using alkoxides. J. Eur. Ceram. Soc. 2004;24:2613–2617. doi: 10.1016/j.jeurceramsoc.2003.08.010. [DOI] [Google Scholar]
- 18.Iliev M, Lee H, Popov V. Raman- and infrared-active phonons in hexagonal: Experiment and lattice-dynamical calculations. Phys. Rev. B Condens. Matter Mater. Phys. 1997;56:2488–2494. doi: 10.1103/PhysRevB.56.2488. [DOI] [Google Scholar]
- 19.Kumar RD, Jayavel R. Low temperature hydrothermal synthesis and magnetic studies of YMnO3 nanorods. Mater. Lett. 2013;113:210–213. doi: 10.1016/j.matlet.2013.09.070. [DOI] [Google Scholar]
- 20.Asakura Y, Miyake A, Yin S. Improvement of the O2 storage/release rate of YMnO3 nanoparticles synthesized by the polymerized complex method. Dalton Trans. 2020;49:966–971. doi: 10.1039/C9DT04095A. [DOI] [PubMed] [Google Scholar]
- 21.Alqat A, Gebrel Z, Kusigerski V, Spasojevic V, Mihalik M, Mihalik M, Blanusa J. Synthesis of hexagonal YMnO3 from precursor obtained by the glycine–nitrate process. Ceram. Int. 2013;39:3183–3188. doi: 10.1016/j.ceramint.2012.10.002. [DOI] [Google Scholar]
- 22.Wang XL, Li D, Cui TY, Kharel P, Liu W, Zhang ZD. Magnetic and optical properties of multiferroic GdMnO3 nanoparticles. J. Appl. Phys. 2010;107:766. [Google Scholar]
- 23.Li X, Lu C, Dai J, Dong S, Chen Y, Hu N, Wu G, Liu M, Yan Z, Liu JM. Novel multiferroicity in GdMnO3 thin films with self-assembled nano-twinned domains. Sci. Rep. 2014;4:7019. doi: 10.1038/srep07019. [DOI] [PMC free article] [PubMed] [Google Scholar]
- 24.Lee D, Lee JH, Murugavel P, Jang SY, Noh TW, Jo Y, Jung MH, Ko YD, Chung JS. Epitaxial stabilization of artificial hexagonal GdMnO3 thin films and their magnetic properties. Appl. Phys. Lett. 2007;90:2–5. [Google Scholar]
- 25.Zhang X, Zhao YG, Cui YF, Ye LD, Zhao DY, Li PS, Wang JW, Zhu MH, Zhang HY, Rao GH. Investigation on the pyroelectric property of polycrystalline GdMnO3. Appl. Phys. Lett. 2014;104:062903. doi: 10.1063/1.4865376. [DOI] [Google Scholar]
- 26.Kimura T, Lawes G, Goto T, Tokura Y, Ramirez AP. Magnetoelectric phase diagrams of orthorhombic RMnO3 (R=Gd, Tb, and Dy) Phys. Rev. B Condens. Matter Mater. Phys. 2005;71:1–13. doi: 10.1103/PhysRevB.71.224425. [DOI] [Google Scholar]
- 27.Negi P, Dixit G, Agrawal HM, Srivastava RC. Structural, optical and magnetic properties of multiferroic GdMnO3 nanoparticles. J. Supercond. Nov. Magn. 2013;26:1611–1615. doi: 10.1007/s10948-012-1870-0. [DOI] [Google Scholar]
- 28.Samantaray S, Mishra DK, Pradhan SK, Mishra P, Sekhar BR, Behera D, Rout PP, Das SK, Sahu DR, Roul BK. Correlation between structural, electrical and magnetic properties of GdMnO3 bulk ceramics. J. Magn. Magn. Mater. 2013;339:168–174. doi: 10.1016/j.jmmm.2013.03.015. [DOI] [Google Scholar]
- 29.Ferreira WS, Agostinho Moreira J, Almeida A, Chaves MR, Araujo JP, Oliveira JB, Machado Da Silva JM, Sa MA, Mendonca TM, Simeao Carvalho P, Kreisel J, Ribeiro JL, Vieira LG, Tavares PB, Mendonca S. Spin-phonon coupling and magnetoelectric properties: EuMnO3 versus GdMnO3. Phys. Rev. B - Condens. Matter Mater. Phys. 2009;79:1–10. doi: 10.1103/PhysRevB.79.054303. [DOI] [Google Scholar]
- 30.Prakash BJ, Kumar KN, Buddhudu S. Thermal, magnetic and electrical properties of multiferroic GdMnO 3 nano particles by a co-precipitation method. Ferroelectr. Lett. Sect. 2012;39:104–116. doi: 10.1080/07315171.2012.741954. [DOI] [Google Scholar]
- 31.Mukhin AA, Ivanov VY, Travkin VD, Prokhorov AS, Kadomtseva AM, Popov YF, Vorobev GP, Pimenov AV, Balbashov AM. Phase transitions and spin excitations in new multiferroics with modulated magnetic structure. Bull. Russ. Acad. Sci. Phys. 2007;7:1617–1619. doi: 10.3103/S1062873807110469. [DOI] [Google Scholar]
- 32.Ramaiyan Mahadevan S, Varadarajan S, Awasthi AM, Natarajan S. Studies on dielectric relaxation in ceramic multiferroic Gd1− xYxMnO3. J. Am. Ceram. Soc. 2017;100:2596–2603. doi: 10.1111/jace.14758. [DOI] [Google Scholar]
- 33.Vilarinho R, Queiros EC, Almeida A, Tavares PB, Guennou M, Kreisel J, Agostinho Moreira J. Scaling spin–phonon and spin–spin interactions in magnetoelectric Gd1− xYxMnO3. J. Solid State Chem. 2015;228:76–81. doi: 10.1016/j.jssc.2015.04.028. [DOI] [Google Scholar]
- 34.Vilarinho R, Almeida A, Machado da Silva JM, Oliveira JB, Sa MA, Tavares PB, Agostinho Moreira J. Dzyaloshinskii-Moriya nature of ferroelectric ordering in magnetoelectric Gd1− xYxMnO3 system. Solid State Commun. 2015;208:34–40. doi: 10.1016/j.ssc.2015.02.013. [DOI] [Google Scholar]
- 35.Bos JWG, Van Aken BB, Palstra TTM. Site disorder induced hexagonal-orthorhombic transition in Y3+1-xGd3+xMnO3. Chem. Mater. 2001;13:4804–4807. doi: 10.1021/cm011177a. [DOI] [Google Scholar]
- 36.Karoblis D, Zarkov A, Mazeika K, Baltrunas D, Niaura G, Beganskiene A, Kareiva A. Sol-gel synthesis, structural, morphological and magnetic properties of BaTiO3-BiMnO3 solid solutions. Ceram. Int. 2020;46:16459–16464. doi: 10.1016/j.ceramint.2020.03.209. [DOI] [Google Scholar]
- 37.Chen YL, Yang DP. Mössbauer Effect in Lattice Dynamics: Experimental Techniques and Applications. New York: Wiley-VCH; 2007. [Google Scholar]
- 38.Zaghrioui M, Greneche JM, Autret-Lambert C, Gervais M. Effect of Fe substitution on multiferroic hexagonal YMnO3. J. Magn. Magn. Mater. 2011;323:509–514. doi: 10.1016/j.jmmm.2010.09.055. [DOI] [Google Scholar]
- 39.Sharma N, Das A, Prajapat CL, Meena SS. Spin reorientation behavior in YMn1− xMxO3 (M= Ti, Fe, Ga; x= 0, 0.1) J. Magn. Magn. Mater. 2013;348:120–127. doi: 10.1016/j.jmmm.2013.08.021. [DOI] [Google Scholar]
- 40.Salama HA, Stewart GA, Ryan DH, Elouneg-Jamroz M, Edge AVJ. A Mössbauer spectroscopy investigation of h-YbMnO3. J. Phys. Condens. Matter. 2008;20:255213. doi: 10.1088/0953-8984/20/25/255213. [DOI] [Google Scholar]
- 41.Stewart GA, Salama HA, Voyer CJ, Ryan DH, Scott D, Oneill HSC. A Mössbauer investigation of orthorhombic phase YbMnO3. Hyperfine Interact. 2015;230:195–203. doi: 10.1007/s10751-014-1092-x. [DOI] [Google Scholar]
- 42.Sharma N, Das A, Mishra SK, Prajapat CL, Singh MR, Meena SS. Magnetic and dielectric behavior in YMn1−xFexO3 (x≤ 0.5) J. Appl. Phys. 2014;115:213911. doi: 10.1063/1.4882069. [DOI] [Google Scholar]
- 43.Duttine M, Wattiaux A, Balima F, Decorse C, Moutaabbid H, Ryan DH, Bonville P. Modulated magnetic structure in 57Fe doped orthorhombic YbMnO3: A Mössbauer study. AIP Adv. 2019;9:35008. doi: 10.1063/1.5077005. [DOI] [Google Scholar]
- 44.Shannon RD. Revised effective ionic radii and systematic studies of interatomic distances in halides and chalcogenides. Acta Crystallogr. Sect. A. 1976;32:751–767. doi: 10.1107/S0567739476001551. [DOI] [Google Scholar]
- 45.Vishnuvardhan TK, Kulkarni VR, Basavaraja C, Raghavendra SC. Synthesis, characterization and a.c. conductivity of polypyrrole/Y2O3 composites. Bull. Mater. Sci. 2006;29:77–83. doi: 10.1007/BF02709360. [DOI] [Google Scholar]
- 46.Guo H, Dong N, Yin M, Zhang W, Lou L, Xia S. Visible upconversion in rare earth ion-doped Gd2O3 nanocrystals. J. Phys. Chem. B. 2004;108:19205–19209. doi: 10.1021/jp048072q. [DOI] [Google Scholar]
- 47.Subba Rao GV, Rao CNR. Infrared and electronic spectra of rare earth perovskites. Ortho- Chromites, -Manganites and - Ferrites. Appl. Spectrosc. 1970;24:436–444. doi: 10.1366/000370270774371426. [DOI] [Google Scholar]
- 48.Negi P, Dixit G, Agrawal HM, Kumar H, Srivastava RC, Sati PC, Gupta V, Asokan K. Tuning of structural and optical properties by sintering of multiferroic GdMnO3 precursor. Ferroelectrics. 2017;519:200–208. doi: 10.1080/00150193.2017.1361261. [DOI] [Google Scholar]
- 49.Yakel HL, Koehler WC. On the crystal structure of the manganese (III) trioxides of the heavy lanthanides and yttrium. Acta cryst. 1963;16:957. doi: 10.1107/S0365110X63002589. [DOI] [Google Scholar]
- 50.Iliev MN, Lee HG, Popov VN, Abrashev MV, Hamed A, Meng RL, Chu CW. Raman-and infrared-active phonons in hexagonal YMnO3: experiment and lattice-dynamical calculations. Phys. Rev. B. 1997;56:2488. doi: 10.1103/PhysRevB.56.2488. [DOI] [Google Scholar]
- 51.Andreasson J, Holmlund J, Rauer R, Käll M, Börjesson L, Knee CS, Eriksson AK, Eriksson SG, Rübhausen M, Chaudhury RP. Electron-phonon interactions in perovskites containing Fe and Cr studied by Raman scattering using oxygen-isotope and cation substitution. Phys. Rev. B. 2008;78:235103. doi: 10.1103/PhysRevB.78.235103. [DOI] [Google Scholar]
- 52.Iliev MN, Abrashev MV, Laverdiere J, Jandl S, Gospodinov MM, Wang YQ, Sun YY. Distortion-dependent Raman spectra and mode mixing in RMnO3 perovskites (R= La, Pr, Nd, Sm, Eu, Gd, Tb, Dy, Ho, Y) Phys. Rev. B. 2006;73:64302. doi: 10.1103/PhysRevB.73.064302. [DOI] [Google Scholar]
- 53.Oliveira J, Agostinho Moreira J, Almeida A, Rodrigues VH, Costa MMR, Tavares PB, Bouvier P, Guennou M, Kreisel J. Structural and insulator-to-metal phase transition at 50 GPa in GdMnO3. Phys. Rev. B. 2012;85:52101. doi: 10.1103/PhysRevB.85.052101. [DOI] [Google Scholar]
- 54.Iliev MN, Abrashev MV, Lee HG, Popov VN, Sun YY, Thomsen C, Meng RL, Chu CW. Raman spectroscopy of orthorhombic perovskitelike YMnO3 and LaMnO3. Phys. Rev. B. 1998;57:2872. doi: 10.1103/PhysRevB.57.2872. [DOI] [Google Scholar]
- 55.Hemberger J, Lobina S, Krug von Nidda HA, Ivanov VY, Muhkin AA, Balbashov AM, Loidl A. Complex interplay of 3 d and 4 f magnetism in La1−xGdxMnO3. Phys. Rev. B. 2004;70:24414. doi: 10.1103/PhysRevB.70.024414. [DOI] [Google Scholar]
- 56.Pfannes HD, Gonser U. Goldanskii-Karyagin effect versus preferred orientations (texture) Appl. Phys. 1973;1:93–102. doi: 10.1007/BF00887072. [DOI] [Google Scholar]
- 57.Kimura T, Ishibara S, Shintani H, Arima T, Takahashi KT, Ishizaka K, Yokura Y. Distorted perovskite with e g 1 configuration as a frustrated spin system. Phys. Rev. B. 2003;68:60403. doi: 10.1103/PhysRevB.68.060403. [DOI] [Google Scholar]
- 58.Wang KF, Liu JM, Ren ZF. Multiferroicity: The coupling between magnetic and polarization orders. Adv. Phys. 2009;58:321–448. doi: 10.1080/00018730902920554. [DOI] [Google Scholar]
- 59.Lima AF, Lalic MV. Ground-state magnetic structure of hexagonal YMnO3 compound: A non-collinear spin density functional theory study. J. Magn. Magn. Mater. 2016;416:236–240. doi: 10.1016/j.jmmm.2016.05.038. [DOI] [Google Scholar]
- 60.Mochizuki M, Furukawa N. Microscopic model and phase diagrams of the multiferroic perovskite manganites. Phys. Rev. B. 2009;80:134416. doi: 10.1103/PhysRevB.80.134416. [DOI] [Google Scholar]
- 61.Colson D, Forget A, Bonville P. The modulated antiferromagnetic structures in multiferroic FeVO4: A 57Fe Mössbauer spectroscopy investigation. J. Magn. Magn. Mater. 2015;378:529–534. doi: 10.1016/j.jmmm.2014.11.078. [DOI] [Google Scholar]
- 62.Blume M. Stochastic theory of line shape: generalization of the Kubo-Anderson model. Phys. Rev. 1968;174:351. doi: 10.1103/PhysRev.174.351. [DOI] [Google Scholar]
- 63.Blume MJ, Tjon A. Mössbauer spectra in a fluctuating environment. Phys. Rev. 1968;165:446. doi: 10.1103/PhysRev.165.446. [DOI] [Google Scholar]
Associated Data
This section collects any data citations, data availability statements, or supplementary materials included in this article.