

Abstract
Myelodysplastic syndromes (MDS) are a heterogeneous group of hematopoietic stem cell disorders for which allogeneic hematopoietic cell transplantation (HCT) is currently the sole curative treatment. Epigenetic lesions are considered a major pathogenetic determinant in many cancers, and in MDS, epigenetic-based interventions have emerged as life-prolonging therapies. However, the impact of epigenomic aberrations on HCT outcomes among patients with MDS are not well understood. We hypothesized that epigenomic signatures in MDS patients before undergoing HCT serve as a novel prognostic indicator of the risk of post-HCT MDS relapse. To evaluate these epigenomic signatures in MDS patients, we analyzed reduced representation bisulfite sequencing profiles in a matched case-control population of 94 patients. Among these HCT recipients, 47 patients with MDS who relapsed post-HCT (cases) were matched 1:1 to patients with MDS who did not relapse (controls). Only patients with wild-type TP53, RAS pathway, and JAK2 mutations were included in this study to promote the discovery of novel factors. Cases were matched with controls based on conditioning regimen intensity, age, sex, Revised International Prognostic Scoring System, Karnofsky Performance Status, graft type, and donor type. Pre-HCT whole-blood samples from cases and matched controls were obtained from the Center for International Blood and Marrow Transplant Research repository. We comprehensively identified differentially methylated regions (DMRs) by comparing the methylation patterns among matched cases and controls. Our findings show that cases displayed more hyper-DMRs pretransplantation compared with controls, even after adjusting for pre-HCT use of hypomethylating agents. Hyper-DMRs specific to cases were mapped to the transcription start site of 218 unique genes enriched in 5 different signaling pathways that may serve as regions of interest and factors to consider as prognostic determinants of post-HCT relapse in MDS patients. Interestingly, although patients selected for this cohort were wild-type for the TP53 gene, cases showed significantly greater levels of methylation at TP53 compared with controls. These findings indicate that previously identified prognostic genes for MDS, such as TP53, may affect disease relapse not only through genetic mutation, but also through epigenetic methylation mechanisms.
Keywords: Myelodysplastic syndromes, Hematopoietic cell, transplantation, Transplantation outcome, DNA methylation, Epigenomics, TP53
INTRODUCTION
Myelodysplastic syndromes (MDS) are a heterogeneous group of sporadic and typically late-onset clonal hematopoietic progenitor disorders that cause insufficient myeloid, erythroid, and thrombocyte differentiation. In addition to complications from progressive transfusion dependence, patients with MDS have an increased risk of acute myelogenous leukemia (AML) [1]. Approximately 10,000 adults are diagnosed with MDS in the United States each year [2]. The prognosis for individuals with MDS is stratified according to disease- and patient-specific risk factors. The Revised International Prognostic Scoring System algorithm is commonly used to predict overall survival, which ranges from less than 1 year to more than 8 years from diagnosis [3,4].
Current therapy for adults with MDS varies from watchful waiting for those with very low-risk disease, through growth factor support, red cell and platelet transfusion, hypomethylating agent (HMA) therapy, intensive chemotherapy, and allogeneic hematopoietic cell transplantation (allo-HCT) for high-risk or very-high-risk disease. Although HMA therapy improves survival and reduces the need for transfusions, allo-HCT remains the sole available curative-intent treatment for MDS. Previous studies have shown that genetic mutations in the TP53, RAS pathway, and JAK2 genes strongly correlate with poor post-transplantation outcomes [5]. However, among patients with wild-type TP53, RAS pathway, and JAK2 genes, any further explanation for poor outcomes post allo-HCT was not determined.
Epigenetic mechanisms control the spatial organization and transcriptional programming of genomes through reversible, covalent modification of DNA. MDS are characterized by epigenetic aberrations, specifically DNA hypermethylation. Hypermethylation results in transcriptional repression at proximal genes. DNA methylation is highly correlated with chronological age and clonal hematopoiesis and is also one of the most critical risk factors for MDS progression to AML [6–10]. The striking effect of methylation provides a rationale for the use of HMA therapy for these diseases.
We hypothesize that epigenomic signatures in patients with MDS before undergoing HCT serve as a novel prognostic indicator of post-HCT MDS relapse risk. To evaluate these epigenomic signatures in MDS patients, we used reduced representation bisulfite sequencing to identify genome-wide methylation profiles. We leveraged this whole-genome methylation data in a matched case-control population from the Center for International Blood and Marrow Transplant Research (CIBMTR) for patients undergoing HCT with wild-type TP53, RAS pathway, and JAK2 genes [5] to determine novel prognostic factors in post-HCT MDS relapse risk in the epigenomic arena where previous genomic analyses were unable to further risk-stratify patients.
METHODS
Cohort Selection
To investigate previously undiscovered pretransplantation determinants of post allo-HCT MDS relapse, we selected a group of 94 MDS patients who were previously identified as wild-type for TP53, RAS pathway, and JAK2 mutations [5]. In this previous study, confirmation of the wild-type status of TP53, RAS pathway, and JAK2 genes for this cohort was performed through a targeted sequencing approach. The population was stratified by disease relapse status (cases versus controls) and matched on patient age ±5 years, conditioning regimen, Revised International Prognostic Scoring System, Karnofsky Performance Status, donor and graft type, and duration of post-HCT follow-up. Characteristics of the patient cohort are presented in Table 1, where 47 patients with MDS who relapsed post-HCT (cases) were matched 1:1 to MDS patients who did not relapse (controls). In the control group, no clinical evidence of disease relapse was reported within 5 years after allo-HCT. The Pearson chi-square test was used for comparing discrete variables, and the Kruskal-Wallis test was used for comparing continuous variables. The study was approved by the National Marrow Donor Program’s Institutional Review Board and conducted in accordance with the Declaration of Helsinki.
Table 1.
Characteristics of 94 MDS Patients without TP53/RAS Pathway/JAK2 Gene Mutations and Split in Cases versus Controls*
| Variable | Controls | Cases |
|---|---|---|
| Number of patients | 47 | 47 |
| IPSS-R score, n (%) | ||
| Very low | 4 (9) | 4 (9) |
| Low | 14 (30) | 14 (30) |
| Intermediate | 23 (49) | 23 (49) |
| High | 5 (11) | 5 (11) |
| Very high | 1 (2) | 1 (2) |
| Recipient age at transplantation, yr | ||
| 50–59, n (%) | 9 (19) | 9 (19) |
| 60+, n (%) | 38 (81) | 38 (81) |
| Median (range) | 64 (53–70) | 64 (53–70) |
| Recipient race, n (%) | ||
| Caucasian | 43 (93) | 46 (98) |
| Recipient sex, n (%) | ||
| Male | 29 (62) | 30 (64) |
| Karnofsky Performance Status, n (%) | ||
| 90–100 | 31 (66) | 31 (66) |
| Donor product source, n (%) | ||
| HLA-identical sibling and PBSCs | 3 (6) | 3 (6) |
| 8/8 URD and PBSCs | 44 (94) | 44 (94) |
| Conditioning regimen intensity, n (%) | ||
| Myeloablative | 16 (34) | 16 (34) |
| Reduced intensity | 31 (66) | 31 (66) |
| Year of transplantation, n (%) | ||
| 2004–2005 | 1 (2) | 0 |
| 2006–2007 | 3 (6) | 5 (11) |
| 2008–2009 | 7 (15) | 9 (19) |
| 2010–2011 | 11 (23) | 3 (6) |
| 2012–2013 | 25 (53) | 30 (64) |
| Pre-HCT HMA and chemotherapy, n (%) | ||
| HMA only | 27 (57) | 34 (72) |
| Chemotherapy only | 1 (2) | 1 (2) |
| HMA and chemotherapy | 4 (9) | 1 (2) |
| None | 15 (32) | 11 (23) |
IPSS-R indicates Revised International Prognostic Scoring System; PBSCs, peripheral blood stem cells; URD, unrelated donor.
Cases and controls were matched on follow-up from diagnosis to relapse.
DNA Collection, Extraction, and Methylation Sequencing
Peripheral whole blood samples were collected before administration of the preparative conditioning regimen for allo-HCT and processed centrally at the CIBMTR repository using standard operating procedures. Genomic DNA was extracted from these whole blood samples, and methylation sequencing was performed. DNA (150 to 300 ng) was digested at CpG motifs with MspI (10 U, R0106L; New England BioLabs, Ipswich, MA). Digested fragments underwent end repair and A-tailing with Klenow fragment polymerase (5 U, M0212S; New England BioLabs) and overnight ligation with TruSeq adapters (Illumina, San Diego, CA) containing next-generation barcode sequences. DNA cleanup and fragment size selection were completed using Agencourt AMPure beads (Beckman Coulter, Indianapolis, IN) at 2× beads to sample volume. Samples were then processed twice for bisulfite conversion using the EpiTect Bisulfite conversion kit (Qiagen, Hilden, Germany). Once DNA cleanup was completed, relative abundance (SYBR Green qPCR; Bio-Rad, Hercules, CA) and PCR amplification of the products (Pfu Turbo; Agilent, Wilmington, DE) were performed. Libraries were pooled in equimolar ratios and underwent size selection using 1.2× and 0.7× Agencourt AMPure beads (Beckman Coulter) to enrich for 150- to 500-bp products. Final assessment and quantification of the reduced representation bisulfite sequencing libraries was completed with qPCR, fluorescence measurements, and a Bioanalyzer 2100 DNA high-sensitivity assay (Agilent). Next-generation sequencing was completed on an Illumina HiSeq 2500 DNA sequencer. Paired-end sequencing of 125-bp reads was generated at >10× sequencing depth.
Analytical Pipeline
The Bismark bioinformatics toolkit [11] was used to trim sequencing adaptors and align sequencing reads to the human reference genome for calling methylation profiles. After quality control, low-coverage CpG sites (defined as <10 methylation calls) were excluded during the identification of differentially methylated regions (DMRs). A Python application, methylPrep, was built to aggregate shared CpG sites into groups. The Methylkit R package [12] was applied to identify DMRs (50-bp intervals), with at least a 25% difference in methylation calls [13,14]. DMRs are defined as regions with significantly differential methylation between a case and its matched control. DMR annotation was processed to identify the genomic regional distribution of DMRs by the Genomation R package [15] and also to identify genes that potentially could be impacted by DMRs. Subsequently, these genes were used for pathway enrichment analysis (P <.05) using Reactome pathway analysis [16].
RESULTS
Cases Have More Hypermethylated Regions Than Controls
Variation in genome-wide methylation was defined by first delineating the genome into regions of 50-bp intervals and then filtering for regions with at least a 25% difference in methylation calls between cases and controls. A higher number of hypermethylated regions than hypomethylated regions (P = 2.86E-04) was observed comparing each relapsed case with the respective matched nonrelapsed control. There were many thousands of hyper-DMRs and hypo-DMRs, and the dominant pattern was hypermethylation in cases (Figure 1A).
Figure 1.
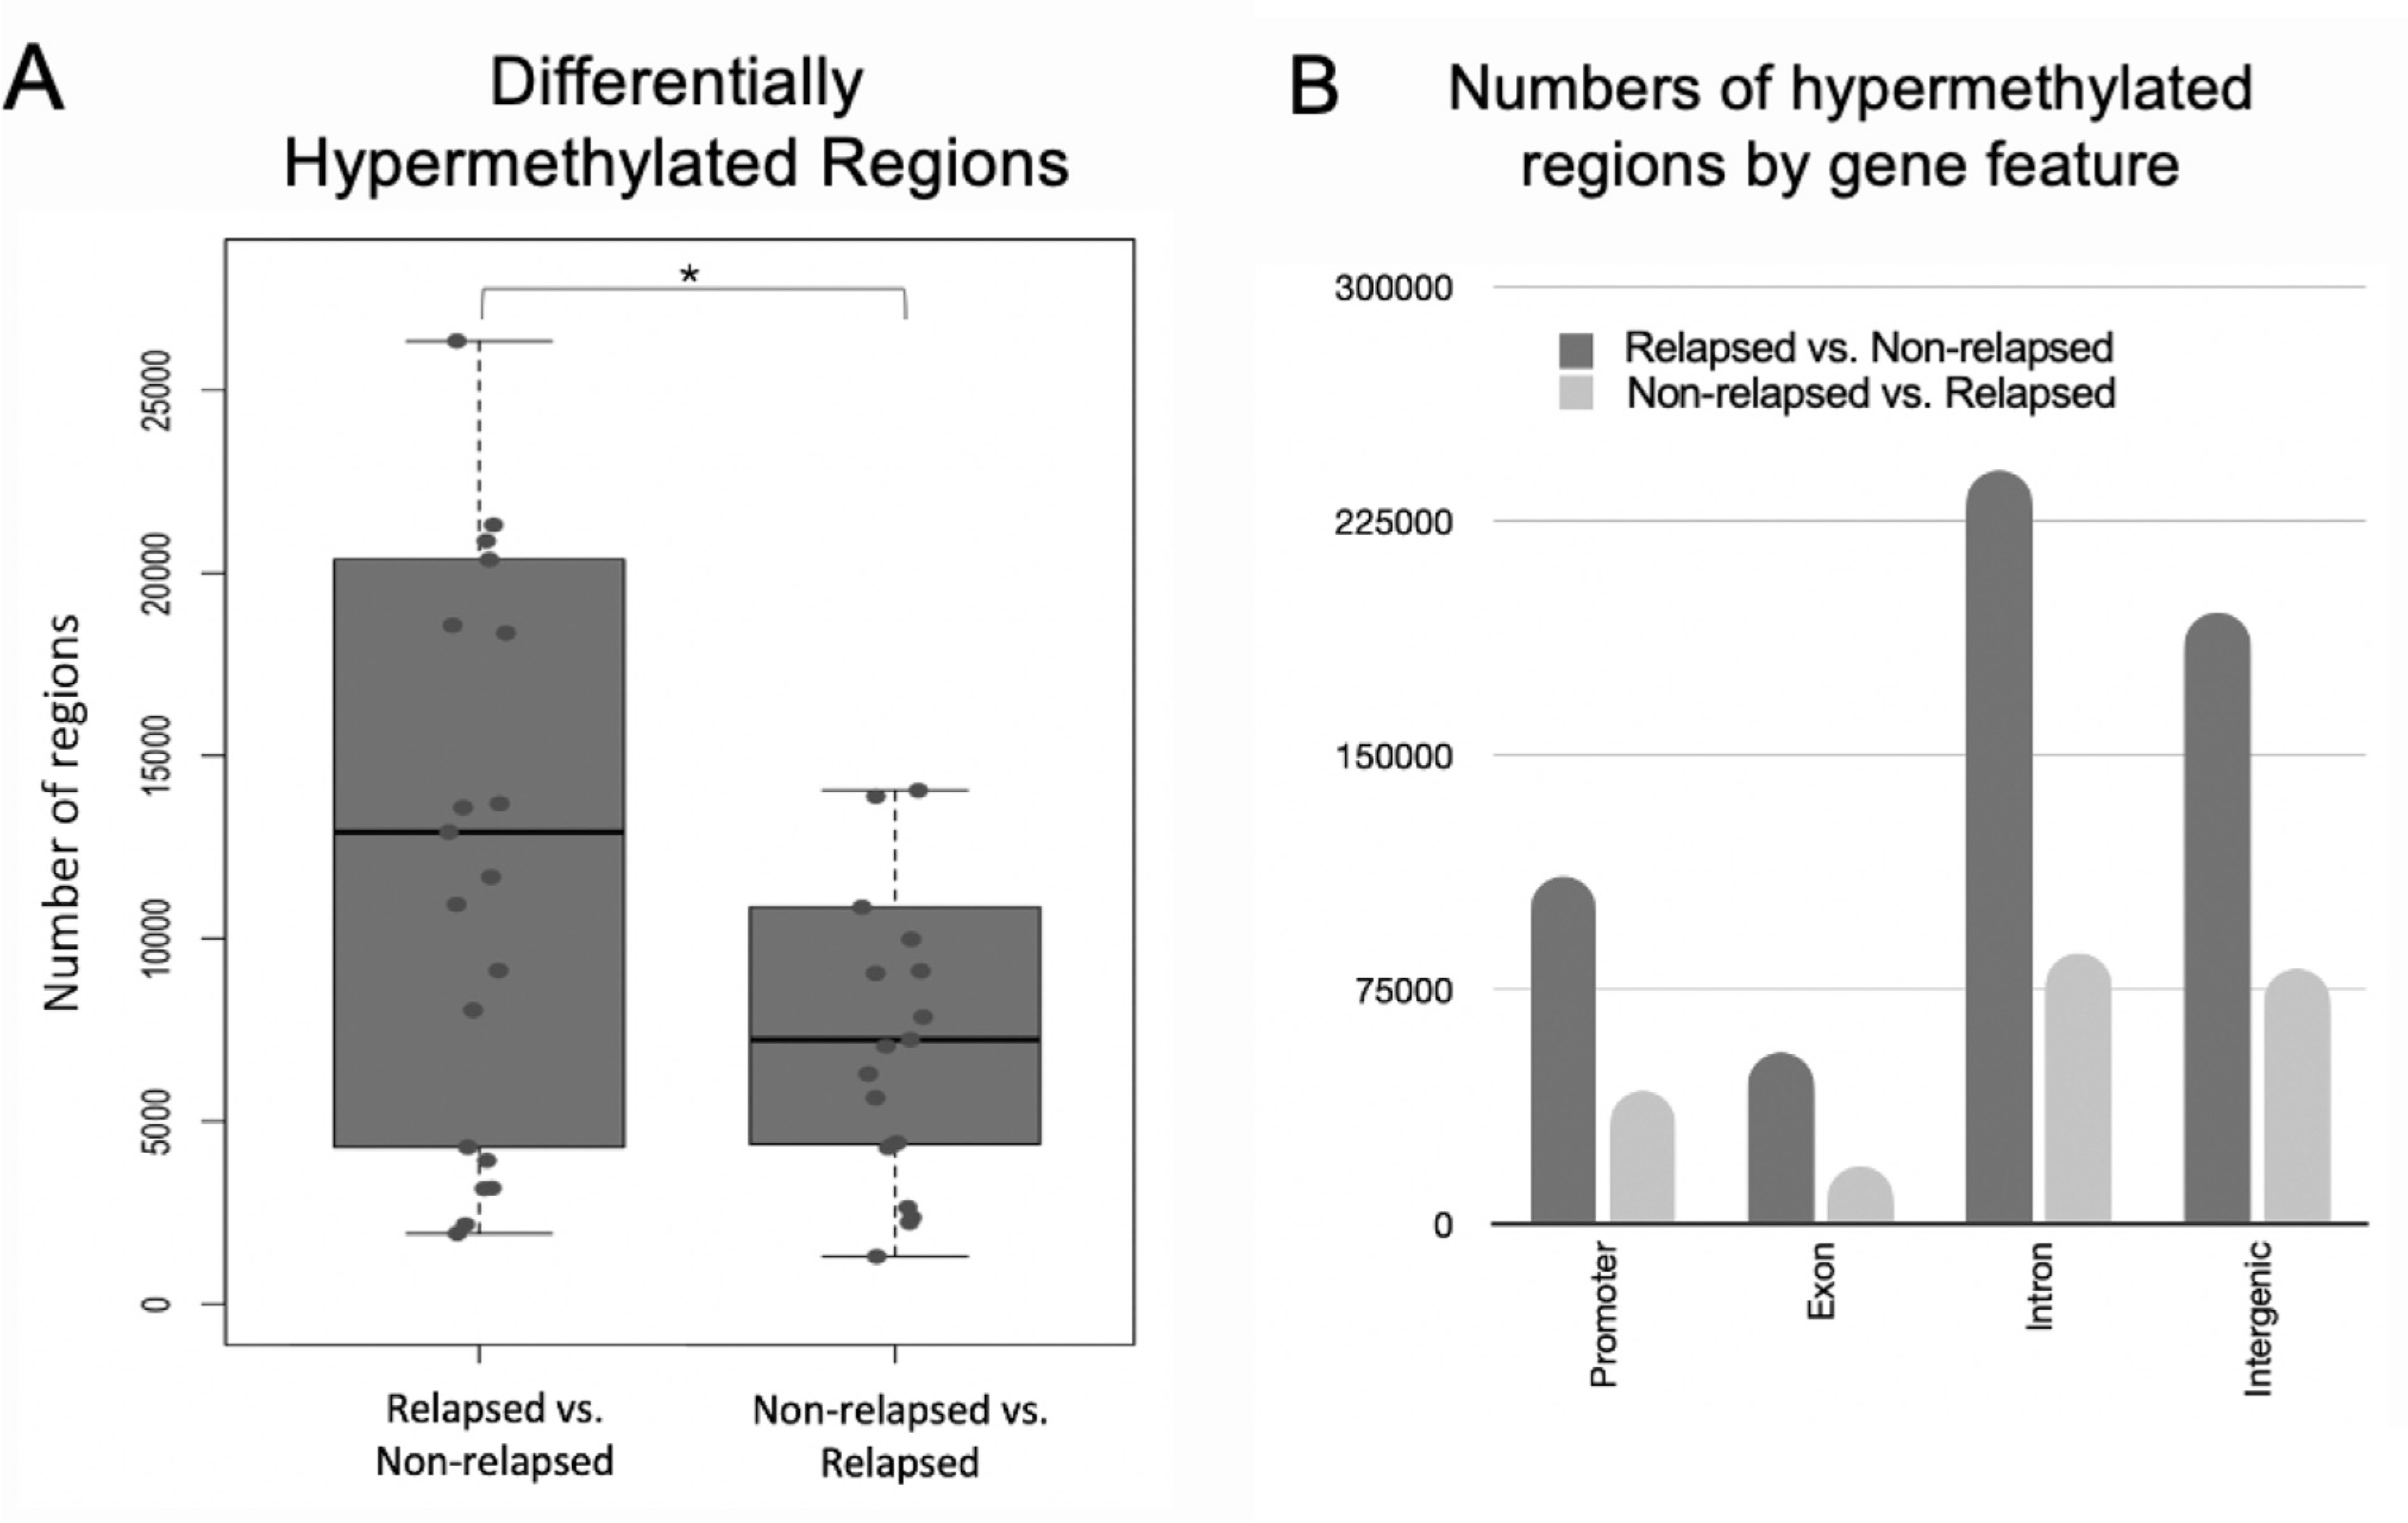
Distribution of DMRs in cases (relapsed) and controls (nonrelapsed). (A) There were more regions of hypermethylation in cases compared with controls than in the reverse direction. (B) Total number of differentially methylated cytosines by genomic features, with the ratio of hypermethylation in cases versus controls in dark gray and vice versa in light yellow. DMRs were enriched in promoters.
Promoter Regions are Enriched for Hyper-DMRs among Cases
Cases displayed significantly greater levels of hypermethylation compared with controls in the promoter, exon, intron, and intergenic regions genome-wide (Figure 1B). We noted that a large proportion (19%) of hypermethylated regions resided in the promotor region (Figure 1B), a relatively small portion of the genome. These hypermethylated regions mapped to the transcription start site (TSS) of 218 unique genes (Supplementary Table S1), including TP53, RIPK1, TNSF10, and CEBPA. These genes were overrepresented (P < .05) in MDS/AML-related signaling pathways, including TP53, RAS, MAPK, TGF, and TNF pathways (Supplementary Table S2).
Preferential Hypermethylation at the TSS of TP53 in Pretransplantation Samples of Cases
Because TP53 plays such a large role in MDS outcomes, we explored both hyper-DMRs and hypo-DMRs specifically in the TP53 gene region. We observed 7 hyper-DMRs and 4 hypo-DMRs in the case versus control direction near TP53. More than one-half of these hyper-DMRs were located in the TSS, and one was located in exon 2 (Figure 2A). The DMRs shown here represent significant DMRs detected in pretransplantation samples derived from cases and controls, where hyper-DMRs displayed higher methylation in the cases than in the controls and vice versa for hypo-DMRs. These bars indicate mean values of differentially methylated cytosine regions across cases and controls and do not represent individual samples.
Figure 2.
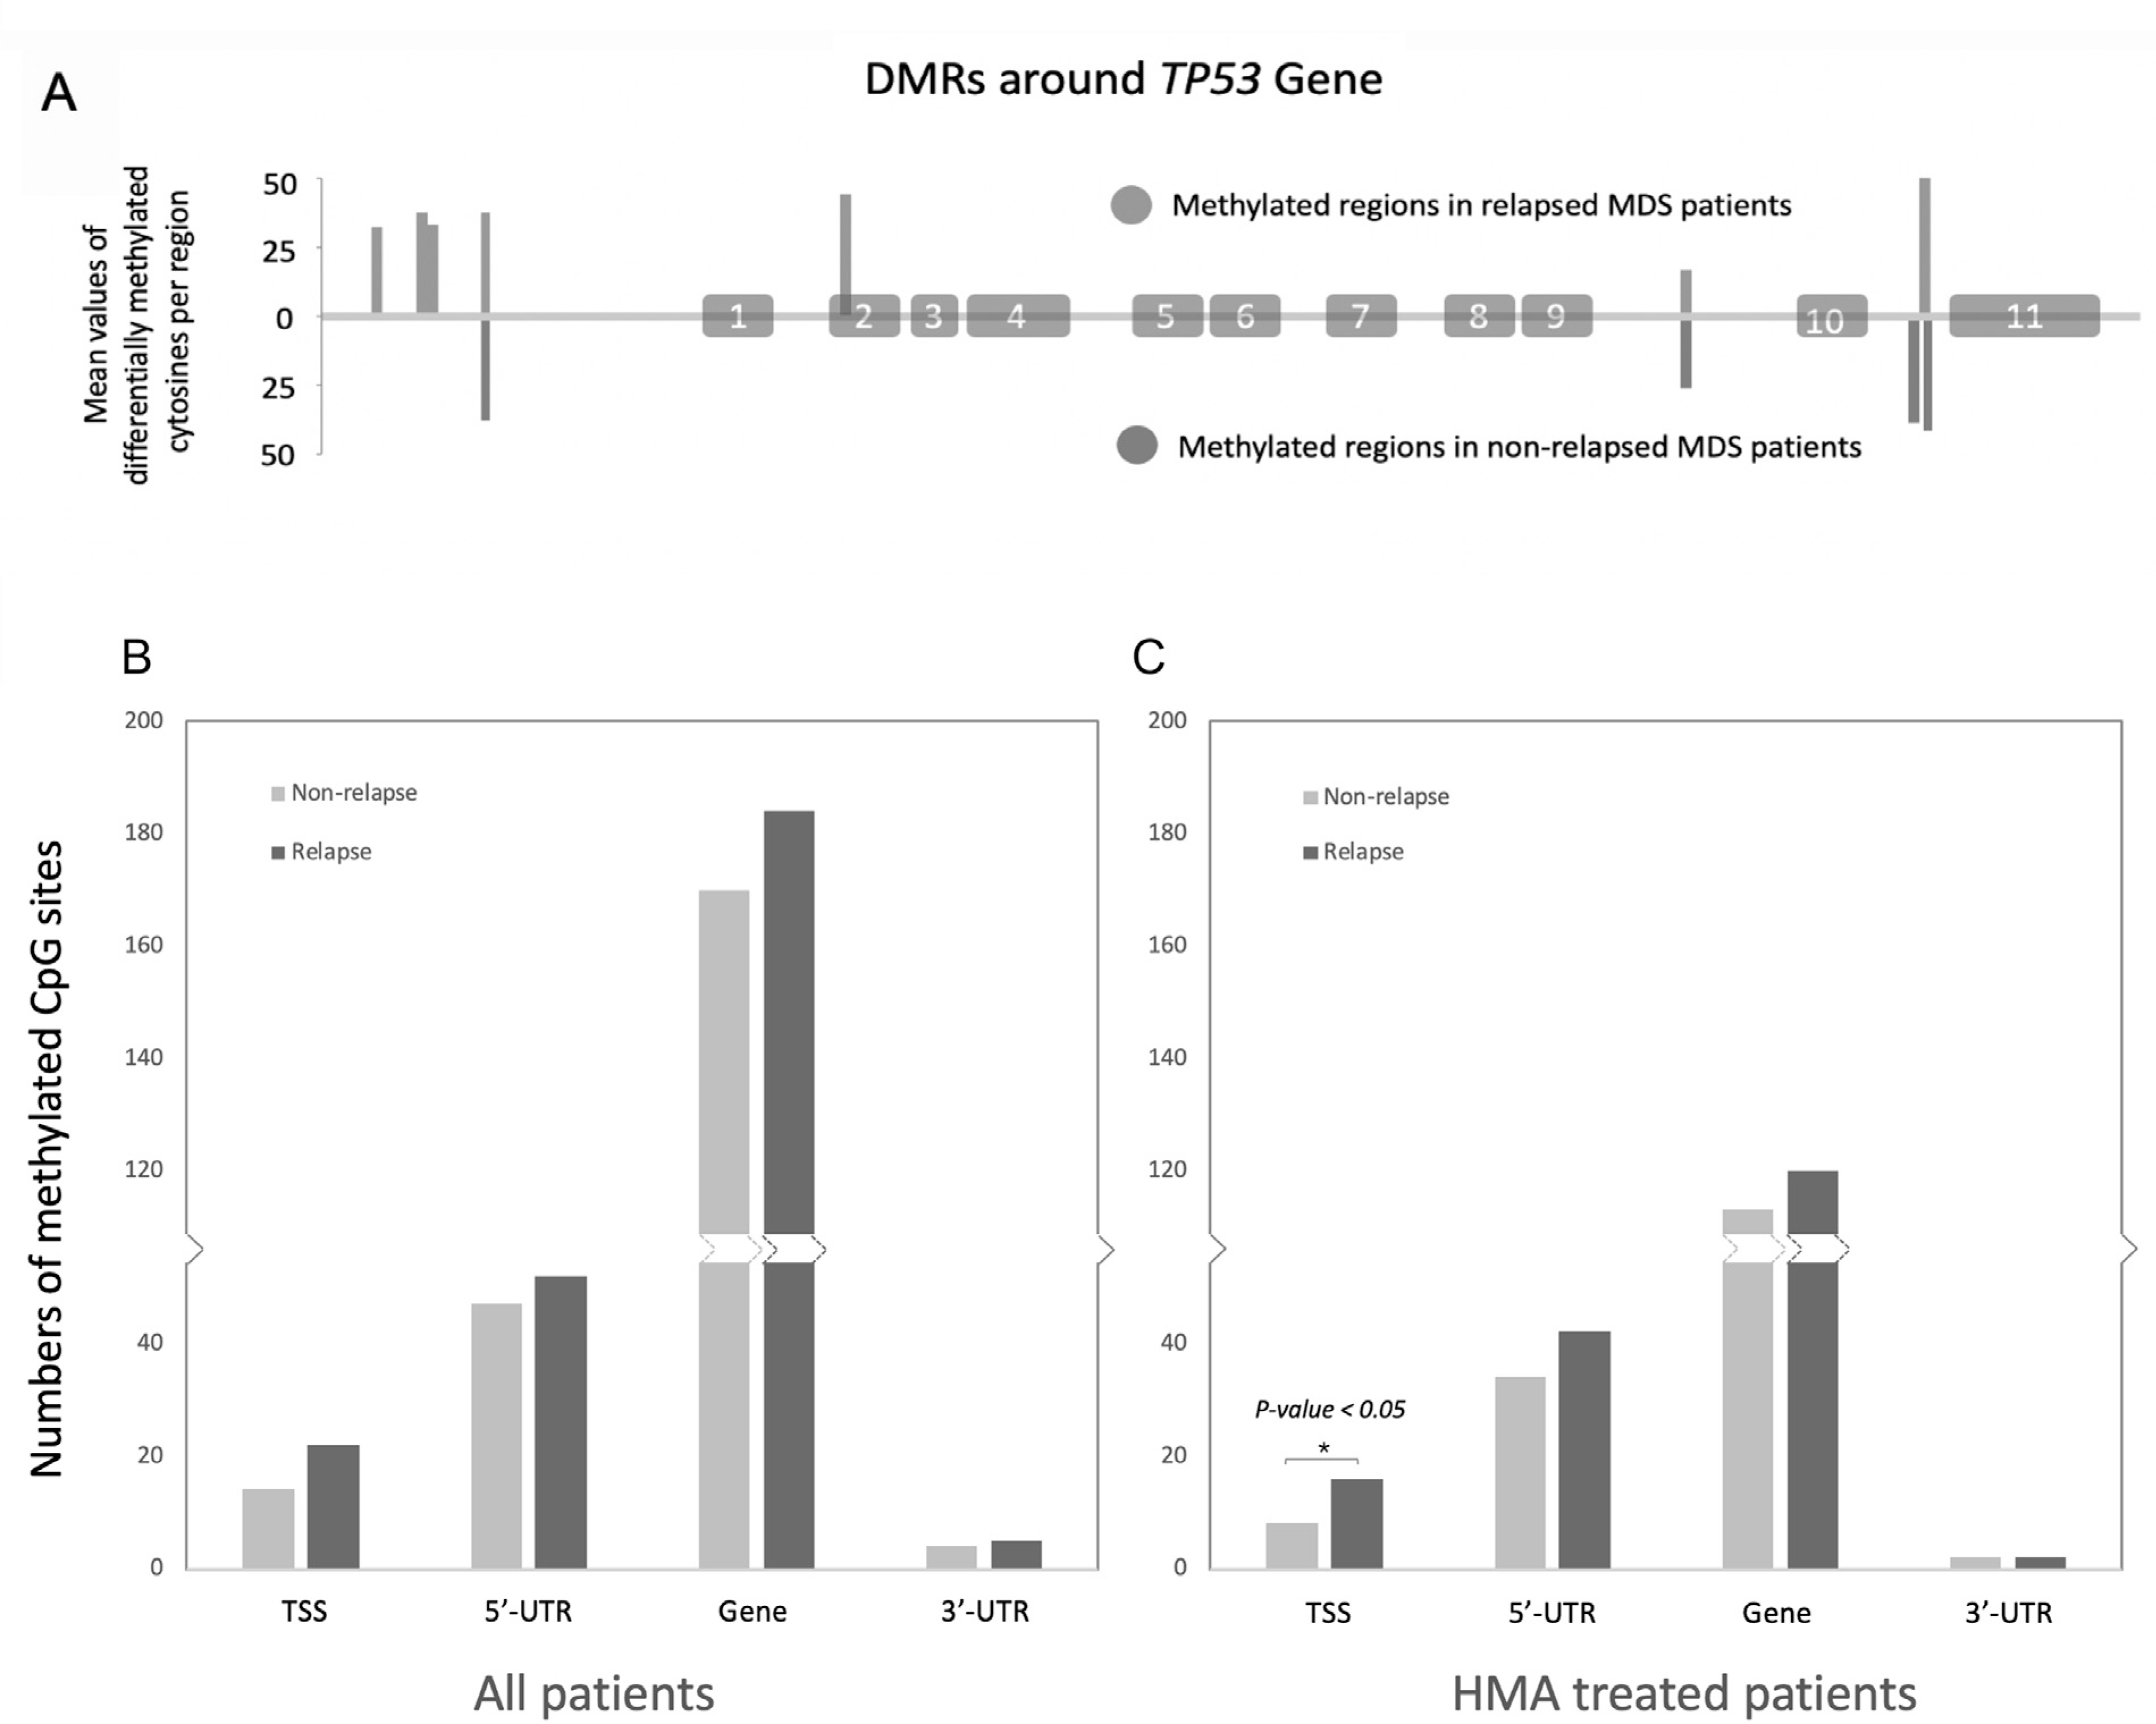
Significantly more hypermethylated cytosines compared with hypomethylated cytosines were detected in the transcription start site of TP53 in cases (relapsed) versus controls (nonrelapsed). (A) DMRs near TP53 with exons numbered where hypermethylated regions are shown above the horizontal line, and hypomethylated regions appear below the line. (B) Differentially methylated regions by genomic feature near TP53 (hypermethylated shown in dark gray, hypomethylated in light gray). (C) As in (B) but considering only patients treated with HMA.
Methylation Differences in Cases versus Controls Are Agnostic of HMA Treatment
Because many patients receive HMA treatment before transplantation, and to account for potential HMA treatment bias, we specifically examined methylation levels in the subset of patients treated with HMA. Among HMA-treated patients, cases still showed more hyper-DMRs than hypo-DMRs (P = 2.45E-02). For all patients as well as HMA-treated patients (Figure 2B,C), more methylated CpG sites were detected at gene features near TP53 in cases versus controls (P < .05). Thus, the methylations differences detected in cases versus controls before transplantation were agnostic of HMA treatment.
DISCUSSION
In a nested case-control study, we analyzed the impact of novel epigenomic risk factors on post-allo-HCT relapse in a cohort of MDS patients who were wild-type for TP53, RAS pathway, and JAK2 gene mutations and were 1:1 matched on established clinical prognostic factors. Other studies have shown that global hypermethylation in MDS patients may reduce the expression of tumor suppressors [17,18]. Our results identify differentially methylated regions between cases and controls, especially hypermethylation in promoter regions that may be involved in down-regulation of gene expression. These promoter DMRs may serve as novel prognostic factors of allo-HCT outcomes.
Despite the exclusion of patients with genetic mutations in TP53, RAS pathway, and JAK2 genes, our results show that these genes and pathways still may play a critical role through epigenomic/methylation mechanisms. A significant number of DMRs were detected in these regions between cases and controls. Specifically, a higher number of hypermethylated cytosines were detected at TP53 in cases versus controls. These data suggest that epigenetic factors may provide new insight into determinants of allo-HCT outcomes, even among patients with wild-type TP53 genes. Here we present a model in which either genetic mutation or hypermethylation in key genes can lead to MDS disease relapse after allo-HCT (Figure 3).
Figure 3.
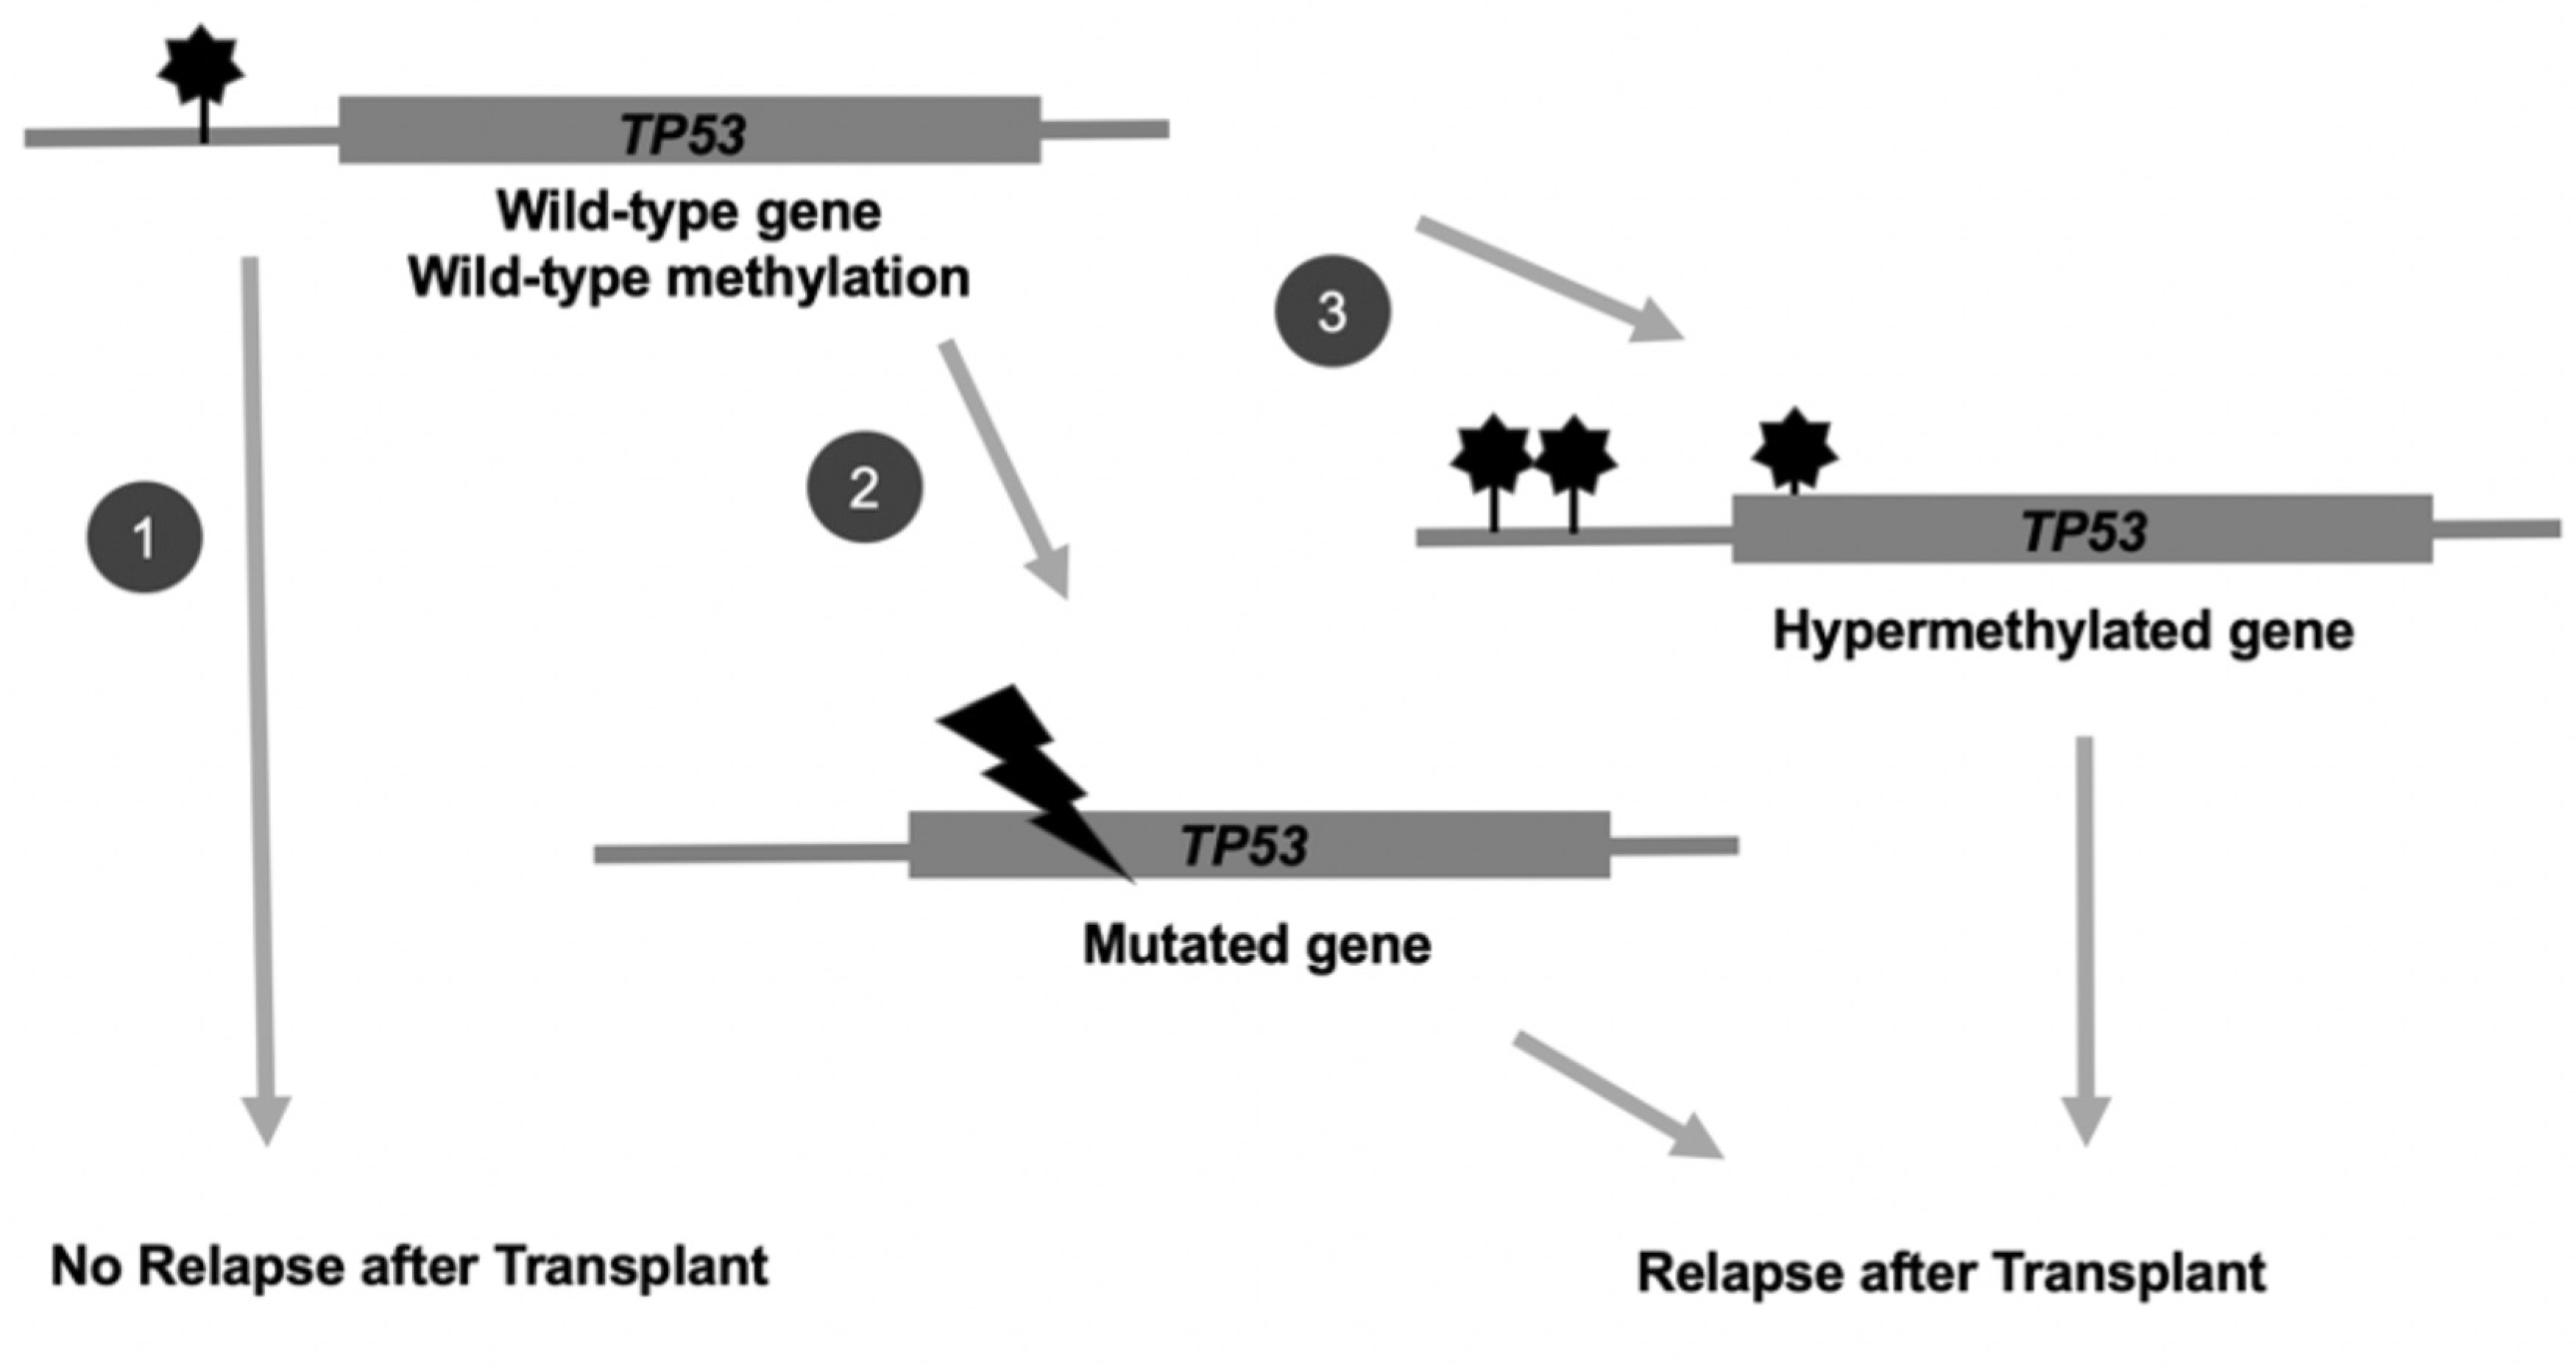
Transplantation outcomes in MDS patients may be determined by the presence of genetic mutations or epigenetic hypermethylation in key prognostic genes, such as TP53. In scenario (1), patients with the wild-type TP53 gene at wild-type methylation levels pretransplantation do not experience relapse post-transplantation. However, those patients with (2) genetic mutations at TP53 or (3) hypermethylation at TP53 pretransplantation are at increased risk of MDS disease relapse post-transplantation.
The status of DNA methylation in many genes is associated with survival and therapy response in MDS patients in whom decreases in methylation are predictive of better outcomes [19,20]. Treatment of patients with DNA methyltransferase inhibitors has long been the standard of care to improve survival for most MDS patients [21]. Although we show that the presence or absence of treatment with HMA therapy did not change the key differences in methylation seen between our cases and controls, we did not have details of specific HMA therapy dose or duration which may oversimplify the potential impact of HMA on epigenetic changes. Regarding the pathology of MDS and progression to AML or response to therapies, changes in methylation may activate or inhibit expression of key genes, block or inactivate functional pathways, or release holds to stimulate growth and differentiation. The identification and elucidation of the role of specific potential prognostic epigenetic mutations require further exploration of global methylation patterns and changes to distinguish distinct MDS subtypes [9].
With respect to the potential mode of action for methylation regulation, previous studies have observed that global hypermethylation may reduce the expression of tumor suppressors, such as TP53 and FOXP3 [22], as well as genes that regulate leukocyte telomere length, such as telomere reverse transcriptase (TERT). Indeed, patients with shorter telomeres experience higher post-allo-HCT treatment-related mortality (TRM) [23,24]. Acquired mutations in genes for epigenetic regulators are also implicated in the early stages of MDS evolution. Examples of these mutations and their relative prevalence in MDS include mutations in the genes encoding ASXL1 (20% of MDS) [25], TET methylcytosine dioxygenase 2 (TET2; 15% to 35%) [26,27],and members of the histone-lysine demethylase gene family (KDM5A, KDM6A, and KDM2B; 1% to 4%) [28] and others with differential methylation profiles observed in this study.
Further investigation will add to the validation of the impact and mode of action of these distinct methylation signatures and global methylation patterns in MDS associated with HCT outcomes. In previous MDS studies, high concordance has been found in results from molecular assays between peripheral blood and bone marrow [29,30]. Assessment of overall whole-genome profiles at additional time intervals and disease or transplantation stages would help explore linkages to causal effects. The use of other omics methodologies will also help address the question of whether additional genomic mutations and/or other omics signatures may be prognostic of allo-HCT outcomes in MDS. Because some major methylation effects are known to occur at the step of transcription regulation, hypothesized effects on protein changes could be evaluated through proteomics explorations. These will help shed light on potential mechanisms of action downstream of differences detected in methylation profiles.
These findings provide potential new insights into MDS relapse after allogeneic HCT. Relapse associations with patient methylation profiles before HCT provides potential targets for personalized therapeutic interventions. Especially when narrowed to detection at specific prognostic genes, such as TP53, such testing could become feasible for consideration in realtime therapeutic decision making for MDS patients when multiple avenues forward exist. The addition of methylation testing to the amplification of the marker TP53 gene does not add significant cost to targeted panel testing of DNA methylation sites or genetic variant markers, especially compared with whole-epigenome or genome-wide assays. By adding the striking TP53 methylation marker to a prognostic MDS patient transplantation outcome panel test composed of even a dozen of the top prognostic markers from previous studies, the potential algorithm could be improved over assays and technologies that seek to measure hundreds to thousands of markers. Further investigation through validation in larger populations and evaluation of the individual feature contributions of omics marker associations with MDS patient transplantation outcomes will lead to the development of a predictive algorithm with high translational utility in the future.
Supplementary Material
ACKNOWLEDGMENTS
The authors thank Martin Maiers and Caleb Kennedy for early involvement in project setup and Nara Rao for infrastructure support.
Financial disclosure:
Support for this study was provided by Office of Naval Research Grant Awards N00014-17-1-2850, N00014-20-1-2705, and N00014-20-1-2832. The views expressed in this article do not reflect the official policy or position of the Department of the Navy, the Department of Defense, or any other agency of the US Government. The CIBMTR also obtains support from the Public Health Service U24CA076518 from the National Cancer Institute (NCI), the National Heart, Lung and Blood Institute (NHLBI) and the National Institute of Allergy and Infectious Diseases (NIAID), and HHSH250201700006C from the Health Resources and Services Administration (HRSA).
Conflict of interest statement:
Dr. Nazha declares Jazz Pharmaceuticals for research support, Incyte and Novartis for Speakers Bureau, MEI for the Data Monitoring Committee, Karyopharma, Tolero, Abbvie and Daiichi Sankyo for Advisory Board or consulting. Dr. Carlson is a member of the NMDP IRB. All other authors have no interest conflicts to declare for this manuscript.
Footnotes
SUPPLEMENTARY MATERIALS
Supplementary material associated with this article can be found in the online version at doi:10.1016/j.jtct.2021.04.027.
REFERENCES
- 1.Menssen AJ, Walter MJ. Genetics of progression from MDS to secondary leukemia. Blood. 2020;136:50–60. [DOI] [PMC free article] [PubMed] [Google Scholar]
- 2.Ma X, Does M, Raza A, Mayne ST. Myelodysplastic syndromes: incidence and survival in the United States. Cancer. 2007;109:1536–1542. [DOI] [PubMed] [Google Scholar]
- 3.Greenberg PL, Tuechler H, Schanz J, et al. Revised International Prognostic Scoring System for myelodysplastic syndromes. Blood. 2012;120: 2454–2465. [DOI] [PMC free article] [PubMed] [Google Scholar]
- 4.Schanz J, Tüchler H, Solé F, et al. New comprehensive cytogenetic scoring system for primary myelodysplastic syndromes (MDS) and oligoblastic acute myeloid leukemia after MDS derived from an international database merge. J Clin Oncol. 2012;30:820–829. [DOI] [PMC free article] [PubMed] [Google Scholar]
- 5.Lindsley RC, Saber W, Mar BG, et al. Prognostic mutations in myelodysplastic syndrome after stem-cell transplantation. N Engl J Med. 2017;376:536–547. [DOI] [PMC free article] [PubMed] [Google Scholar]
- 6.Jiang Y, Dunbar A, Gondek LP, et al. Aberrant DNA methylation is a dominant mechanism in MDS progression to AML. Blood. 2009;113: 1315–1325. [DOI] [PMC free article] [PubMed] [Google Scholar]
- 7.Ketkar S, Verdoni AM, Smith AM, et al. Remethylation of Dnmt3a (-/-) hematopoietic cells is associated with partial correction of gene dysregulation and reduced myeloid skewing. Proc Natl Acad Sci U S A. 2020;117:3123–3134. [DOI] [PMC free article] [PubMed] [Google Scholar]
- 8.Maegawa S, Gough SM, Watanabe-Okochi N, et al. Age-related epigenetic drift in the pathogenesis of MDS and AML. Genome Res. 2014;24:580–591. [DOI] [PMC free article] [PubMed] [Google Scholar]
- 9.Reilly B, Tanaka TN, Diep D, et al. DNA methylation identifies genetically and prognostically distinct subtypes of myelodysplastic syndromes. Blood Adv. 2019;3:2845–2858. [DOI] [PMC free article] [PubMed] [Google Scholar]
- 10.Zhang X, Su J, Jeong M, et al. DNMT3A and TET2 compete and cooperate to repress lineage-specific transcription factors in hematopoietic stem cells. Nat Genet. 2016;48:1014–1023. [DOI] [PMC free article] [PubMed] [Google Scholar]
- 11.Krueger F, Andrews SR. Bismark: a flexible aligner and methylation caller for Bisulfite-Seq applications. Bioinformatics. 2011;27:1571–1572. [DOI] [PMC free article] [PubMed] [Google Scholar]
- 12.Akalin A, Kormaksson M, Li S, et al. methylKit: a comprehensive R package for the analysis of genome-wide DNA methylation profiles. Genome Biol. 2012;13:R87. [DOI] [PMC free article] [PubMed] [Google Scholar]
- 13.BLUEPRINT consortium. Quantitative comparison of DNA methylation assays for biomarker development and clinical applications. Nat Biotechnol. 2016;34:726–737. [DOI] [PubMed] [Google Scholar]
- 14.Singer BD. A practical guide to the measurement and analysis of DNA methylation. Am J Respir Cell Mol Biol. 2019;61:417–428. [DOI] [PMC free article] [PubMed] [Google Scholar]
- 15.Akalin A, Franke V, Vlahoviček K, Mason CE, Schübeler D. Genomation: a toolkit to summarize, annotate and visualize genomic intervals. Bioinformatics. 2015;31:1127–1129. [DOI] [PubMed] [Google Scholar]
- 16.Sidiropoulos K, Viteri G, Sevilla C, et al. Reactome enhanced pathway visualization. Bioinformatics. 2017;33:3461–3467. [DOI] [PMC free article] [PubMed] [Google Scholar]
- 17.Esteller M. Epigenetic gene silencing in cancer: the DNA hypermethylome. Hum Mol Genet. 2007;16:R50–R59. Spec No 1. [DOI] [PubMed] [Google Scholar]
- 18.Lopez-Serra P, Esteller M. DNA methylation-associated silencing of tumor-suppressor microRNAs in cancer. Oncogene. 2012;31:1609–1622. [DOI] [PMC free article] [PubMed] [Google Scholar]
- 19.Shen L, Kantarjian H, Guo Y, et al. DNA methylation predicts survival and response to therapy in patients with myelodysplastic syndromes. J Clin Oncol. 2010;28:605–613. [DOI] [PMC free article] [PubMed] [Google Scholar]
- 20.Cabezon M, Malinverni R, Bargay J, et al. Different methylation signatures at diagnosis in patients with high-risk myelodysplastic syndromes and secondary acute myeloid leukemia predict azacitidine response and longer survival. Clin Epigenetics. 2021;13:9. [DOI] [PMC free article] [PubMed] [Google Scholar]
- 21.Silverman LR. DNA methyltransferase inhibitors in myelodysplastic syndrome. Best Pract Res Clin Haematol. 2004;17:585–594. [DOI] [PubMed] [Google Scholar]
- 22.Xu T, Stewart KM, Wang X, et al. Metabolic control of TH17 and induced Treg cell balance by an epigenetic mechanism. Nature. 2017;548:228–233. [DOI] [PMC free article] [PubMed] [Google Scholar]
- 23.Myllymäki M, Redd RA, Cutler CS, et al. Telomere length and telomerase complex mutations predict fatal treatment toxicity after stem cell transplantation in patients with myelodysplastic syndrome. Blood. 2018;132 (suppl 1):796. [Google Scholar]
- 24.Myllymäki M, Redd R, Reilly CR,et al. Short telomere length predicts non-relapse mortality after stem cell transplantation for myelodysplastic syndrome. Blood. 2020;136:3070–3081. [DOI] [PMC free article] [PubMed] [Google Scholar]
- 25.Cedena MT, Rapado I, Santos-Lozano A, et al. Mutations in the DNA methylation pathway and number of driver mutations predict response to azacitidine in myelodysplastic syndromes. Oncotarget. 2017;8:106948–106961. [DOI] [PMC free article] [PubMed] [Google Scholar]
- 26.Papaemmanuil E, Gerstung M, Malcovati L, et al. Clinical and biological implications of driver mutations in myelodysplastic syndromes. Blood. 2013;122:3616–3627. [DOI] [PMC free article] [PubMed] [Google Scholar]
- 27.Haferlach T, Nagata Y, Grossmann V, et al. Landscape of genetic lesions in 944 patients with myelodysplastic syndromes. Leukemia. 2014;28: 241–247. [DOI] [PMC free article] [PubMed] [Google Scholar]
- 28.Heuser M, Yun H, Thol F. Epigenetics in myelodysplastic syndromes. Semin Cancer Biol. 2018;51:170–179. [DOI] [PMC free article] [PubMed] [Google Scholar]
- 29.Mohamedali AM, Alkhatabi H, Kulasekararaj A, et al. Utility of peripheral blood for cytogenetic and mutation analysis in myelodysplastic syndrome. Blood. 2013;122:567–570. [DOI] [PubMed] [Google Scholar]
- 30.Mohamedali AM, Gäken J, Ahmed M, et al. High concordance of genomic and cytogenetic aberrations between peripheral blood and bone marrow in myelodysplastic syndrome (MDS). Leukemia. 2015;29:1928–1938. [DOI] [PubMed] [Google Scholar]
Associated Data
This section collects any data citations, data availability statements, or supplementary materials included in this article.