

Abstract
Diffusive transport of small ionic species through mucus layers is a ubiquitous phenomenon in physiology. However, some debate remains regarding how the various characteristics of mucus (charge of the polymers themselves, binding affinity of ions with mucus) impact the rate at which small ions may diffuse through a hydrated mucus gel. Indeed it is not even clear if small ionic species diffuse through mucus gel at an appreciably different rate than they do in aqueous solution. Here, we present a mathematical description of the transport of two ionic species (hydrogen and chloride) through a mucus layer based on the Nernst-Planck equations of electrodiffusion. The model explicitly accounts for the binding affinity of hydrogen to the mucus material, as well as the Donnan potential that occurs at the interface between regions with and without mucus. Steady state fluxes of ionic species are quantified, as are their dependencies on the chemical properties of the mucus gel and the composition of the bath solution. We outline a mechanism for generating enhanced diffusive flux of hydrogen across the gel region, and hypothesize how this mechanism may be relevant to the apparently contradictory experimental data in the literature.
1. Introduction.
Diffusion of charged particles through complex materials is a ubiquitous phenomenon in biology, as well as engineering. Mucus is bio-gel comprised of a hydrated network of glycoproteins called mucins, and is a ubiquitous substance throughout many physiological systems. Mucus layers can be found throughout the body, including the gastrointestinal tract, respiratory system, and reproductive organs [1, 8]. Among other functions, mucus layers often act as a transport barrier. Transport (or the prevention thereof) of small ions, larger compounds, or infectious agents across mucus layers plays a critical role in maintaining healthy physiology [1]. Many of these transport phenomena are passive, and thus governed by diffusion. The control of diffusive transport across mucus layers is also of great importance for the design of drug delivery systems [12].
Perhaps the most dramatic illustration of mucus layer properties can be found in the gastric mucus layer of the mammalian stomach. Lining the epithelial surface, a thin layer of mucus (≈ 500 μm thick) segregates the highly acidic lumen (pH ≈ 2) from the environment immediately adjacent to the stomach wall (pH ≈ 7). The ability of the mucus layer to maintain this enormous concentration gradient of hydrogen protons (and thus protect the gastric mucosa from the acidic contents of the stomach) caused gastric mucus to be termed a “diffusion barrier” as many as six decades ago [4]. However, the actual ability of mucus to directly retard molecular diffusion of small dissolved species is still a matter of some debate.
Some in vitro studies claim that the diffusion rate of hydrogen ions through mucus gel may be as low as one quarter that in aqueous solution [9, 13, 18], potentially due to electric interaction between hydrogen protons and mucin polymers, chemical binding between the diffusing species and the gel, or simply steric effects. However, while some experiments indicate that mucus slows hydrogen diffusion by as much as 75%–90%, others only report a 30% reduction in hydrogen flux. More recent studies indicate that hydrogen diffusion through mucus may in fact be as fast or faster than in solution [11]. Various modeling efforts have attempted to explain these conflicting data. Theoretical modifications to diffusion coefficients of small ions in polymer networks, due to steric effects and volume occlusion, are decades old [10], and have been incorporated into sophisticated models of polyelectrolyte gels [3]. However, it is unlikely that steric effects are relevant in physiological systems, due to the relatively small volume fraction of polymeric network in typical mucus gels (≈ 3%). Molecular dynamics simulations have indicated that a relatively sparse, charged polymeric network may dramatically slow the diffusion of a single ionic species, but these effects disappear as other ions (dissolved salt) are added to the system [7]. Conversely, analysis of ion exchange kinetics in charged resin films indicates that in the presence of a larger, “slower” cation, the diffusive flux of a smaller “faster” cation may be reduced [14, 5]. None of these works account for the Donnan electric potential that occurs at the interface between a gel and aqueous solution and is known to impact the behavior of mucus [16]. The Donnan potential has been rigorously accounted for in theoretical studies of the swelling of polyelectrolyte gels in response to ionic bath concentrations [19, 6]. However, these studies are primarily concerned with quantifying the impact that ionic concentrations have on volume phase transitions of the gel (as opposed to the flux of ions through the gel), and do not account for the ability of cations to form bonds with mucin proteins [2].
In this work, we analyze a Nernst-Planck-like model of electrodiffusion of a cationic species (such as hydrogen protons) through a charged, chemically reactive domain, between two baths. The model is meant to recapitulate an in vitro “flux chamber” experiment similar to that used in [13, 18]. We specifically account for the binding and unbinding of the cation to the background gel material, as well as the effects of the Donnan electric potential generated by the interface between a gel domain and a bath. In particular, we quantify the impact that these two effects have on the passive transport of small ionic species, which may be pertinent to diffusion through mucus gels. Steady-state flux of hydrogen from bath to bath is determined as a function of the gel properties (binding affinity and binding site density), as well as bath concentrations. We find that the Donnan potential induced by the interfaces at either end of the gel layer serves to increase the flux of hydrogen across the gel layer. This effect is most pronounced in the case of dense charge on the network and small binding affinity, as the gel exhibits a large excess charge in chemical equilibrium. This effect is attenuated by increased chemical binding to the network. While these results cannot settle the apparent contradiction in experimental measurements of hydrogen diffusion through mucus, they indicate that interfacial potential differences are a dominant factor driving transport through mucus layers (which could vary depending on experimental setup).
2. Mathematical Model.
We investigate the behavior of a diffusive cationic species as it is transported through a domain which contains a stationary, charged material (mucus polymeric network) that the ion may bind to, as well as hydrating interstitial fluid through which the ion may diffuse. The extent of the domain is described by a single spatial variable 0 ≤ X ≤ L. We describe four quantities within the domain: the concentration of a dissolved cation (hydrogen), a dissolved anion (chloride), and concentration of cation bound to the background material (denoted H(x, t), C(x, t), and B(x, t) respectively), as well as the electric potential Ψ. In the limit that the background material occupies zero volume (i.e. a sparse network), the concentration of dissolved ions are described by a Nernst-Planck equation with reaction terms that describe binding/unbinding with the background material (given by the law of mass action). The bound cation concentration is assumed to be stationary, but may change due to binding/unbinding reaction. Finally, all charges within the domain must balance.
| (2.1) |
| (2.2) |
| (2.3) |
| (2.4) |
We note here that as written, Ψ is measured in non-dimensional “thermal voltage” (which may be converted to standard voltage by multiplying by RT/F, where R is the ideal gas constant, T is absolute temperature, and F is the Faraday constant). The parameters Dj are the diffusion coefficient of ion j, k+ and k− are the binding and unbinding rates for hydrogen, and CT is the concentration of binding sites on the background media (and thus the quantity (CT−B) is the concentration of unoccupied binding sites). We assume here that binding sites and negative charge on the background material exist in a one-to-one correspondence. Furthermore, our model implicitly assumes that the charge density is a parameter independent of ionic concentrations, and uniform throughout the layer. In general, mucus networks are known to swell and condense in response to the ionic composition of the bath [16, 17]. However, while divalent salts (such as calcium chloride) can cause dramatic swelling/condensation events and phase transitions, mucus samples exposed to monovalent ionic solutions (like hydrogen chloride) typically only change in volume by approximately 10%. Therefore, it is reasonable to assume that the background network volume (and therefore density) is approximately a constant that does not depend on bath conditions.
Finally, (2.1) and (2.2) must come with accompanying boundary conditions. These are discussed in more detail in subsection 2.3. For now, it suffices to say that we envision the domain of interest being placed between two baths of hydrogen chloride solution of known concentrations. In the left bath, both hydrogen and chloride have concentration (for bath). In the right bath, both exist in concentration . The baths are large enough that flux of ions through the interior domain does not alter these concentrations appreciably, and therefore we consider the system subject to Dirichlet boundary conditions. Finally, boundary conditions must be specified for the electric potential Ψ. Without loss of generality, we assume that electric potential in the left bath Ψ0 = 0, and therefore it is only necessary to specify the potential in the right bath (which we do). We note that the assumption of Dirichlet conditions on the electric potential presupposes the ability to control the voltage in each bath (via electrodes supporting Faradaic reaction, for example). While this assumption is reasonable for in vitro preparations such as the Ussing Chamber used in [18], it may result in a net current across the domain. We note here that it is unlikely for gastric mucus layers in vivo to support a net current. However, in this work we restrict ourselves to addressing in vitro systems such as the flux chambers used in [18, 13].
At steady state, all time derivatives must be zero. Equation (2.3) may be used to eliminate the reaction terms from (2.1). Equations (2.1) and (2.2) may then be integrated in space. This results in the following equations which describe the steady state distributions of ions and the electric potential gradient within the domain
| (2.5) |
| (2.6) |
| (2.7) |
| (2.8) |
Here, is the association constant of the binding reaction. JH and JC are the (as yet unknown) fluxes of hydrogen and chloride through the domain, which must be constant at steady state. We adopt the convention of placing a minus sign in front of JH and JC so that they conform to the standard definition of flux from left to right, down a concentration gradient in the absence of a field. Equations (2.5)–(2.8) represent the system that we wish to analyze. In particular, we are interested in determining the value of JH, as this quantifies the flux of hydrogen from one bath, through the network-filled domain, to the second bath.
2.1. Nondimensionalization.
To nondimensionalize our equations we choose a length scale equal to the size of the domain (L), and a concentration scale equal to the concentration of hydrogen chloride in the left bath (). As a scale for each ionic flux, we utilize that ion’s characteristic Fickian flux ( and for hydrogen and chloride respectively). This leads to the following non-dimensional quantities:
| (2.9) |
There is no need to scale the electric potential as it is already nondimensional. Upon nondimensionalization, (2.5)–(2.8) become
| (2.10) |
| (2.11) |
| (2.12) |
| (2.13) |
Here, is the nondimensional association constant of the buffering reaction and is the nondimensional density of binding sites/negative charge units on the background network. Our goal is to solve (2.10)–(2.13) subject to Dirichlet boundary conditions on h, c and Ψ (which will determine h, c, b, and Ψ), and then determine the flux of hydrogen through the domain (jh).
2.2. Solution.
After suitable algebraic manipulation (see Appendix A), we arrive at the following first order differential equation for the hydrogen concentration:
| (2.14) |
Separation and integration allows us to determine
| (2.15) |
where h0 = h(x)|x=0 is the left hydrogen concentration. The function F has the form
| (2.16) |
where we have defined the dimensionless parameter grouping
| (2.17) |
for convenience. We note here that (2.15) defines the spatial variable as a function of concentration, and thus h(x) is given implicitly.
Similarly, we derive a differential equation for the electric potential Ψ defined in terms of concentration h (see Appendix B). Solving this differential equation gives
| (2.18) |
The function G is given by
| (2.19) |
The degenerate cases that K = 0 and/or cT = 0 result in altered functional forms for F(u) and G(u), but do not alter the structure of the problem. In principle, (2.15) can be solved for h(x). Once that is done, (2.12), (2.13), and (2.18) may be used to simply evaluate b(x), c(x) and Ψ(x). However it still remains to determine the unknown ionic fluxes jh and jc.
2.3. Boundary Data.
We envision Dirichlet boundary conditions imposed on both dissolved ionic concentrations, as well as the electric potential. It is known that electric double layers may form at the gel/bath interface in polyelectrolyte gels. However, these layers exist on a length scale comparable to the Debye length [6], which is typically several orders of magnitude smaller than characteristic length scale of the mucus layers seen in experiments. Away from the interface, at length scales larger than the Debye length, electroneutrality holds in both the gel and the bath. We do not explicitly account for the double layer here, instead representing the apparent discontinuity (on the length scales of interest) in model variables across the gel/bath interface. As the bath contains no charged mucus network, electroneutrality implies that the concentrations of hydrogen and chloride in the bath cannot be equal to the values at the boundary of the inner domain. An interface condition must be satisfied to relate the concentrations and electric potentials within the bath to those which provide boundary conditions for (2.10) and (2.11) (which we refer to as the “inner problem”). We denote boundary conditions for the inner problem using the following notation:
| (2.20) |
| (2.21) |
| (2.22) |
These are distinct from the conditions within the two baths, which are given by
| (2.23) |
| (2.24) |
| (2.25) |
Due to the fact that we nondimensionalized concentration using the left bath concentration (), we may assume that .
The appropriate interface condition between the domain of the inner problem and the bath is given by the or so-called Donnan equilibrium potential [15]. The ion concentrations and potential jump across the interface must satisfy
| (2.26) |
for each interface (j = 0, 1). Here we have again assumed that the background network does not undergo appreciable changes in volume due to ionic concentrations, and therefore we need not account for these volume changes in the Donnan potential (as is done in [19, 6]). Furthermore, following the work of [15], we have assumed that the dissolved ionic species occupy no volume (a dilute solution), and therefore osmotic pressure need not be accounted for in the Donnan potential.
After suitable algebraic manipulations (see Appendix C), it may be shown that the interior hydrogen concentration at the interface () is implicitly defined by the (unique positive) solution to the polynomial equation
| (2.27) |
The case that K = 0 and/or cT = 0 is degenerate, and a lower order polynomial equation must be solved for the inner concentration. However, in both of those cases the polynomial has a unique positive (physical) solution. Once (2.27) is solved for , the potential for the inner problem boundary condition may be evaluated via
| (2.28) |
We refer to this process of determining the boundary conditions for the inner problem from the bath conditions as the “Donnan problem.”
2.4. Determining Fluxes.
Solution to the full system proceeds in the following manner:
Given parameters within the domain which characterize the electrochemical nature of the background material (K and cT), as well as bath concentrations (), we can solve (2.27) for the inner concentration of hydrogen at each interface (), and then evaluate the corresponding electric potential via (2.28).
- In (2.29) and (2.30), we have suppressed the dependence of the left hand sides on the fluxes jh and jc. This means that the boundary conditions can be written in the form
(2.31)
where all variables are known from data, except jh and jc. To determine the unknown fluxes, we must simultaneously solve and . We solve this system numerically using the fsolve routine in Matlab.(2.32) Upon solving (2.31) and (2.32) for the fluxes jh and jc, we can evaluate (2.15) and (2.18) to determine the hydrogen concentration and electric potential (implicitly) within the domain.
3. Results.
In subsections 3.1 to 3.3, we consider the case where (i.e. the right bath concentration is twice that of the left bath). In a standard diffusive system, these boundary conditions would generate a linear concentration profile and a unit flux from right to left, for both ionic species ((jh, jc) = (−1, −1)). In subsection 3.1, we show how the applied electric potential (Ψ1) alters the flux of ions across the domain, while in subsections 3.2 and 3.3 we illustrate the impact of the mucus network charge and binding affinity. Finally, in subsection 3.4 we explore the effect of bath concentration and show that the Donnan potential at the mucus interface is responsible for the overall behavior of the ionic flux.
3.1. No Mucus.
Letting cT = 0 and K = 0 (although this does not matter), the solution to the Donnan Problem is and . Evaluating (2.28) yields at both interfaces (i.e. the potential drop across the inner domain is exactly the potential drop from bath-to-bath). Solving (2.31) and (2.32) can be visualized as identifying intersection of the level set and the level set for various values of . Figure 1 shows contours in the jh-jc plane for the functions and . We have specifically identified the intersection for (i.e. both baths at the same potential) and . The blue circle shows the solution (jh, jc) ≈ (−1, −1) (for ), which is the flux one would expect from a standard diffusive process. The purple diamond shows the solution (jh, jc) ≈ (−1.721, −0.278) (for ).
Fig. 1.

Level curves of and . The solid black curve indicates . Colored lines indicate various level sets of . The solid gold region indicates fluxes which result in an ill-posed or unphysical problem. The blue circle indicates the numerical solution of , . The purple diamond indicates numerical solution of , .
Once the fluxes (jh, jc) are known, we evaluate x(h) (via (2.15)), c(h) (via (A.1) in Appendix A), and Ψ(h) (via (2.18)). However, we plot these as h(x), c(x), and Ψ(x) for visualization purposes. The resulting profiles of hydrogen, chloride, and electric potential are shown in Figure 2 (left panel for Ψ1 = 0 and right panel for Ψ1 = 0.5). In both cases, the ion profile appears linear (as one would expect from a purely diffusive system). In the left panel, the imposed potential drop across the domain drives an additional flux of hydrogen from right to left (jh ≈ −1.7621 < −1), while simultaneously decreasing the magnitude of chloride flux (jc ≈ −0.278 > −1), even though the bath and boundary concentrations remain unchanged. Thus, our system is electrogenic, but that is not surprising given that an electric field was imposed by the bath potentials. We note that in the left panel, the graph indicates a potential difference from the right to left boundary. However, this potential drop is minuscule (on the order of 10−11) and due to numerical error associated with solving the system
Upon re-dimensionalization, we see that this is a total potential variation across the domain of ≈ 3 × 10⁻¹³ V.
Fig. 2.

Hydrogen and chloride concentrations and electric potential profile as functions of space. The dashed cyan (ionic concentrations) and blue (electric potential) lines indicate values within the “baths”, which in this case are equal to the boundary values for each species. In the case that cT = 0, electroneutrality guarantees that hydrogen and chloride concentrations are equal. Left panel shows model solution with no applied potential drop (), while the right panel shows solution with an applied potential drop of .
3.2. With Mucus.
Now we investigate the behavior of the system when the background network is added. We assume that cT = 0.5 and maintain K = 0. This means that the mucus is not chemically reactive, but its electrical charge must be accounted for. In the case where not potential drop is applied from bath to bath (Ψ1 = 0), solving (2.27) and evaluating (2.28) with the given bath concentrations yields
Note that even though no potential gradient was imposed from bath to bath, the Donnan equilibrium potential still requires that there be a potential gradient across the inner domain. Figure 3 shows the contours of and . Generically, the addition of mucus to the domain has caused the level curves of to rotate clockwise. This means that for a given potential at the right interface, the flux of hydrogen will decrease and the flux of chloride will increase. Figure 3 also shows the desired level-set intersection for (blue circle) at (jh, jc) ≈ (−1.196, −0.835). These fluxes are used to determine the concentration and potential profiles, which are shown in Figure 4.
Fig. 3.

Level curves of and . The solid black curve indicates . Colored lines indicate various level sets of . The solid gold region indicates fluxes which result in an ill-posed or unphysical problem. The blue circle indicates the numerical solution of , .
Fig. 4.

Hydrogen and chloride concentrations and electric potential as functions of space. The dashed cyan (ionic concentrations) and blue (electric potential) lines indicate values within the baths.
We pause here to note that the interface conditions require that at the right and left boundaries, the hydrogen concentration is greater than the concentration in the bath immediately adjacent. However, this difference between inner concentrations and bath concentrations is more pronounced on the left than on the right, which leads to a concentration difference across the inner domain which is smaller than one would expect based on the bath concentrations. This decreases the diffusive flux of hydrogen from the right end of the domain to the left. Conversely, the interface conditions give a potential change (measured from bath to inner) which is always negative, but more pronounced on the left. This induces a potential drop from x = 1 to x = 0, even though the baths are at the same potential. The resulting potential gradient induces an additional flux of hydrogen from right to left. This electrically induced flux more than compensates for the decrease in diffusive flux, thereby increasing the magnitude of jh. The flux of hydrogen to the left is actually greater than one would initially expect from standard diffusion only considering the bath concentrations.
3.3. Mucus Charge Enhances Hydrogen Flux.
We now calculate the resulting flux of hydrogen through the domain for various values of cT. We always keep the bath conditions the same (, , and ). For these bath concentrations, purely Fickian diffusion would lead one to “expect” a unit flux from right to left (jh = −1). The resulting values of jh as a function of cT are shown in Figure 5. For all parameter values, we observe negative flux (right to left). However, as cT increases, the magnitude of this flux does as well. In all cases, the magnitude of flux is greater than or equal to the expected Fickian flux. The Donnan potential generated by the interface conditions actually enhances diffusive transport through the medium. In the limit that cT → 0, this effect diminishes and we recover the expected flux.
Fig. 5.
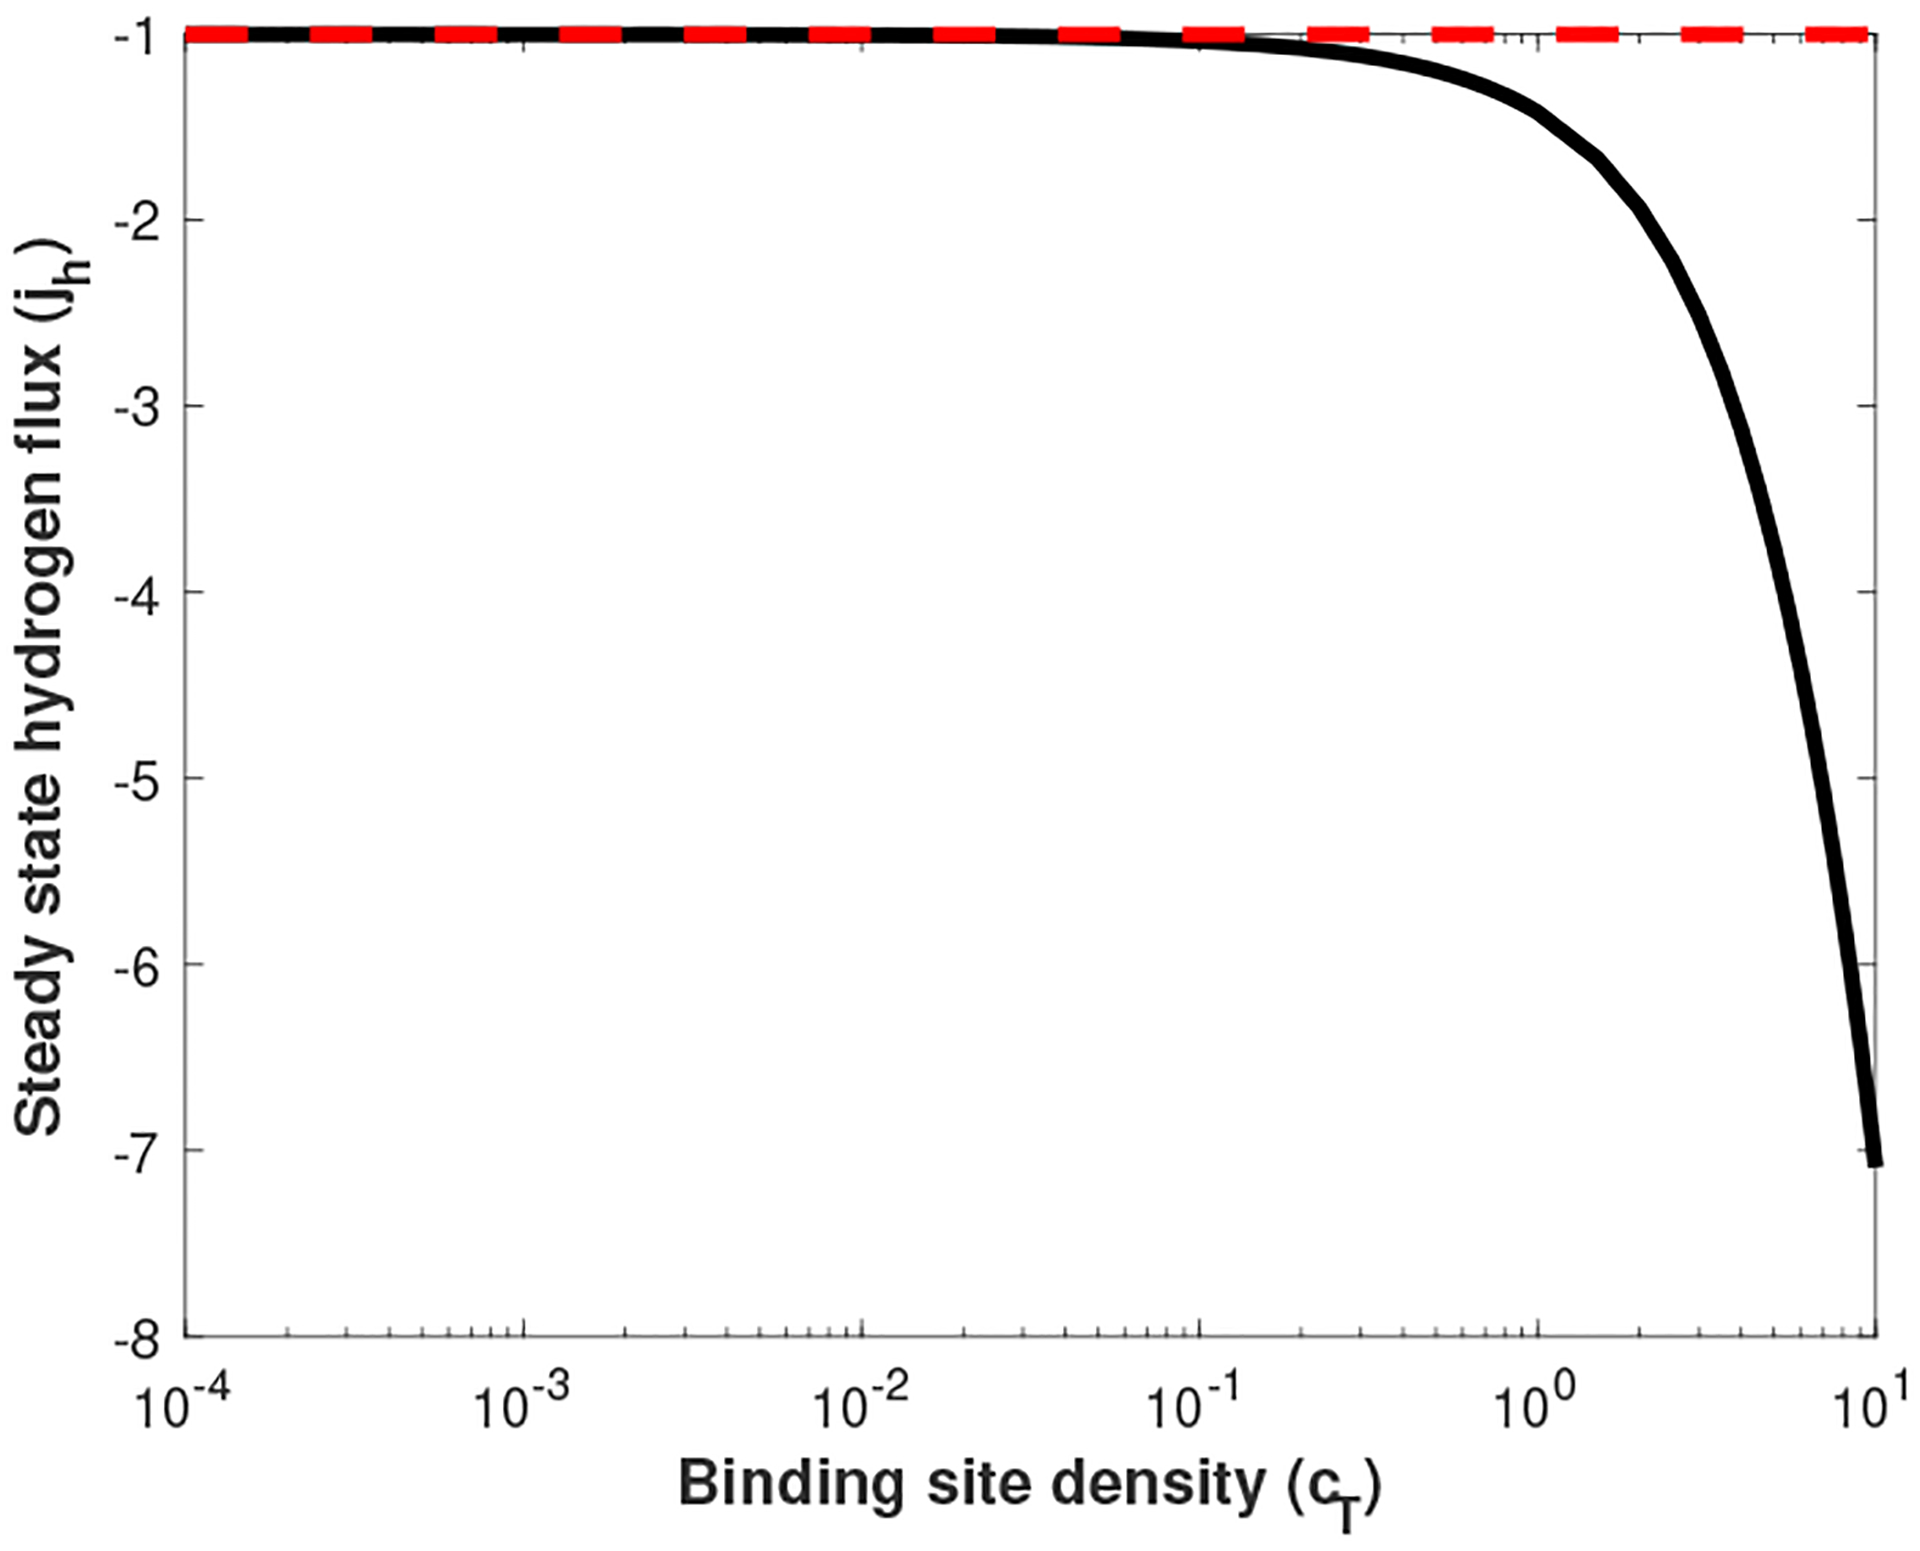
The calculated flux of hydrogen through the interior (jh) as a function of mucus charge density cT. The black line indicates calculated values of jh, while the dashed red line indicates “expected” flux of hydrogen due to Fickian diffusion alone. All data generated with K = 0, , and .
Repeating this same experiment for various values of binding affinity (K) leads to a similar conclusion. Figure 6 shows a contour plot of jh as a function of both K and cT. We see similar behavior. In the limit of small cT or large K, the flux of hydrogen approaches −1. The limits of small cT and large K are where one would expect the Donnan equilibrium potential jump to be smallest, because these are the cases where the charge due to unbound mucus on the interior is smallest (due to there either being no mucus to bind or the mucus being almost entirely bound, and thus charge neutral, at equilibrium). However, it is possible to drastically increase the magnitude of hydrogen flux when cT is large and K is small. In this limit, there is a large charge due to the background material which is not neutralized by hydrogen binding (due to low affinity), and thus a large Donnan equilibrium potential jump. For some parameter values, jh may be roughly 40 times what one would expect via Fickian diffusion. It is still somewhat surprising that in all cases, the Donnan equilibrium potential enhances transport across the entire domain.
Fig. 6.

The calculated flux of hydrogen through the interior jh as a function of mucus charge density cT and binding hydrogen binding affinity K. All data generated with and .
3.4. Donnan Potential Enhances Flux.
To explain the increased flux of hydrogen, we consider the (algebraically) simpler case K = 0. Appendix D shows that for the purposes of determining the boundary concentration and electric potential, this is sufficient. To determine the internal concentration (and thus the boundary condition to the inner problem), we must solve (2.27). This leads to the following expression for the internal hydrogen concentration
| (3.1) |
Thus, the ratio of the outer and inner concentrations is completely determined by the ratio of bath concentration and mucus charge density ():
Consequently, the Donnan equilibrium potential change is given by
The following behaviors are clear:
Both the ratio and the difference are monotonically increasing functions of .
As , the ratio , and as , the ratio .
As , the difference , and as , the difference .
These relationships as a function of are shown in Figure 7. A single curve indicates both the ratio of concentrations (left axis), as well as the potential difference (right axis), which is simply the logarithm of this ratio. Clearly, the potential difference (inner minus outer) is always negative, and monotonically increasing in external concentration. In the limit of large bath concentration, it approaches zero. This means that the bath with the smaller concentration will always induce a Donnan potential which is larger in magnitude. Therefore there will be a potential gradient in the inner domain which drives hydrogen towards the bath with smaller concentration. This potential gradient is responsible for the enhanced diffusive flux of hydrogen. Clearly, this potential gradient also hinders the transport of the oppositely charged species (chloride). Furthermore, it is clear that a background material that carried a net positive charge would have the opposite effect, retarding the flux of hydrogen across the domain, and enhancing the transport of chloride. Positive binding affinity K simply attenuates these behaviors without changing them qualitatively. The result of K > 0 is that some amount of hydrogen is bound to the background material at equilibrium. This results in some amount of unbound charge on the network f = cT/(Kh + 1) < cT. In this case, all the results of this section apply, but with cT replaced by f (see Appendix D). In the limit that K → ∞, all of the available charge on the network will be neutralized by bound hydrogen, meaning f → 0. In this case, the solution to the Donnan problem is trivial (inner concentrations and potential are equal to outer), and the system behavior reduces to standard Fickian diffusion.
Fig. 7.

The ratio of external-to-internal hydrogen concentrations (), as well as the Donnan equilibrium potential, shown as a function of external concentration. The left axis indicate concentration ratios, while the right axis shows the Potential drop ().
4. Discussion.
In this paper, we have analyzed a simple model of electrodiffusion of hydrogen and chloride through a charged mucus layer between two baths. We characterized the steady state flux of hydrogen from bath to bath as a function of bath concentration, mucus network charge density, and hydrogen/network binding affinity. Generically, flux of hydrogen ions is greater than one would expect due to a purely diffusive process governed by Fick’s law.
A major conclusion of the model analyzed is that the Donnan potential is the primary effect governing the rate at which hydrogen is transported across the domain. The chemical characteristics of the mucus network and bath concentrations of ions give rise to a potential drop and dictate the ion concentrations at each interface, which in turn govern the boundary conditions for the steady state electrodiffusive equations between interfaces. In the simplified (two ionic species, interface at both boundaries) system that we consider here, the Donnan potential drives an increase in flux of hydrogen protons. However, in a more complex system, this need not be the case, and may in-fact explain the disagreement between various experimental investigations. Our results rely on the asymmetry between the Donnan equilibrium at the left and right interfaces, but in some studies, the system considered only has a single gel/solution interface [11]. Furthermore, in this work, the Donnan potential at each interface is determined by the bath concentrations of hydrogen and chloride (which must be equal). However, some experiments use bath solutions which also contain sodium chloride [18], which necessarily alters the potential and concentration differences across each interface. An analysis of a similar model with a more complex ionic solution in each bath would be a worthwhile extension of this work. Finally, we note that our model assumes the ability to impose Dirichlet boundary conditions on the electric potential. In systems where this is not possible (in vivo, or certain experimental apparatuses), a distinct physical constraint must determine the Donnan potential (zero net current). A future analysis of such a model may shed more light on the apparent contradiction within the experimental literature, as well as more directly apply to gastric mucus physiology. A follow-up study in this direction is forthcoming.
Funding:
The work of O. Lewis and J. Keener was partially supported by NIH grant 1R01GM131408. The work of J. Keener was partially supported by NSF grant DMS-1122297.
Appendices.
A. Determining Hydrogen Concentration.
We can use (2.12) and (2.13) to eliminate b and find c in terms of h
| (A.1) |
We may also formally calculate the derivative
| (A.2) |
By multiplying (2.10) by c and (2.11) by h and adding the results, we can eliminate the electric potential to arrive at
| (A.3) |
which can be rewritten as
| (A.4) |
Substituting in (A.1) and (A.2) and solving for hx we arrive at
| (A.5) |
Equation (A.5) is a separable ODE for the unknown function h(x). Separation and integration allows us to define
| (A.6) |
where h0 = h(0) is the left dirichlet boundary condition for h. Equation (A.6) implicitly defines the hydrogen concentration as a function of x. The function F has the form
| (A.7) |
where we have defined the dimensionless parameter grouping
| (A.8) |
for convenience. We note here that this calculation is only valid so long as the integration in (A.6) is valid. This is to say, we may not integrate through any singularities of the rational function 1/f(h), which correspond to zeros of f(h). It may be assumed that K, cT, and all concentrations are non-negative quantities, and therefore non-integrable singularities correspond to solutions of
| (A.9) |
Descartes’ rule of signs states that this equation has at most one positive real solution (h*) depending on the values of K, cT and jh and jc (which are as yet unknown). If this is the case, care must be taken that our boundary data do not lie on opposite sides of this value (h(0) < h* < h(1), for example), as this produces a problem with no solution, and invalidates (A.6).
There are two degenerate cases to the above calculation. When K = 0 (i.e. the background charge exists, but hydrogen can not bind to it), then re-deriving (A.5) produces
| (A.10) |
The function that implicitly defines the hydrogen concentration is
| (A.11) |
and this expression is valid as long as the integration in (A.6) does not pass through the value
| (A.12) |
which is the pole of 1/f(h). Similarly, when cT = 0, (i.e. there is no background charge), then re-deriving (A.5) results in
| (A.13) |
which implies that the hydrogen concentration gradient is constant. Integration gives
| (A.14 |
which is always valid (there are no singularities in the integral for F). We note that in this case, the implicit definition h(x) can be readily solved, and the result is a concentration profile that is linear (as one would expect in the case of Fickian diffusion).
B. Recovering the Electric Potential.
Returning to (2.10), we can solve for the electric potential gradient to give
| (B.15) |
Formally, the chain rule gives
| (B.16) |
We may then express
| (B.17) |
Integration with respect to h yields
| (B.18) |
We note here that this definition of Ψ guarantees that Ψ(x = 0) = Ψ(h(x = 0)) = 0, which may not in general be true (again, see subsection 2.3). We may wish to investigate problems where there a non-zero electric potential at the left end of the domain. Therefore, without loss of generality we may stipulate that
| (B.19) |
The function G is given by
| (B.20) |
Again, there are two degenerate cases. When K = 0, we have
| (B.21) |
When cT = 0, we have
| (B.22) |
C. Boundary Concentration.
Ignoring the electric potential and solving for the boundary concentrations for the inner problem gives
| (C.23) |
Equations (2.12) and (2.13) (which hold on the interior of the interface) and (2.23) and (2.24) (which hold in the bath) together with (2.26) imply that
| (C.24) |
This can be rearranged to give
| (C.25) |
Solutions to this equation implicitly define the inner concentration () for each end of the domain, and thus the boundary conditions for the inner problem. Again, Descartes’ rule of signs guarantees that this equation has a single positive root, which gives the physically relevant concentration. In the case that K = 0, the same process produces the equation
| (C.26) |
which again has a single positive root. In the case that cT = 0, (C.24) reduces to
| (C.27) |
In all cases, there is a single physical solution for .
D. Equivalence of Boundary Calculations.
In the case where K ≠ 0, (2.12) implies that the concentration of hydrogen bound to the network at any point in space (and in particular, at the inner boundary) is given by
| (D.28) |
Therefore, the concentration of free (unbound) charge on the background material can be expressed as
| (D.29) |
Now, at the boundary, we know that hydrogen concentration h is the real positive solution to (C.25), and thus
| (D.30) |
It is a relatively simple calculation to show that h = −K−1 is not a solution to this equation, and thus we can divide by the term Kh + 1 to yield
| (D.31) |
This is precisely the equation which determines the inner hydrogen concentration for the case of zero binding affinity ((C.26)) if the total charge of the interior (cT) is replaced with the free charge at binding equilibrium (f = cT/(Kh + 1)). This shows that the Nernst equilibrium problem with binding has precisely the same solution as the binding free problem, where the background charge distribution is the net free charge.
REFERENCES
- [1].Cone RA, Barrier Properties of Mucus, Advanced Drug Delivery Reviews, 61 (2009), pp. 75–85. [DOI] [PubMed] [Google Scholar]
- [2].Crowther RS and Marriott C, Counter-ion binding to mucus glycoproteins, Journal of Pharmacy and Pharmacology, 36 (1983), pp. 21–26. [DOI] [PubMed] [Google Scholar]
- [3].Grimshaw PE, Nussbaum JH, Grodzinsky AJ, and Yarmush ML, Kinetics of electrically and chemically induced swelling in polyelectrolyte gels, The Journal of Chemical Physics, 93 (1998), pp. 4462–4472. [Google Scholar]
- [4].Heatley NG, Mucosubstance as a Barrier to Diffusion, Gastroenterology, 37 (1959), pp. 313–317. [PubMed] [Google Scholar]
- [5].Helfferich F and Plesset MS, Ion exchange kinetics. A nonlinear diffusion problem, The Journal of Chemical Physics, 28 (1958), pp. 418–424. [Google Scholar]
- [6].Hong W, Zhao X, and Suo Z, Large deformation and electrochemistry of polyelectrolyte gels, Journal of the Mechanics and Physics of Solids, 58 (2010), pp. 558–577. [Google Scholar]
- [7].Johansson L, Skantze U, and Loefroth J-E, Diffusion and interaction in gels and solutions. 6. Charged systems, The Journal of Physical Chemistry, 97 (1993), pp. 9817–9824. [Google Scholar]
- [8].Kaunitz JD, Barrier function of gastric mucus., The Keio journal of medicine, 48 (1999), pp. 63–68. [DOI] [PubMed] [Google Scholar]
- [9].Livingston EH and Engel E, Modeling of the Gastric Gel Mucus Layer: Application to the Measured pH Gradient, Journal of clinical gastroenterology, 21 Suppl 1 (1995), pp. S120–4. [PubMed] [Google Scholar]
- [10].Mackie JS and Meares P, The Diffusion of Electrolytes in a Cation-Exchange Resin Membrane I. Theoretical, Proceedings of the Royal Society of London. Series A. Mathematical and Physical Sciences, 232 (1955), pp. 498–509. [Google Scholar]
- [11].Marczynski M, Käsdorf BT, Altaner B, Wenzler A, Gerland U, and Lieleg O, Transient binding promotes molecule penetration into mucin hydrogels by enhancing molecular partitioning., Biomaterials science, 6 (2018), pp. 3373–3387. [DOI] [PubMed] [Google Scholar]
- [12].Newby JM, Seim I, Lysy M, Ling Y, Huckaby J, Lai SK, and Forest MG, Technological strategies to estimate and control diffusive passage times through the mucus barrier in mucosal drug delivery, Advanced Drug Delivery Reviews, 124 (2018), pp. 64–81. [DOI] [PMC free article] [PubMed] [Google Scholar]
- [13].Pfeiffer CJ, Experimental analysis of hydrogen ion diffusion in gastrointestinal mucus glycoprotein., American Journal of Physiology, 240 (1981), pp. G176–82. [DOI] [PubMed] [Google Scholar]
- [14].Schlögl R and Helfferich F, Comment on the Significance of Diffusion Potentials in Ion Exchange Kinetics, The Journal of Chemical Physics, 26 (1957), pp. 5–7. [Google Scholar]
- [15].Sircar S, Keener JP, and Fogelson AL, The Effect of Divalent vs. Monovalent Ions on the Swelling of Mucin-Like Polyelectrolyte Gels: Governing Equations and Equilibrium Analysis, The Journal of Chemical Physics, 138 (2013), pp. 014901–014901. [DOI] [PMC free article] [PubMed] [Google Scholar]
- [16].Tam PY and Verdugo P, Control of mucus hydration as a Donnan equilibrium process., Nature, 292 (1981), pp. 340–342. [DOI] [PubMed] [Google Scholar]
- [17].Verdugo P, Deyrup-Olsen I, Martin AW, and Luchtel DL, Polymer Gel Phase Transitions: The Molecular Mechanism of Product Release in Mucin Secretion?, in Mechanics of swelling: from clays to living cells and tissues, Springer-Verlag Berlin Heidelberg, 1992, pp. 671–681. [Google Scholar]
- [18].Williams SE and Turnberg LA, Retardation of Acid Diffusion by Pig Gastric Mucosa: a Potential Role in Mucosal Protection, Gastroenterology, 79 (1980), pp. 299–304. [PubMed] [Google Scholar]
- [19].Yu Y, Landis CM, and Huang R, Salt-Induced Swelling and Volume Phase Transition of Polyelectrolyte Gels, Journal of Applied Mechanics, 84 (2017), p. 051005. [Google Scholar]